A Thesis Submitted for the Degree of PhD at the University of Warwick
Permanent WRAP URL:
http://wrap.warwick.ac.uk/109589
Copyright and reuse:
This thesis is made available online and is protected by original copyright.
Please scroll down to view the document itself.
Please refer to the repository record for this item for information to help you to cite it.
Our policy information is available from the repository home page.
TH E BRITISH LIBRARY
BRITISH THESIS SERVICE
COPYRIGHT
Reproduction of this thesis, other than as permitted under
the United Kingdom Copyright Designs and Patents Act
1988, or under specific agreement with the copyright
holder, is prohibited.
This copy has been supplied on the understanding that it
is copyright material and that no quotation from the thesis
may be published without proper acknowledgement.
REPRODUCTION QUALITY NOTICE
The quality of this reproduction is dependent upon the
quality of the original thesis. Whilst every effort has been
made to ensure the highest quality of reproduction, some
pages which contain small or poor printing may not
reproduce well.
Previously copyrighted material (journal articles, published
texts etc.) is not reproduced.
Analysis o f Microbial Diversity in Polluted
and Non-Polluted Soils: A Comparison o f
Genetic, Functional and Culture Based
Techniques.
By
Joy E. M. Watts, B.Sc. (Hons).
A thesis presented for the degree o f D octor o f Philosophy.
Department o f Biological Sciences, University o f W arwick.
CONTENTS.
Section. Title. Page.
Copyright i
Summary ii
Abbreviations iii
List of Figures v
List of Tables ix
Declaration xi
Acknowledgements xii
Publications and Presentations xiii
Chapter 1. General Introduction.
1. Introduction 1
1.1. The Soil Environment 1
1.1.1. Soil Aggregates 3
1.1.2. Aggregate Hierarchy 5
1.2. Soil Microflora 7
1.3. Microbial Diversity 9
1.4. Microbial Community Analysis Techniques 12
1.4.1. Culturing and Isolation o f Microorganisms from the 14
Environment
1.4.2. Analysing Microbial Communities Using Genetic 15
Techniques
1.4.2.1. Extraction o f Environmental Nucleic Acids 16
1.4.2.2. PCR Detection 16
1.4.2.3 Analysis o f Communities Using Nucleic Acid Probes 18
1.4.2.4 Genetic Fingerprinting Techniques 18
1.4.2.5. Denaturing Gradient Gel Electrophoresis (DGGE) and 21
1.4.3. Functional Activity Measurements 23
1.4.3.1. Detection of Functional Activity in Environmental 23
Samples
1.4.3.2. Biolog Analysis 24
1.5. Aims of the Project 27
1.5.1. Summary of Aims 28
Chapter 2. Materials and Methods.
2.1. Soils 29
2.2. Media and Solutions 29
2.3. Soil Analysis 32
2.3.1. Air Dried Soil Fractionation 32
2.3.2. Soil Fractionation of Fresh Warwickshire Soil 33
2.4. Selective Counts and Isolation Procedures 34
2.4.1. Actinomycète, Pseudomonad and Total Counts 34
2.4.2. Isolation of Actinomycètes from Soil 34
2.4.3. Storage of Isolates 35
2.5. DNA extraction and Purification 35
2.5.1. DNA Extraction from Soil 36
2.5.2. Quantification of Soil DNA 36
2.5.3. Extraction of DNA from Actinomycète Cultures 37
2.5.4. Extraction of DNA from Non-actinomyccte Cultures 37
2.5.5. DNA Extraction from Agarose Gels 37
2.5.6. Polymerase Chain Reaction 38
2.5.6.1. Standard PCR Reaction 38
2.5.7. Electrophoresis 40
2.5.8. Sequencing 41
2.5.9 DNA Manipulation Programmes Used on the World Wide 41
Web
2.6.1. Addition of High GC clamp during PCR for DGGE 41
analysis 41
2.6.2. Perpendicular Denaturing Gradient Gel Electrophoresis 41
2.6.3. Travel Denaturing Gradient Gel Electrophoresis 41
2.6.4. Parallel Denaturing Gradient Gel Electrophoresis 42
2.6.5. Denaturing Gradient Gel Staining 42
2.6.6. Sequencing Bands from DGGE Gels 42
2.7. Radioactive Probing Procedure 43
2.7.1. Southern Blotting 43
2.7.2. Prehybridisation 43
2.7.3. Preparation of 32P labelled Oligonucleotide Probe 43
2.7.4. Hybridisation 44
2.7.5. Stringency Washes 44
2.7.6. Autoradiography 44
2.7.7 Radioactive Filter Stripping 44
2.8. Biolog Community Analysis 45
2.8.1. Soil Treatment and Inoculation into Biolog Plates 45
2.8.2. Biolog Plate Reading 45
2.8.3. Statistical Analysis o f Biolog Plates 46
2.8.4. DNA Extraction from Biolog Plates 46
2.8.5. Statistical Analysis 47
2.9. Microcosm Experiments 48
2.9.1. The Microcosm System 48
2.9.2. Sampling the Microcosms 49
Chapter 3. Warwick Soil Fractionation and Community Analysis
3.1. Introduction 50
3.1.1. Bacterial Location in Soil 50
3.1.2 Specific Bacterial Group Location 54
3.1.2.2. Pseudomonads 55
3.1.3. Soil Storage 56
3.1.4. Techniques for Assessing Bacterial Location in Soil 57
3.1.5. Aims of the Warwick Soil Experiment 59
3.2. Results 59
3.2.1. Sieving Analysis 59
3.2.2. Selective Plate Counts 61
3.2.3. DGGE Analysis o f the Warwick Soil Fractions 63
3.2.4. Metabolic Activity of the Different Sized Soil Fractions 65
3.2.5. Analysis of the Biolog Plates by DGGE 65
3.2.6. Probing Analysis of DGGE Gels 71
3.3. Discussion 71
3.4. Future Work 77
Chapter 4. Comparison of Polluted and Non-Polluted Soils and
Microcosm Studies.
4.1. Comparative Analysis of Diversity in Soils 78
4.1.1. Examination of Microbial Diversity in Polluted Soils 78
4.1.2. The Earth Centre 80
4.1.3. Aims 84
4.2. Results 84
4.2.1. Sieving Analysis 84
4.2.2. Selective Plate Counts 87
4.2.3. Metabolic Activity Analysis o f the Different Sized Soil
Fractions
90
4.2.4. Genetic Analysis of the Six Different Size Fractions of
the Warwick, Doncaster Polluted and Doncaster Non-
Polluted Soils
90
4.2.5. Isolate Analysis From the Three Soils 92
4.2.6.1. Microcosm Selective Plate Analysis 94
4.2.6.2. Microcosm Biolog Analysis 101
4.2.6.3. Microcosm DGGE Analysis 105
4.3. Discussion 105
4.4. Future Work 111
Chapter 5. The Use of Microbial Community Analysis Techniques
To Monitor A Bioremediation Field Trial
5.1. Bioremediation 111
5.1.2. Bioremediation Treatment Processes 113
5.1.3. The Importance of Molecular Biology and Microbial
Ecology in Assessing Bioremediation
116
5.1.4. Monitoring a Bioremediation Field Trial 118
5.1.5. Aims 121
5.2. Results 122
5.2.1. Selective Plate Counts 122
5.2.2. Biolog Analysis 127
5.2.3. Genetic Analysis 129
5.2.4. Percentage Decrease in 16 PAH Compounds in the
Treatment Pits from September 1997 to May 1998
135
5.3. Discussion 135
5.4. Future Work 142
Chapter 6. Assessment of the Biolog Community Analysis Technique
6.1. Biolog Analysis 143
6.1.2. Aims 145
6.2. Results 145
6.2.2. AWCD Using GN and GP Biolog Plates After 48 to 96 h 145
Incubation
6.2.3. DGGE Analysis o f GN and GP Biolog Plates 147
6.2.4. Sequence Analysis o f Selected Bands 151
6.2.5. Optical Density Development and the Detection of Bands 151
on DGGE Gels
6.3. Discussion 155
6.4. Future Work 158
Chapter 7. General Discussion 159
Chapter 8. References 168
Chapter 9. Appendices
9.1 Total Metal Content Determined by Inductively Coupled 187
Mass Spectrophotometry in Warwick and Polluted and
Non-Polluted Doncaster soils
9.2 Site Descriptions 187
9.3 A Map of the Earth Centre Site 188
9.4 The 16 Polyaromatic hydrocarbons compounds designated 189
as priority pollutants by the US Environmental Protection
COPYRIGHT.
Attention is drawn to the fact that copyright of this thesis rests with its author. This
copy of the thesis has been supplied on the condition that anyone who consults it is
understood to recognise that its copyright rests with its author, and that no quotation
from this thesis and that no information derived from it may be published in any
circumstances whatsoever.
SUMMARY.
The examination of the microbial communities from different soils was conducted by means of a polyphasic approach utilising traditional culturing methods, taxonomic analysis (DGGE) and potential metabolic activity assays (Biolog). To examine how representative the Biolog assay was of the total bacterial community DGGE analysis o f selected wells from Biolog Gram positive and Gram negative plates which were incubated over 96 hours. The results indicated a considerable enrichment effect of the microbial community in comparison with the original soil community. Taxonomic analysis of Biolog wells identified Pseudomonas species as the dominant microorganism present. Despite this enrichment effect Biolog analysis could still be used to provide a reproducible measure of potential metabolic activity in the soil and to analyse temporal changes.
A wet sieving technique was used to examine the location of specific bacterial groups in Warwick soil. Wet sieving allowed reproducible separation of the soil into six different sized water-stable aggregates. The community analysis of these different sized soil fractions indicated that actinomycètes were located in higher numbers in the larger soil particles. Whereas pseudomonads were found in higher numbers in the smaller soil particles. Each aggregate fraction had a distinct and different microbial community. Correlations were found between the taxonomic diversity, culturable plate counts and metabolic potential.
The polyphasic approach was used to compare Warwick soil with polluted and non- polluted Doncaster soils obtained from a coal spoil site. Soil fractionation analysis established that different microbial communities were present in the polluted and non- polluted soil fractions . The polluted soil had reduced genetic diversity, metabolic activity, fewer culturable propagules, and a very different soil particle distribution pattern when compared with the two non-polluted soils. Microcosms containing differing proportions of Warwick and Doncaster polluted soil were prepared to study the impact of pollutants on soil microbial communities. Microcosms containing high proportions of polluted soil resulted in the reduction of microbial potential activity, taxonomic diversity and culturable numbers. In the microcosm systems containing low proportions of polluted soil, potential metabolic activity was stimulated; this was also reflected in changes in the genetic diversity.
Community analysis techniques were used to monitor a bioremediation field trial with industrial collaborators BG pic. (formerly British Gas). This field trial involved five soil treatment pits containing a complex mixture of polyaromatic hydrocarbons compounds, subjected to varying conditions designed to stimulate biodegradation rates. Analysis identified dominant bacterial groups present in the bioremediation treatment pits and provided a rigorous evaluation of the microbial diversity present. A combination of microbial analysis with physical and chemical data (provided by BG pic.) allowed the identification of treatments providing the highest rates of bioremediation. Polyaromatic hydrocarbon degradation in the different treatment pits did correlate with the highest potential metabolic activity, genetic diversity and culturable numbers.
ABBREVIATIONS.
A Adenine
ANOVA Analysis of variance statistical test
ATP Adenosine 5-triphosphate
bp
Biolog GN
Biolog GP
CFU
Base pair
Biolog Gram negative plates
Biolog Gram positive plates
Colony forming unit
°C Degrees centigrade
d Day
DGGE Denaturing gradient gel electrophoresis
DNA Deoxyribonucleic acid
dsDNA Double stranded DNA
ddHzO Double distilled water
EDTA Ethylenediaminetetraacetic acid
g G + C
Gram
Guanine and Cytosine
h Hour
P Micro
Pg Micrograms
P g / g p g / ml
Micrograms per gram
Micrograms per millilitre
mg
m g / g
mg / ml
Milligrams
Milligrams per gram
Milligrams per millilitre
min Minute
ml Millilitre
mM Millimolar
M Mole
NA Nutrient agar
ng Nanograms
ng / ml Nanograms per millilitre
PCA Principal component analysis
PCR Polymerase chain reaction
PEG Polyethylene glycol
RASS Reduced arginine salts solution
RNA Ribonucleic acid
Rnase Ribonuclease
rRNA Ribosomal ribonucleic acid
rpm Revolutions per minute
SDS Sodium dodecyl sulphate
SDW Sterile distilled water
s second
sp. Species
TAE Tris-acetate EDTA
TBE Tris borate EDTA
TE Tris-EDTA
TRIS Tris (hydroxymethyl)aminomethane
tRNA Transfer ribonucleic acid
V Volts
V / V Volume for volume
W / V Weight for volume
Xg Centrifugal force
LIST OF FIGURES.
1.1. Concept of aggregate hierarchy 4
1.2. Aggregate organisation showing the relative size of the 6
components and the major binding elements
1.3. Commonly used methods in microbial ecology 13
1.4. The denaturing gradient gel electrophoresis technique 22
1.5. Biolog analysis of soil communities 25
1.6 Polyphasic approach used in this study 27
2.1 The different microcosm systems. 48
3.1. Bacterial location in soil. 52
3.2. The wet sieving technique. 58
3.3. Percentage composition of different sized aggregates in 60
fresh and dried Warwick soil.
3.4. Selective plate counts using six different sized fractions 62
of dried and fresh Warwick soil.
3.5. DGGE separation of 16S rRNA universal PCR products, 64
from the six different size fractions of Warwick soil.
3.6. Average well colour development in Biolog GN plates 66
using the six different Warwick soil fractions.
3.7. Warwick soil (fraction 1) 16S rRNA amplified using 67
universal PCR primers from different carbon sources from
Biolog GN plates separated on a DGGE gel.
3.8. Warwick soil (fraction 2) 16S rRNA amplified using 68
universal PCR primers, from different carbon sources from
Biolog GN plates separated on a DGGE gel.
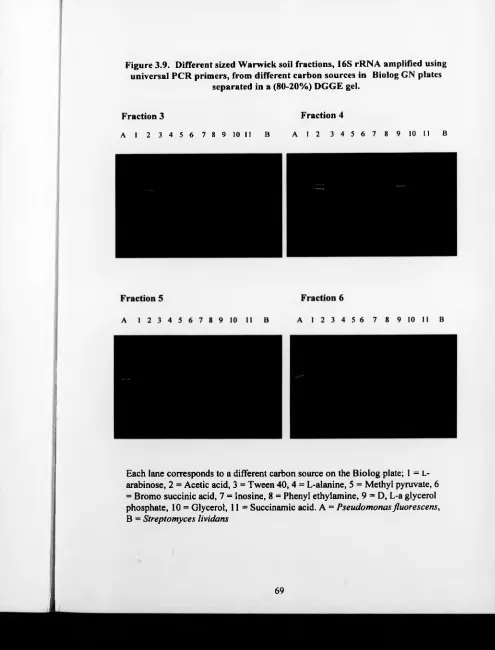
3.9. Different sized Warwick soil fractions, 16S rRNA 69
amplified using universal PCR primers, from different
carbon sources in a Biolog GN plate, separated on DGGE.
3.10. Warwick soil fractions 1 and 2 DGGE gel hybridisations 70
with universal probes.
enterprise for a sustainable future.
4.2. Top of the ‘Whaleback’, large patches o f eroded top 81
soil can be observed with high levels o f soil compaction
and the lack of vegetation.
4.3. The East side of th e ‘Whaleback', the polluted soil 83
sample site.
4.4 The non-polluted soil sample site, the pony field, 83
located opposite the mine over the river Deame.
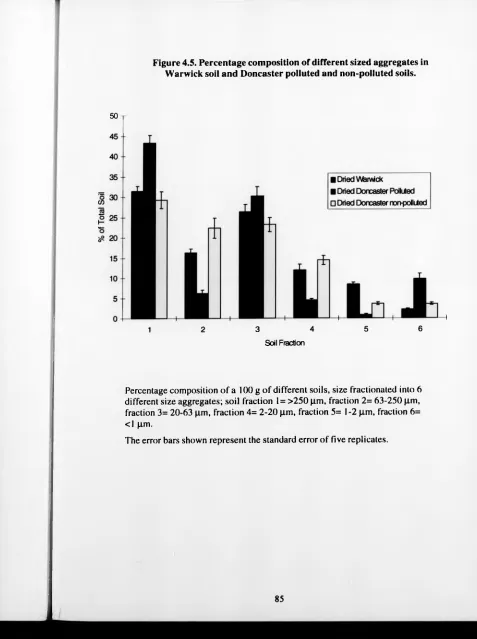
4.5. Percentage composition of different sized aggregates 85
in Warwick soil and Doncaster polluted and
non-polluted soils.
4.6 Selective plate counts using non-polluted and polluted 88
Doncaster soil.
4.7. The Average well colour development on Biolog plates 91
using Warwick, Doncaster polluted and non-polluted
soils.
4.8. DGGE o f the six different sized aggregates in polluted 93
and non-polluted Doncaster soil, 16S rRNA amplified
using universal primers.
4.9. Selective plate counts at days 1 and 2, on five 95
microcosms containing differing amounts of polluted
Doncaster and Warwick soil.
4.10. Selective plate counts on day 4 and 8, on five 96
microcosms containing differing amounts of polluted
Doncaster and Warwick soil.
4.11. Selective plate counts on days 16 and 32 in the five 97
microcosms containing differing amounts of polluted
Doncaster and Warwick soil.
4.12. Selective plate counts on day 80 in the five microcosms 98
containing differing amounts of polluted Doncaster and
Warwick soil.
4.13. Bacterial counts on selective agars using soil from 100
different microcosms containing different levels of
polluted Doncaster and Warwick soils.
4.14. AWCD in Biolog Plates for Microcosms containing 102
different amounts of Warwick and Doncaster Polluted
soil.
4.15. 16S rRNA amplified with universal primers, from all 104
five microcosms, sample days 1 to 80 with separated on
a (80-20%) DGGE gel.
5.1. Contaminant and site factors to be considered before 114
selection of a bioremediation strategy.
5.2. Bioremediation strategies (adapted from Madsen, 1998). 114
5.3. An aerial photograph of the BG pic. bioremediation 119
experiment site in Sheffield.
5.4. A schematic representation of the bioremediation 121
treatments.
5.5. Actinomycete selective plate counts from the different 123
bioremediation treatment pits.
5.6. Pseudomonad selective plate counts from the different 124
bioremediation treatment pits.
5.7. Total culturable counts on nutrient agar for different 125
bioremediation treatment pits.
5.8. Comparison of bioremediation treatments using Biolog 128
metabolic analysis.
5.9 DGGE analysis o f 16S rRNA amplified using universal 130
primers from BG pic. treatment pits from September and
November 1997 samples.
5.10. DGGE analysis 16S rRNA PCR products amplified 131
using universal primers, from BG pic. treatment pits from
March and May samples.
5.11 DGGE Analysis o f 16S rRNA PCR products 132
5.12. Percentage decrease in 16 US EPA polyaromatic
hydrocarbons (PAH) in the treatment pits from September
1997- June 1998 (from BG pic.).
134
6.1 Average Well Colour Development o f GN and GP plates. 146
6.2 DGGE analysis of selected wells on Biolog GN plates
after 48, 72 and 96 h of incubation.
149
6.3 DGGE analysis of selected wells on Biolog GN plates
after 48, 72 and 96 h of incubation.
150
6.4 Optical density of selected wells on GN and GP Biolog
plates at 48 h.
152
6.5 Optical density of selected wells on GN and GP Biolog
plates at 72 h.
153
6.6 Optical density of selected wells on GN and GP Biolog
plates at 96 h.
154
LIST OF TABLES.
1.1.
2.1.
2.2.
2.3.
2.4
2.5.
2.6.
4.1. 4.2. 4.3. 4.4. 4.5. 4.6.
Frequently used genetic fingerprinting techniques. 19
Media. 29
Antibiotic stocks. 30
Buffers, reagents and solutions. 31
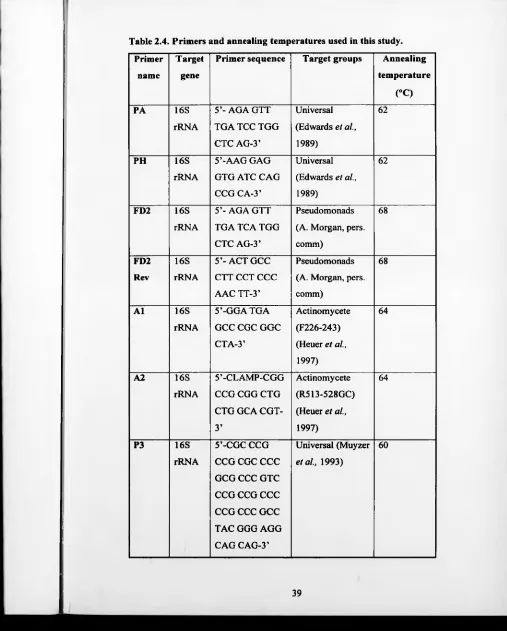
Primers and annealing temperatures used in this study. 39
The different carbon sources from GP and GN Biolog 47
plates used for DGGE analysis.
Amounts of Warwick and Doncaster Polluted soil in the 49
five different microcosm systems.
Statistical results from one-way ANOVA tests performed 86
to determine if the Warwick, Doncaster polluted and non-
polluted soils have significantly different particle
distributions at p< 0.05.
Statistical results from one-way ANOVA tests to determine 87
if the Warwick soil, Doncaster polluted and non-polluted
soils have significantly different bacterial distributions in
different size soil fractions at p< 0.05.
Statistical results from one-way ANOVA tests to 89
determine if bacterial counts are significantly different in
different size fractions in the Warwick soil, Doncaster
polluted and Doncaster non-polluted soils at p< 0.05.
Statistical results from one-way ANOVA tests performed 99
to determine if the selective counts are significantly
different in the five microcosm systems at p< 0.05.
Statistical results from one-way ANOVA tests performed 101
to determine if the three selective counts are significantly
different at each date in the different microcosm systems
at p< 0.05.
systems at p< 0.05.
4.7. One-way ANOVA tests performed to determine if AWCD 103
changes significantly over time in each microcosm system
at p< 0.05.
5.1 One way ANOVA statistical analysis to determine if 122
significant differences exists with each treatment over time
(p<0.05).
5.2 Statistical results from one way ANOVAs performed 126
between different treatments at different time points
(p<0.05).
5.3 One way ANOVA statistical analysis to determine if 127
significant differences exists with each treatment over time
(p<0.05).
5.4 One way ANOVA statistical analysis to determine if 129
significant differences exist at each time point
between different treatments.
DECLARATION
This thesis has been composed by myself and has not been used in any previous
application for a degree. The results presented here were obtained by myself and all
sources of information have been specifically acknowledged by reference.
ACKNOWLEDGEMENTS.
I would like to thank my supervisor Dr. Liz Wellington, for her enthusiasm, encouragement and academic input that has made this work possible and for the financial support that has enabled me to present my work at conferences.
I would also like to thank my surrogate supervisor, Dr. Ken Flint, for all of his advice and help throughout the three years.
I gratefully acknowledge BG. pic. for allowing me to monitor their field trial experiment, with special thanks to Richard Morris, Russell Thomas and Steve Jones.
I would like to thank Steve, Ken, Scott, Nathan, Jamie, Grace, Pauline and Karl Ritz for useful discussions and for their proof-reading skills and input into this study.
Jane Green deserves a medal for her good advice and excellent technical assistance. Thanks also to Jenny for all of her help in my last few weeks in the lab.
Numerous people in the department past and present have proven to be good friends and mostly bad influences. The list is endless but some special mentions to Scott and Nathan (the friendly Tories) Liesa, Julie, Andy, Pete, Ian, Sue, and Sharon.
Finally a big thank-you, to my family, Steve and my friends that have kept me smiling and supported me throughout the three years.
PUBLICATIONS AND PRESENTATIONS.
E. M. H. Wellington, Marsh, P., Watts, J. E. M., and Burden, J. (1997). Indirect Approaches for Studying Soil Microorganisms Based on Cell Extraction and Culturing, pp. 311-329. In Modern Soil Microbiology. (Edited by: J. D. van Elsas, J. T. Trevors and E. M. H. Wellington.)
J. E. M. Watts, Huddleston-Anderson A. S. and Wellington, E. M. H. (1998).
Bioprospecting. In Manual o f Industrial Microbiology and Biotechnology. 2nd Edition. Edited by Demain. A., In Press.
Presentations.
J. E. M. Watts and E. M. H. Wellington. Analysis o f bacterial communities in
soil using molecular and metabolic techniques. Eighth International Symposium
on Microbial Ecology (ISME-8), Halifax, Canada, August 1998. (Oral).
J. E. M. Watts and E. M. H. Wellington. Analysis of soil bacterial communities
using DGGE and metabolic techniques. 4th Molecular Microbial Ecology
Meeting, Warwick, April 16-17th 1998. (Oral).
J. E. M. Watts and E. M. H. Wellington. An Examination o f Microbial
Diversity in Polluted and Non-Polluted Soils. SGM, Dublin. Ireland, September 18-19th 1997. (Poster).
J. E. M. Watts and E. M. H. Wellington. Analysis of Bacterial Communities of
a Heavy Metal Contaminated Soil. SIM. Reno, U.S.A., August 3-5th 1997. (Poster).
J. E. M. Watts, P. W. Baker and E. M. H. Wellington. Distribution and
1. Introduction.
1.1. The Soil Environment.
Soil is a complex, constantly changing environment which, due to its high solid /
liquid ratio, contains many diverse microhabitats for microorganisms (Paul and
Clark, 1989). Soil is responsible for essential nutrient cycling and decomposition
reactions that maintain the equilibrium of the ecosystem (Prosser, 1997). Good soil
structure and fertility are requirements for high rates of crop production and
resistance to soil erosion. Soil structure and fertility is of increasing importance due
to food shortages around the world and increased levels o f desertification (Chiras,
1994).
Soil formation is the result of a number o f interactive forces including microbial
activity, climate, topography and parent material (Paul and Clark, 1989). Soil
consists of a number of different sized particles; >2 mm gravel, 2000-200 pm coarse
sand, 200-20 pm fine sand, 20-2 pm silt and <2 pm clay (Richards, 1994). The
relative proportions of each size component, combined with interactive factors,
determine the texture and physical properties o f the soil. The interactive factors
produce many different types of soil, including podzols, brown earths, lateritic and
chernozems (Gray and Wiliams, 1971). Each type of soil has distinctive
characteristics and profiles, however, many soils exist as intermediate forms of the
major groups (Paul and Clark, 1989).
Gradients will exist in the soil from the surface to the lower regions. These gradients
will include abiotic factors, such as nutrients, oxygen, light and water (Paul and
Clark, 1989). Often the highest levels of productivity and decomposition will be
present in the upper horizons of the soil (Richards, 1994). Seasonal variations in
abiotic factors can occur in the soil, for example temperature, although these changes
are often only detected in soils which undergo extreme climatic changes, as the soil is
well buffered against small changes (Gray and Wiliams, 1971).
Clay type and content has a considerable influence on the properties of the soil. Clay
particles have a larger surface area than an equivalent weight of sand or silt (Nedwell
and Gray, 1987). The clay type and content determines the water holding capacity of
the soil and water availability. Clay particles carry a net negative charge and, hence,
can interact with water and allow exchangeable ions to be replaced by H+ (Richards,
1994) and this is defined as the soil’s cation exchange capacity (C. E. C). As the clay
particles have a net negative charge, a typical soil microorganism, at neutral pH will
become attracted to clay colloids via electrostatic attraction and hydrogen bonding
(Nedwell and Gray, 1987). Clay particles are not free in the soil, due to their charge
and size they exist as coatings on larger particles, or through interactions with other
clay particles that bridge domains between the larger particles in the soil (Stotzky,
1997).
The microbial community present in soil is in part determined by the nature of the
nutrients available (Paul and Clark, 1989). Most substrates are found in the upper
most layers of the soil or plant roots, which penetrate the soil (Liesack et al., 1997).
These nutrients, with the exception of root exudates, are enclosed in insoluble
matrices which must be broken down before they can be utilised. Substrates will be
unevenly distributed in the soil as a result of water leaching and transport by
macroorganisms (Stotzky, 1997).
To fully appreciate the soil environment, the microscale is of uppermost importance
(Hattori and Hattori, 1993). In the microenvironment, the spatial arrangement of soil
particles into aggregates affects the overall integrity and subsequent fertility of the
1.1.1. Soil Aggregates.
Aggregates have been defined as groups of soil particles that cohere more strongly to
each other than to other adjoining particles (Kemper and Rosenau, 1986). Soil
structure is essential in the functioning of the soil ecosystem (Jastrow et al., 1988)
and is one of the basic elements affecting soil fertility (Dabek-Szreniaeska, 1977).
This is a result of aggregates affecting a range of soil properties which control crop
establishment including water infiltration, resistance to erosion, aeration, drainage
and creation o f microhabitats for soil biota (Oades, 1993).
Microaggregates are more stable than macroaggregates (Oades and Waters, 1991)
with their size and stability being a reflection of environmental conditions (Beare and
Bruce, 1993). The effect of tillage on aggregate stability was examined by Kandeler
and Murer (1993). They showed that continuous vegetation combined with the
activities of soil microorganisms are preconditions of good aggregate stability. The
relationship between environment and aggregate stability is due to aggregate
formation being initiated by microorganisms and root exudates which combine soil
particles and clays together (Hattori and Hattori, 1993).
Soil structure is one of the factors which provides microorganisms with protection
from predation. Postma et al. (1990) suggested that small free-living amoebae were
the main predators controlling bacterial populations in soils. A soil system contains
numerous biopores formed by the action of macro and mesobiota (such as
earthworms) and these biopores allow the movement of nutrients, gases, water and
predators throughout the soil structure (Richards, 1994). Clays and other soil
particles provide microorganisms with protection from predation due to a number of
physical properties including charge, pore size inhibition and the increasing the
distance between the microorganisms and the predators (Gestel et al., 1996).
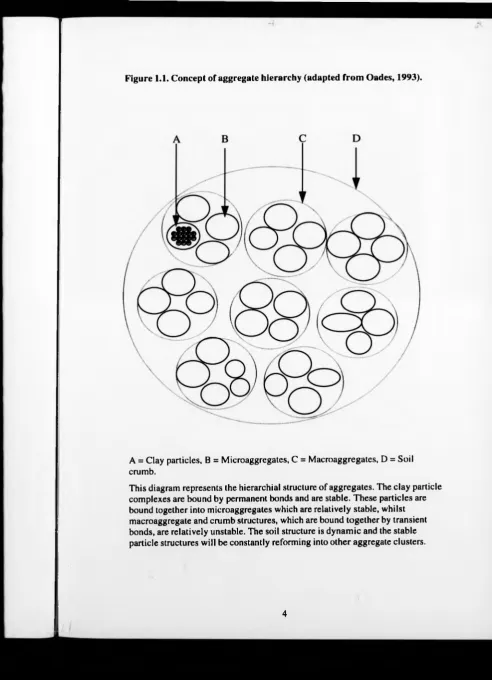
Figure 1.1. Concept of aggregate hierarchy (adapted from Oades, 1993).
A = Clay particles, B = Microaggregates, C = Macroaggregates, D = Soil crumb.
1.1.2. Aggregate Hierarchy.
Aggregate hierarchy was proposed by Tisdall and Oades (1982), who suggested that
smaller soil aggregates have a greater tensile strength. Particles are bound together
to form microoaggregates (Fig. 1.1). These particles are then combined by charge
attractions and ionic bonds. The microaggregates are the building blocks of
macroaggregates and are combined by filamentous microorganisms and roots (Fig.
1.2) which act as a ‘sticky string bag’ (Oades and Waters, 1991). This provides a
mechanical framework for the initial formation and stabilisation of the
macroaggregate (Oades and Waters, 1991).
Once initial stabilisation takes place, biological activity occurs within the structure.
This involves substantial amounts of polysaccharides and other organic compounds
being deposited, these serve to stabilise the macroaggregates (Tisdall and Oades,
1982). Microorganisms secrete insoluble viscous material of high molecular weight
into the soil which is important in the adhesion of cells to clay / soil particles and
stabilisation (Fig. 1.2). The macroaggregates combine together to form soil crumbs.
These soil crumbs are formed when macroaggregates become bound together by root
networks, and wetting and drying cycles (Tisdall and Oades, 1982). Crumbs can
combine together to form peds. Crumb and ped structures are formed by physical
forces such as drying, freeze-thaw, root growth, compaction and animal movement
(Paul and Clark, 1989).
Stability of the soil structure is dependent on the type of bonding holding the
aggregates together (Fig. 1.2). In microaggregates (<20 pm in diameter), a mixture
of clay microstuctures, biopolymers and microorganisms are responsible for binding
the particles together (Tisdall and Oades, 1982). These bonds are often strong
electrostatic attractions or adhesive biopolymers. These interactions are often classed
as permanent inorganic and persistent organic bonds and are relatively stable in the
soil (Fig. 1.2).
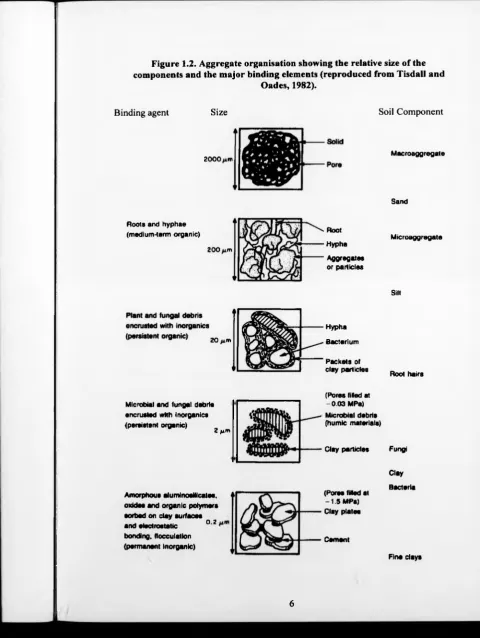
Figure 1.2. Aggregate organisation showing the relative size of the components and the major binding elements (reproduced from Tisdall and
Oades, 1982).
Binding agent Size Soil Component
M acroaggregate
Sand
Roots and hyphae
(medium-term organic) Root
Hypha
Aggregates or particles
M icroaggregate
Silt
Hypha
Bacterium
Packets of clay particles
Root hairs
Microbial and fungal debris encrusted with inorganics (persistent organic)
2 f t m
(Pores filled at -0 .0 3 MPa)
Microbial debris (humic materials)
' Clay particles Fungi
Clay
Amorphous alum inosilicates, oxides and organic polymers sorbed on clay surfaces
and elsctrostatic 0 2
bonding, flocculation (permanent inorganic)
(Pores filled at -1 .5 MPa) Clay plates
Cam eni
Bacteria
Microaggregates (20-250 pm diameter) are often based upon organic material which
has been degraded leaving recalcitrant matter such as lignin (Oades, 1993). These
aggregate structures have been stabilised by microbial biopolymers and other
physical interactions to allow the aggregate to remain intact after the organic matter
has been degraded (Oades, 1993). While macroaggregates (>250 pm) often have
large cores o f organic matter, these structures break into constituent microaggregates
when the organic matter is degraded. These interactions are often referred to as
temporary or transient bonds and are unstable in the soil environment (Tisdall and
Oades, 1982).
Soil aggregates exist in dynamic equilibrium, with various forces combining together
to create and destroy aggregate structures (Young and Ritz, 1998). Factors affecting
the degradation of aggregates include rainfall, trapped air and the microbial
decomposition o f organic materials, such as polysaccharides and humics serving to
combine particles together (Tisdall and Oades, 1982). The plasticity of the soil is
closely dependent on the water and clay content (Paul and Clark, 1989).
1.2. Soil Microflora.
Microbial communities exist in a highly complex, physical framework of variable
composition over many spatial scales (Stotzky, 1997). The soil provides substrates,
water, oxygen and protection from predation for the microorganism (Paul and Clark,
1989). However, the structure and stability of the soil is itself affected by its biotic
component (Young and Ritz, 1998). These interactions allow the formation of a soil
with good aggregate structure and high fertility, capable of nutrient cycling and high
decomposition rates.
The soil has a large biotic component, which has a major role in the formation and
function of the soil ecosystem. The biotic component can be split into three major
groups based on size: microbiota, mesobiota and macrobiota (Richards, 1994). The
macrobiota consist of the larger soil organisms such as earthworms, molluscs, large
enchytraeids and burrowing rodents. Mesobiota comprise of the smaller nematodes,
springtails, arthropods and enchytraeids, whilst the microbiota consists of the
protozoa, algae, fungi, bacteria and virus groups, each plays an essential role in the
soil environment (Richards, 1994). The microbiota interact via various biotic
relationships such as predation and competition; these biotic relationships exist
between and within groups. The microorganisms in soil will comprise numerous
groups, with communities o f different composition observed, depending on the soil
conditions and the detection method used. There are a number o f predominant
bacterial groups in soil including bacilli, actinomycetes and pseudomonads. These
groups have been reported in numbers ranging from 5-20% of the total numbers, in
different soils (Gray and Williams, 1971).
The soil microbial community is affected by a range of biotic and abiotic
interactions. Due to the discreteness of the soil habitat, the biotic interactions, for
example competition, may not be as strong as in the aquatic environment (Stotzky,
1997). As nutrients are heterogeneously distributed temporally and spatially in the
soil, microorganisms will grow only when suitable nutrients are present (Wiliams,
1985). When nutrients are depleted, the microorganisms will either die or employ a
dormancy mechanism, such as spore formation. The microorganisms will remain in
the dormant state until nutrients return to that location in the soil, or until the
microorganisms are transported to new areas containing nutrients, by indirect forces
such as transport via macroorganisms and rainfall (Paul and Clark, 1989).
It is a general belief that microorganisms in soil can be divided into two groups;
those that are oligotrophic (/^-strategists) or copiotrophic (r-strategists). The
oligotrophic organisms can be characterised by slow growth rates in low numbers.
Soil is often referred to as an unfavourable environment for microorganisms, due to
its low nutrient status and its variation of abiotic factors over the microscale (Gray
and Wiliams, 1971). The soil exerts a strong selective pressure for bacteria that can
cope with this environment (oligotrophic microorganisms) and many are highly
adapted to the ever changing conditions in the soil. Although soil is often labelled as
a harsh environment, this may be a misconception as the soil contains more species
of microorganisms (as yet cultured) than tiny other habitat (Stoztky, 1997).
bacteria that can grow at rapid rates in the presence of nutrients, but will rapidly
decline in numbers as a result of cell death or dormancy when the nutrient source is
depleted (Stoztky, 1997).
1.3. Microbial Diversity.
Microbial diversity can be considered at three different levels (Atlas, 1984;
O’Donnell et al., 1994): genetic diversity (within species), species diversity (number
of species) and ecological diversity (community diversity). Microbial community
diversity describes the heterogeneity o f the species present in an environment. To
descibe diversity there are two main components; species number, which is the total
number o f species present and species richness, which describes the evenness or
equitability of the distribution of microorganisms (Atlas, 1984). The relationship
between diversity and ecosystem function and the effect of stress on diversity have
not yet been fully elucidated in microbial ecology (O’Donnell et al., 1994).
In macroecology, many paradigms exist for the relationship between diversity and
the environment. When applying these models to microbial ecology care must be
taken, due to the differences in size of the organisms and the relationships within the
environment. Models in macroecology include the observation that plant diversity
has been shown to increase when the community survives at intermediary levels of
stress and disturbance (Wardle and Giller, 1996). It is often stated in macroecology,
that the ability of an ecosystem to withstand anthropogenic disturbance may depend
partly upon the diversity or robustness o f the community present (Fenchel, 1992;
Lovejoy, 1994). However, few studies have been performed to elucidate the
relationship between environmental conditions and diversity in microorganisms. It
has been shown that there is a beneficial relationship between microbial diversity,
soil function, plant quality and ecosystem sustainability (Kennedy and Smith, 1995).
If an environment supports a high level of diversity, associated with this diversity
will be levels of functional redundancy. This functional redundancy arises when a
number o f species conduct similar functions in the environment. If any groups of
species are removed or decreased due to stress, then the overall soil processes will
not be affected, since another species may fill this niche (Bianchi and Bianchi, 1995).
This link between diversity and functional redundancy may be an essential factor in
the resilience of soils to stress (Degens, 1998b).
The addition of toxic compounds to a microbial system have important affects on
microbial diversity. It has been proposed that if a selectively toxic compound was
added to the environment, it may increase diversity if it served to inhibit a dominant
organism (Atlas, 1984). However, most pollutants are usually toxic to a wide range
of microbes, and when added to a system, overall taxonomic and genetic diversity
decreases (Atlas, 1984). Little is known about how microbial genetic diversity
affects taxonomic diversity and how these both affect functional activity in the
environment (Zak et al., 1994). It has been hypothesised that biodiversity has
genetic foundations as diversity arises due to different evolutionary pressures. The
environment affects gene expression and ecological interactions between bacteria
(Colwell, 1992).
If increasing rates o f extinction in macroecology can be correlated with loss of
species diversity in microbial ecology, then unknown biological resources may be
lost (Lovejoy, 1994). This perceived reduction in diversity is due to a vast array of
microorganisms in the environment have as yet, not been cultured and screened for
novel metabolites and enzymes (Watts et al., 1998). If diversity is reduced in the
and antitumour agents. As a result o f widespread antibiotic resistance new and novel
antibiotics are required (Colwell, 1997). Bacterial enzymes are also used in many
industrial products such as detergents, new enzymes with the ability to withstand
temperature extremes are being isolated and optimised (Trombly, 1995).
To examine diversity and make comparisons between different habitats, diversity
indices can be utilised. A number of diversity indices exist, for example Species
Richness, Mehnhiniks’ Index, Margalef s Index, Simpson’s Index and the Shannon-
Weiner Function (Shannon index). The Simpson and Shannon index are probably
the most commonly used in microbial diversity estimation (Watve and Gangal,
1996). The diversity index measures two elements of diversity, species richness and
species equitability. The indices are based on the premise that if the probability of
two individuals being the same is low then the diversity is high. When using
diversity indices it is important to define taxonomic groups, this is often problematic
with microorganisms and these methods tend to underestimate diversity (O’Donnell
el al., 1994; Watve and Gangal, 1996). Other theoretical problems arise when
estimating microbial diversity, this includes, species contribution to diversity, for
instance, are there key-stone species in microbial communities, as in macroecology
(Harper and Hawksworth, 1994).
It is important to assess diversity in the soil ecosystem as the soil is an essential and
dynamic site for biogeochemical cycling and decomposition reactions (Richards,
1994). As soil systems are receiving increasing levels of pollutants and meeting
higher demands in agriculture, it is important to assess if there is a link between
microbial diversity and soil function (Chiras, 1994). Soil is a highly complex system
where microbes can encounter a diverse mixture of solid, liquid and gaseous phases.
These soil structures are temporally and spatially heterogeneous. This results in
many discrete microhabitats with varying abiotic conditions which favour increasing
levels o f microbial community diversity (van Elsas et al., 1998). Inherent in each
soil system is a unique microbial flora which will alter with different environmental
conditions. The changes in the microbial community are also affected by any stress
that is added to the environment (B&Mi, 1998). The measure of diversity provides
insight into the functional status o f the community (Atlas, 1984).
1.4. Microbial Community Analysis Techniques.
When examining bacterial communities there are a number of questions that need to
be addressed including which groups are present, their location, their function in the
community and how the communities develop over time. A wide range of techniques
have been developed to examine the microbial communities present# Fig. 1.3 shows
some of the methods frequently used in microbial ecology. Two main approaches
exist for the analysis of microbial communitie^/fistly the detailed examination of
isolates obtained from an environment from enrichment and other culture based y u /v
<
ltJt
techniques. Secondly, the analysis of the total community by techniques such as
nucleic acid extraction followed by further analysis such as probing or sequencing.
These two approaches often produce different estimations of diversity for a sample,
but by combining the approaches a more rigorous assessment of microbial
communities can be made. A combination of different techniques (polyphasic
approach) can be taken to help overcome the limitations of using a single method
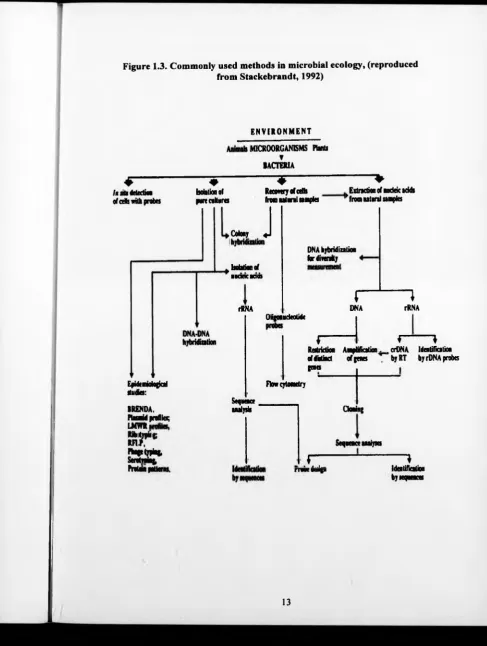
Figure 1.3. Commonly used methods in microbial ecology, (reproduced from Stackebrandt, 1992)
E N V I R O N M E N T
MICROORGANISMS Flint!
t
BACTERIA
4
h a h detection of cells with probes
♦ Isolation of purecoKures
¥ Recovery of cells from natural samples
---V
Extraction of nodeic adds
* from natural samples
Lcdony
j
Isolation of
nUCMK ICIOS
rRNA DNA hybridization iordivenity
r
DNA1
rRNAP - t J --- t - a___! __a
Lpracmmopau
studies:
BRENDA. Plasmid profiles; LMWRi
-Otigonudeotide
I---Restriction Amplification, of distinct of penes penes
Flow cytometry
Sequence analysis
s r *
Ssitf*
MfOtmMI, Frótela patter
i }
, crDNA Identification byRT by rDNA probes
Traditional methods of community analysis involve culturing microorganisms on a
range of media followed by characterisation of the isolates, allowing the detection of
changes in culturable bacterial communities (Akkermans et al., 1994). Many reports
of the non-culturability o f many bacterial species now exist (Wayne et al., 1987;
Ward et al., 1995) and bacteria which have yet to be cultured have been detected by
molecular methods (Rhiems et al., 1996) and microscopy (Hartmann et al., 1997).
Torsvik et al. (1990b) detected very high levels o f diversity in a soil system that has
not yet been reflected by culturing methods. It has been estimated that less than 1%
of bacteria from the environment can be cultured in the laboratory (Dykhuizen,
1998).
Media are often rich in nutrients, selecting for fast-growing copiotrophs rather than
the slower growing oligotrophs which are dominant in soil samples (Liesack et al.,
1997). Plates are usually incubated for 2-3 days, but this does not normally provide
adequate time for the slow-growing oligotrophs to adjust to the new conditions and if
suitable, produce colonies.
DeLiej et al. (1993) described a culture-based method for the examination of
microbial communities. This culture technique can be used to quantify the relative
numbers o f copiotrophic and oligotrophic organisms in an environment. This is
similar to the ecocollections proposed by Hattori et al. (1997) which are collections
of organisms from the same sample over time. Culture methods still play an
essential role in the study of microbial diversity. By culturing a microorganism it is
possible to elucidate its metabolic activities and maybe its role in the environment
(Palleroni, 1997).
Bacterial diversity can be evaluated by molecular techniques using the nucleic acid
component of an environmental sample. This molecular analysis is based on the
detection o f signature molecules, such as DNA and RNA (Morgan and Winstanley,
1997). Specific DNA sequence detection allows the identification of an organism
present in the environment. Detection of a specific sequence can be achieved in a
number o f ways, including PCR screening, probing and sequencing (Amann el al.,
1995). Techniques to detect mRNA are used to allow a measurement of activity, as
only active cells will be transcribing mRNA (Felske and Akermanns, 1998). In
microbial community analysis, rRNA genes have been routinely used particularly the
16S rRNA (Amann el al., 1995).
The rRNA genes are ideal signature molecules as they contain a number of domains
where sequence variation changes at different rates, leading to variation increasing
with phylogenetic distance (Liesack, 1997). These molecules have conserved and
variable domains. The conserved areas allow the determination of relationships
between kingdoms, such as Archaea and Eubacteria, whilst the variable regions allow
closely related species to be resolved (Woese, 1987).
16S rRNA analysis can be used for the prediction of function by close phylogenetic
relationship to other species. This prediction of phenotype was achieved by
Lonergan el al., (1996), when Pelobacter was predicted to be capable of growth on
Fe(III) due to its close relatedness to Geobacler and Desulforomonas. However, care
must be taken when drawing inferences of phenotype from signature molecules,
although it may sometimes allow the approximation of culture conditions for as yet
uncultured organisms.
Many studies of bacterial diversity have focused on the detection and sequencing of
bacterial isolates from the environment. This yields considerable genotypic
information about the species present. This is a time consuming method and unless
the species has already been cultured it gives no functional or activity information.
1.4.2. Analysing Microbial Communities Using Genetic Techniques.
Fingerprinting techniques can be employed to rapidly assess temporal or spatial
changes in a community. Fingerprinting techniques do not normally allow the
identification of species or the determination of activity (unless using mRNA), but
allow rapid screening and comparison of communities in different samples over time
(Colwell, 1997).
I.4.2.I. Extraction of Environmental Nucleic Acids.
The first step in any genetic analysis of a community is the extraction of nucleic
acids from an environment. For an accurate assessment of microbial diversity, the
DNA extraction procedure is of paramount importance (Steffan and Atlas, 1991).
The process of nucleic acid extraction has been extensively reviewed (Bakken, 1985;
Ogram et al., 1987; Flolben el al., 1988; Picard et al., 1992; Smalla et al., 1993;
Zhou et al ., 1996)). No single DNA extraction method can extract all DNA
molecules from the soil (van Elsas et al., 1998). Therefore, DNA extraction and
purification methods should be chosen appropriately for the environmental sample
and its characteristics.
I.4.2.2. PCR Detection.
PCR has revolutionised molecular microbial ecology by the selective amplification
of regions of DNA. Analysis by PCR can be used for the detection of bacterial
groups using signature molecules or for the detection of functional genes in
environmental samples (Watts et al., 1998). Examples of functional gene detection
includes detection of merA genes (Flart et al., 1998), methanol dehydrogenase genes
(McDonald and Murrell, 1997), polychlorinated biphenyl-degrading catabolic genes
(Walia et al., 1990) and naphthalene degrading genes (Herrick et al., 1993).
Sequencing cloned or direct PCR products, can be achieved easily and the sequence
PCR-based analysis does have limitations. For example, universal primer sets may
not detect all of the bacterial species present in an environment. Other considerations
include each primer set is affected by levels of G + C in the template DNA, the
accessibility of the template to primer after denaturation such as secondary structures
and gene copy number. Chimeric DNA molecules can affect the PCR reaction.
These are produced in the reaction by partial length fragments o f different 16S rRNA
gene type annealing to the highly conserved regions. This may be followed by
primer independent elongation to full length fragments. PCR can be inhibited by
humic acids which are present in the soil environment (Tebbe and Vahjen, 1993),
although the addition of bovine serum albumin may prevent this inhibition, (Liesack,
etal., 1997).
By using two different primer sets of identical predefined mixtures of DNA, Suzuki
and Giovannoni, (1996) determined that PCR bias was positively correlated to the
number of cycles. Heuer and Smalla, (1997b) used DGGE (Denaturing gradient gel
electrophoresis) to examine PCR biases in a mixed community. This analysis
indicated that when the template DNA was diluted, bands were detected that were
not present in the higher template DNA concentrations, as a result of preferential
amplification.
PCR provides a sensitive and rapid technique to detect species and functional genes
in environmental samples if the limitations are recognised and appreciated.
Correlation between phenotypic characterisation by molecular data will become more
reliable as more species are identified and sequenced. Most molecular studies reveal
the presence of an microorganism but not the level of its activity or its role is in the
environment. RNA studies allow the combination of presence and activity in the
environmental system to be examined (Felske and Akkermans, 1998).
I.4.2.3. Analysis o f Communities Using Nucleic Acid Probes.
Phylogenetic or function specific probes can be utilised to assess the microbial
community structure and function (Hartmann et al., 1997). Probes can be long PCR
products or oligonucleotidein length, labelled by radioactive or non-radioactive
methods including digoxenin and fluorescence (Burlage, 1998). Numerous
phylogenetic probes exist which bind to specific signature sequences on rRNA
molecules. This can provide information on what bacterial groups are present in an
environmental sample without a culture based step (Amann et al., 1995). Probes can
also detect functional abilities such as the nah gene for naphthalene degradation
(Herrick et al., 1993). Different types of probing can be used to screen either
communities or isolates. For instance colony hybridisations can be used to examine
the phylogeny or specific activities, by probing, in colonies grown on the membrane.
Dot blots involve the purified DNA being placed onto the membrane and then
hybridised with probes. This may allow quantification of the DNA if internal
standards are used (Burlage, 1998).
I.4.2.4. Genetic Fingerprinting Techniques.
Molecular fingerprinting methods have recently been reviewed (Muyzer and Smalla,
1998; Muyzer, 1998). These include Low molecular weight (LMW) fingerprinting.
Randomly Amplified Polymorphic DNA (RAPD), Restriction Fragment Length
Polymorphism (RFLP), Amplified Ribosomal DNA Restriction Analysis (ARDRA),
Single Strand Conformational Polymorphism (SSCP), Terminal Restriction
Fragment Length Polymorphism (T-RFLP), Fluorescent Restriction Fragment
Length Polymorphism (Flu-RFLP). Each fingerprinting method has its own
advantages and limitations (see Table 1.1). Fingerprinting methods allow the rapid
comparison of community structure over temporal and spatial studies. For any
environmental study, these limitations should be considered and the method most
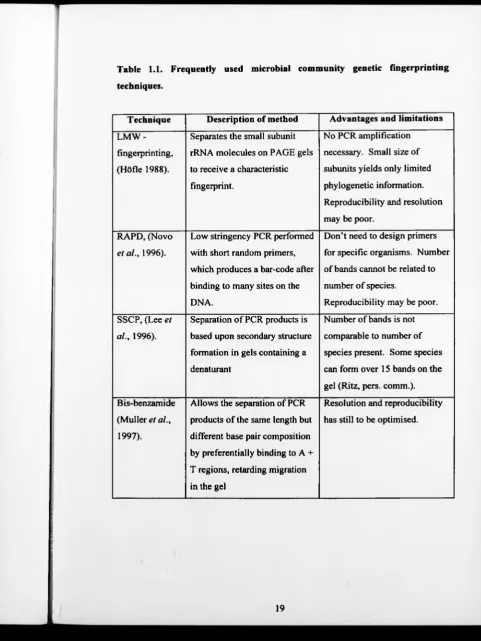
Table 1.1. Frequently used microbial community genetic fingerprinting
techniques.
Technique Description of method Advantages and limitations
LMW -
fingerprinting,
(Hôfle 1988).
Separates the small subunit
rRNA molecules on PAGE gels
to receive a characteristic
fingerprint.
No PCR amplification
necessary. Small size of
subunits yields only limited
phylogenetic information.
Reproducibility and resolution
may be poor.
RAPD, (Novo
et al., 1996).
Low stringency PCR performed
with short random primers,
which produces a bar-code after
binding to many sites on the
DNA.
Don’t need to design primers
for specific organisms. Number
of bands cannot be related to
number of species.
Reproducibility may be poor.
SSCP, (Lee et
al., 1996).
Separation o f PCR products is
based upon secondary structure
formation in gels containing a
dénaturant
Number of bands is not
comparable to number of
species present. Some species
can form over 15 bands on the
gel (Ritz, pers. comm.).
Bis-benzamide
(Muller et al.,
1997).
Allows the separation of PCR
products of the same length but
different base pair composition
by preferentially binding to A +
T regions, retarding migration
in the gel
Resolution and reproducibility
has still to be optimised.
[image:44.541.31.513.14.656.2]Technique Description of method Advantages and limitations
RFLPand
ARDRA
(Bruce et al.,
1995; Martinez-
Murcia et al.,
1995).
Involves the restriction of DNA
(ribosomal in the case of
ARDRA) and the separation of
the fragments on PAGE gels
Number of bands doesn’t
correlate with number of
species. Complex fingerprints
may be obtained which are
difficult to analyse.
Flu-RFLP or T-
RFLP (Liu et
al., 1997; Bruce,
1997).
One of the primers for the PCR
reaction is labelled with a
fluorescent dye. The amplified
products are restricted and
products are analysed on a
DNA sequencing machine
which detects the fluorescently
linked fragments.
Requires access to a DNA
sequencing machine. Patterns
produced are a lot less complex
and therefore easier to analyse
in comparison with traditional
RFLP analysis.
DGGE or
TGGE (Muyzer
étal., 1993;
Muyzer and
Smalla, 1998).
PCR products o f the same
length but different base pair
composition are separated in a
gradient o f dénaturant or
temperature
As well as obtaining fingerprint
patterns, bands can be excised
and sequenced. The method is
based on PCR and may have
limitations from any biases of
I.4.2.5. Denaturing Gradient Gel Electrophoresis (DGGE) and Temperature
Gradient Gel Electrophoresis (TGGE).
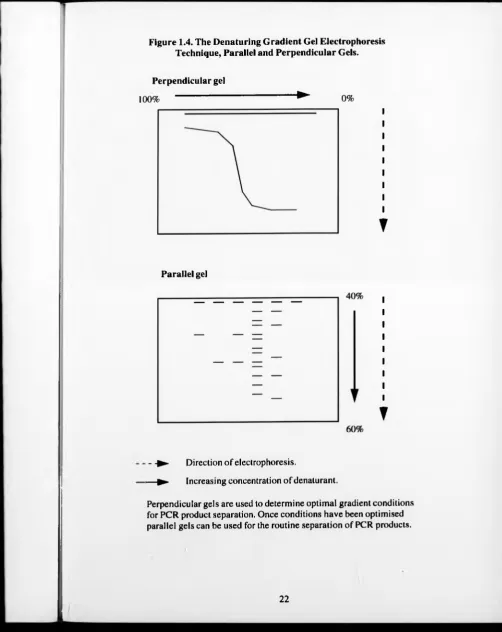
DGGE and TGGE are genetic fingerprinting techniques that allow the profiling of
complex bacterial communities. This is achieved by separating DNA molecules of
the same length but with different base pair compositions (see Fig. 1.4). DGGE is
based on the principle that an increasing gradient of denaturants will melt double
stranded DNA in distinct domains and these melted domains will have reduced
mobility in a gel. Whilst DGGE uses a denaturant to separate the dsDNA, TGGE
uses temperature. To optimise the separation of PCR products, perpendicular gels
are used (Muyzer el al., 1993). Once the optimal gradients have been found, then,
parallel gels are used for the routine separation of PCR products (see Fig 1.4 and
Section 2.6.4.).
Although most studies have used DGGE, (probably due to the availability o f the
BioRad system) TGGE was found to produce comparable patterns to DGGE (Heuer
el al., 1997). To analyse communities by DGGE, a GC clamp is usually attached to
one end of the DNA. This GC clamp consists of 30-40 G / C bases forming a high
melting point region that ensures that the region of interest is in a lower melting
domain and that the DNA will remain partially double stranded.
One of the major advantages o f DGGE as a fingerprinting system is the ability to
identify microorganisms present. This can be achieved by excising a band from a
community pattern and sequencing it (Ferris el al., 1996). This allows the rapid
analysis of community structure and the identification of the species present. Probes
can be produced and used in the original environment to identify whether the species
identified by DGGE is present in the environment. Most studies have focused on the
use of 16S rRNA operon analysis, although it is also possible to examine functional
genes using this technique (Wawer el al., 1995; Rosado el al., 1998).
Figure 1.4. The Denaturing Gradient Gel Electrophoresis Technique, Parallel and Perpendicular Gels.
Perpendicular gel
100% ^ 0%
▼
Parallel gel
▼
- -► Direction of electrophoresis.
— ► Increasing concentration of dénaturant.
Many species have been found to produce multiple bands by DGGE, possibly due to
sequence heterogeneity of the 16S rRNA genes, multiple operons and the primers
used. This is important when the number of bands is being used as an indication of
increased microbial diversity. In environmental samples with large number of
equally abundant microorganisms, highly complex banding patterns can inhibit
analysis as a product smear is obtained (Baker, 1997; Heuer el al., 1997; Heuer and
Smalla, 1997b). DGGE bands are sequenced directly, and the need for cloning,
which may impose another bias, is eliminated (Heuer and Smalla, 1997b). However,
only limited sequence information can be produced by DGGE because PCR products
separated in DGGE gels are normally less than 500 bp (Muyzer and Smalla, 1998).
1.4.3. Functional activity measurements.
I.4.3.I. Detection of Functional Activity in Environmental Samples.
The relationship between metabolic diversity and genotypic diversity is not fully
understood (Zak et al., 1994). Functional diversity arises from genetic variability,
environmental effects on gene expression and ecological interactions between
microbial populations. Analysis of the functional activity is based on the premise
that metabolic activity reflects the microbial community. Two main approaches can
be undertaken to examine functional activity in an environmental sample, specific
activity measurements or a total sample approach. Total functional activity methods
include Biolog (Garland and Mills, 1991) and in situ catabolic potential (Degens and
Harris, 1997), biomass (Jenkinson el al., 1975; Howarth and Paul, 1994) and ATP
estimation (Martens, 1985). When using a total sample approach, neither individual
species nor the activity of the individual organisms present can be detected. Care
must be taken in the analysis when comparing different sample types as some
methods can be affected by heavy metals and the type of soil present (Chander and
Brookes, 1991).