Author Anna Meimann
Student Number 1453416
Academic Year 2015/2016
First Supervisor Prof. Dr. Karlein M. G. Schreurs
Second Supervisor Dr. Hester R. Trompetter
Institute University of Twente, Enschede
Faculty Faculty of Behavioral Science
Program Psychology
Specialization Positive Psychology and Technology (PPT)
BACHELOR THESIS
Positive emotions in daily life, measured by means
of an experience sampling application
‘(…) ESM [Experience Sampling Method] provides a powerful way of moving beyond simple questions about who is “happy” and who is not, to more intricate questions about
when and why people experience positive and negative feelings.
’
1
Abstract
In this thesis a psychometric study was conducted, that aimed to measure the extent to which the short form of the Positive and Negative Affect Scale (I-PANAS-SF) measures the experience of positive emotions in the daily life by means of an experience sampling application in a reliable and valid way.
Background. The Broaden-and-Build theory of positive emotions (Fredrickson, 2001) states, that positive emotions strengthen personal growth and mental health. According to Csikszentmihalyi and Larson (2014) the experience sampling method (ESM) is appropriate to measure subjective states as positive emotions and psychological well-being. Reasoned by the assessment of the conducted scales via the ESM application in this study, the reliability and the validity of the scales needed to be examined.
Method. At first, the participants (N=31) had to fill in a retrospective baseline
questionnaire, which consisted of the extended form of the Positive and Negative Affect Scale (PANAS-X) and the short form of the Mental Health Scale (MHC-SF) to get comparative values. Aside from the baseline measurement, data was gathered four times a day for 7 consecutive days via a mobile experience sampling application called UT Survey. The participants had to fill in the short form of the Positive Affect subscale of the PANAS (I-PANAS-SF), the subscale of psychological well-being of the MHC-SF and a mood map. Results. The correlational analyses (Pearson correlation) showed that the
I-PANAS-SF correlated moderate with the PANAS-X and the mood map in total. The correlation between the I-PANAS-SF and the MHC-SF was found to be high overall. Measuring the construct of positive emotions via the mood map furthermore displayed fluctuating mean scores over as well the seven days as within the single days.
Conclusion. This study confirmed that the I-PANAS-SF is a reliable and valid scale
to measure the construct of positive emotions in daily life by means of the experience sampling method. Additionally, the constructs of positive emotions and psychological well-being have shown to be highly connected. Furthermore, the UT Survey application has proven to be an appropriate method to display occurring fluctuations in the experience of positive emotions during a week and within a day.
2
Table of Contents
1
Introduction
………... 31.1 Positive Psychology………. 3
1.2 Positive Emotions and the Broaden- and- Build Theory ………. 4
1.3 Psychological well-being ………. 5
1.4 Experience-sampling method ……….. 5
1.5 Validity ……… 7
1.6 Present study and research questions ………... 7
2
Methods
………. 102.1 Design ……….. 10
2.2 Participants ……….. 10
2.3 Procedure……….. 10
2.4 Materials ……….. 12
2.5 Measurement instruments ……… 13
2.6 Data analysis ……… 15
3
Results
……… 173.1 Concurrent validity ……….. 17
3.2 Convergent validity ………... 17
3.3 Fluctuations (mood map) ………... 20
4
Discussion
………... 224.1 Concurrent and Convergent validity of the I-PANA-SF …….… 22
4.2 Fluctuations of positive emotions in daily life ……….… 23
4.3 Server breakdown day five……….……….…. 24
4.4 Limitations ………... 25
4.5 Recommendations for future research ………. 25
4.6 Conclusion ………... 26
5
References
……… 273 In this thesis a psychometric study is conducted that aims to measure the extent to which the short form of the Positive and Negative Affect Scale (I-PANAS-SF) measures positive emotions in the daily life by means of the experience sampling method in a reliable and valid manner. Additionally, the extent to which the experience sampling application UT Survey is an appropriate method to detect fluctuations in the experience of positive emotions is examined.
1 Introduction
In the past decades it became evident that psychology is more than curing deficiencies in human functioning. In the pathological approach to psychology, humans are viewed as a passive individual, exposed to external changes and detrimental influences (Lambert & Erekson, 2008). Thus, the fulfilled individual was neglected (Seligman & Csikszentmihalyi, 2014, p. 280). Therefore, it was necessary for psychology to undergo the shift from being a victimology to being a science, focusing on human’s strengths and virtues to build up positive qualities (Sheldon & King, 2001). This new approach and arising field of science is called positive psychology. The present study is conducted in the research field of positive psychology with particular interest in measuring positive
emotions, by making use of the experience sampling method.
1.1 Positive Psychology
According to Seligman and Csikszentmihalyi (2014), positive psychology is ‘a science of
positive subjective experience, positive individual traits, and positive institutions [that] promises to improve the quality of life and prevent the pathologies that arise when life is
4
1.2 Positive emotions and the Broaden-and-Build Theory
1.2.1 Positive emotions
Emotions in general, can be described as ‘multicomponent response tendencies […] that
begin with an individual’s assessment of the personal meaning of some antecedent event […]’ (Fredrickson, 2001, p. 218). Furthermore, emotions only arise if the underlying cause has some personal meaning to the individual, and in particular to an individual’s subjective well-being. Abe (2011) states that a person’s subjective well-being can be predicted by the proportion of positive and negative emotions, which one experiences. This is also
supported by Fredrickson (2001), who describes positive emotions as ‘markers of optimal
subjective well-being’ (p.218) and as producers of flourishing that produce internal signals to approach or continue. Positive emotions are not merely markers of current well-being, but also for ‘psychological growth and improved well-being over time’ (Fredrickson, 2001, p. 218).
Next to Fredrickson, Yik, Steiger and Russell (2011) examined the construct of emotion and affect. They developed the construct of ‘Core Affect’, which is ‘a part of
mood and emotion’ (p. 705). There are 12 segments of Core Affect, which form the basis for the resulting Circumplex Model of Core Affect. This model categorizes a person’s mood and (positive) emotions in the dimensions of pleasant vs. unpleasant and activated vs. deactivated. The Circumplex Model is applied in this study in the form of a mood map to let the participants self-rate their current emotional state.
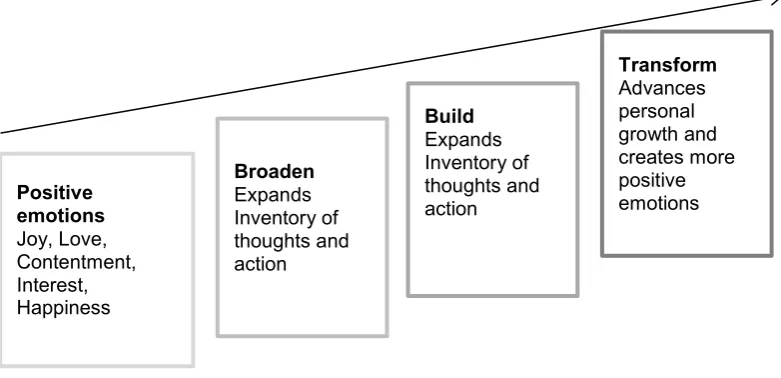
1.2.2 Broaden-and-Build Theory
5 and physical well-being. Overall, this process creates an upward spiral to enhance mental and emotional well-being (Fredrickson, 2001).
Figure 1.1 Broaden- and- build theory
1.3 Psychological well-being
As emerged from the Broaden-and-Build theory of positive emotions, the construct of positive emotions is closely related to the construct of psychological well-being. It is emphasized that positive emotions and psychological well-being are separate constructs that correlate with each other (Fredrickson, 2001). This correlation is also reported by Diener (2000), who emphasizes that high levels of positive emotions and low levels of negative emotions contribute positive to mental health and therefore to psychological well-being as well (Keyes, 2002). Houben (2015) defines psychological well-being as ‘a broad construct that involves either or both the presence of positive indicators of psychological adjustment such as positive emotionality, happiness, high self-esteem, or life satisfaction, and the absence of indicators of psychological maladjustment such as negative
emotionality, psychopathological symptoms and diagnoses.’ (Houben, 2015, p. 901). Reasoned by the close relation of experiencing positive emotions and psychological well-being, the construct of psychological well-being is taken into account in this study as well.
1.4 Experience sampling method
Biglan and Hayes (1996) accentuate that more attention has to be paid to the impact of contextual influences when it comes to displayed behavior. This is supported by Csikszentmihalyi and Larson (2014) who point out that mental health can only be understood when measuring it frequently and within every-day life situations. The
6 experience sampling, or real time data capture method (ESM) is a non- retrospective diary, which aims to collect self-reported behaviors, feelings and psychological states in real time and in the natural environment of participants (Priemer & Trull, 2009). Ebner-Priemer and Trull (2009) ascertained that the experience sampling method is appropriate to gather data about setting- or context specific relationships.
According to recent research findings, the experience sampling method is also an appropriate method for measuring subjective states as positive emotions. Csikszentmihalyi and Larson (2014) state, that the ESM reveals regularities and irregularities concerning conscientiousness of subjective states. Thus, it exposes heightened self-awareness, widened attention, or extreme concentration for example. Therefore it can be assumed, that it also displays the experience of positive emotions as happiness and joy.
7
1.5 Validity
According to Hartig, Frey and Jude (2008), validity should be described as a quality criterion that refers to different quality aspects of a scientific test. When comparing the validity of a questionnaire used in terms of two different measurement procedures, especially the content validity and the criterion validity have to be assessed. Content validity is part of construct validity and refers to the internal content consistency of a test, thus to the extent to which test content is representative for a larger sample of content (Yarroch, 1991).
Criterion validity determines the extent to which a test relates to its outcome (Law, Wong, & Song, 2004). To assess criterion validity, predictive or concurrent validity can be assessed. Concurrent validity is applied when two measurement procedures are taken at the same time to measure the same constructs. Concurrent validity is high if the test scores from a new procedure highly correlate with a confirmed measure. Next to concurrent validity, convergent validity has to be taken into account. Unlike concurrent validity, convergent validity measures the correlation between two procedures that measure related constructs. Predictive validity is established when the scores from a particular test accurately predict the construct which the test represents (Morisky, Green, & Levine, 1986).
By comparing the scores of the PANAS-X (baseline) and the I-PANAS-SF, it is examined whether the scores on both scales correlate, which aims to evaluate the concurrent validity. By having a look at the correlation between the scores on the mood map and on the I-PANAS-SF, as on the MHC-SF and the I-PANAS-SF, the convergent validity is evaluated.
1.6 Present study and research questions
8 and to make claims concerning the concurrent validity. Therefore, it is assessed to which extent the aggregated scores of both measurement instruments correlate with each other. The arising research question is:
1. To what extent do the scores on the PANAS-X PA subscale (baseline) correlate
with the scores on the I-PANAS-SF PA subscale (application)?
H: It is expected that the aggregated scores on the PANAS-X and the I-PANAS-SF have a significantly low positive correlation. This can be assumed because the I-PANAS-SF is measured seven times at different days (application,7 times of measurement), while the PANAS-X is only measured once as a baseline measurement. Therefore, it is expected that the scores on the I-PANAS-SF do fluctuate to a high extent due to the daily activities of the respondents. As compared, the scores on the PANAS-X are expected to fluctuate less. Moreover, a retrospective measuring instrument is used to measure the PANAS-X, while the I PANAS-SF is measured by means of a non-retrospective measuring instrument. This also supports the expectation of a significantly low positive correlation between the aggregated scores on the PANAS-X and the I- PANAS-SF.
Secondly, the measurement of positive emotions in the experience sampling application is assessed. The mood map (application) is compared to the measurement of positive emotions via the I-PANAS-SF (application) which allows making predictions about the convergent validity. Therefore, it is examined if both measurement instruments assess the construct of positive emotions to the same extent. The following research question arises:
2. To what extent do the aggregated scores, measured by the Mood Map(application)
and the aggregated scores measured by the I-PANAS-SF(application), correlate
with each other?
9 answering format differ highly in both instruments which also might facilitate different scores and a low correlation.
Thirdly, the correlation of the construct of positive emotions and the construct of psychological well-being in the application (convergent validity) are assessed. For that, the aggregated scores on the I-PANAS-SF (application) and the scores on the MHC-SF (application) are taken into account. As a result, the following research questions arise:
3. To what extent do the scores on the construct of positive emotions (I-PANAS-SF)
correlate with the scores on the construct of psychological well-being (MHC-SF)?
H: It is expected that the scores on the construct of positive emotions highly correlate with the scores on the construct of psychological well-being. This is reasoned by the connection of both constructs, which is described in the theory.
Fourthly, a look is taken at the extent to which the scores on the experience of positive emotions fluctuate over the 28 points of measurement during the seven days when measured by means of the mood map (application). Therefore, the following research question arises:
4. To what extent does the experience sampling application assess fluctuations on the
scores concerning the experience of positive emotions when measuring it by means
of the mood map?
H: It is expected that the scores on the construct of positive emotions do highly fluctuate over the time points and the days. This can be assumed because the mood map assesses the participants’ current emotional state very frequently. Furthermore it can be expected that the participants’ emotional states highly depend on the time of day as well as on the weekday. This also promotes fluctuating scores.
10
2 Method
2.1 Design
In this correlational study a one-group survey design was applied to a homogenous group of students. Data was gathered once by the use of a baseline questionnaire, and 28 times via the Experience Sampling application (seven days, four times daily), thus over 29 points of measurement in total.
2.2 Participants
The participants that took part in this research were students from Dutch and German universities. The participants were collected by the researcher by means of convenience sampling and personal contact. According to Mroczek and Kolarz (1998) the extent to which one experiences positive emotions is related to a person’s age. By ensuring that all participants were homogenous concerning age, educational and intelligence level it was assumed, that all participants also had a relatively equal perception of emotions.
In total N=31 participants took part in this research, while 25 (81%) were female and 6 (19%) were male. The participants were at the age of 19 to 28, with an average age of 22, 4 (SD= 2, 0) years. At the moment of the study, 22 participants were doing their
Bachelor’s degree, while 9 participants were doing their Master’s degree.
2.2.1 Inclusion criteria
The participants had to be at least age 18 and at most age 30 old, to participate in the study. Secondly, they had to be proficient in reading English. It was chosen for English as the language of this study, reasoned by the internationality of the participants. Therefore, being skilled in English was important to prevent misunderstandings concerning posed questions. As another inclusion criterion, the participants needed access to a smartphone and a Laptop or Computer, which had to be connected to the internet. As the last criterion, the respondents had to carry their smartphone with them during the whole day to be able to answer the questionnaires on all points of measurement.
2.3 Procedure
11 asked to take part in the study via personal contact and e-mail. After agreeing to participate, the participants received an e-mail, which contained information about the study and its procedure (Appendix A), the link to the baseline questionnaire and a manual concerning the installation and use of the application (Appendix B). The enrolment mail was send three days in advance of the start of the data collection via the application. All participants started to fill in the ESM application at the same day (Monday, 11-04-2016) and at the same point of time (9:00).
In the first part of the study, the participants had to fill in a baseline questionnaire via the Qualtrics Software that contained the PANAS- X scale and the MHC– SF scale. Prior to answering the questions in the online questionnaire, the participants had to read and accept an informed consent formula, and to fill in some demographic data (Appendix C). The participants had two days to fill in the baseline questionnaires. Filling it in took about ten minutes.
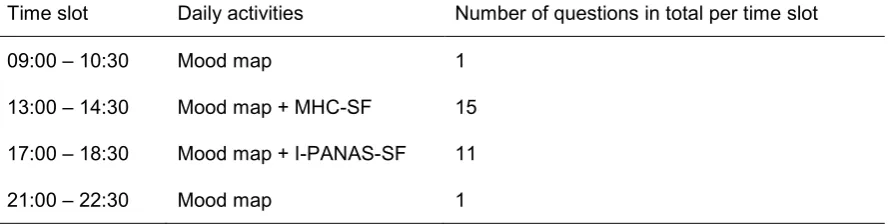
[image:13.595.87.532.568.680.2]In the second part of the data collection, the participants had to fill in questionnaires via the experience sampling application UT Survey for seven days, four times daily. As displayed in the activity overview in Table 2.1, the participants had to fill in the mood map four times a day, while they only had to fill in the I-PANAS-SF and the MHC-SF once a day. In the beginning of each time slot they were reminded to fill in the questions via a notification on their smartphone (Trompetter, Borgonjen, Zwart, & van Tongeren, 2015). In each time slot the questions were accessible for 90 minutes. Filling in the complete set of questionnaires took not more than two minutes per time slot.
Table 2.1 Brief outline of the activity overview
Baseline: PANAS-X and MHC-SF via Qualtrics
Time slot Daily activities Number of questions in total per time slot
09:00 – 10:30 Mood map 1
13:00 – 14:30 Mood map + MHC-SF 15
17:00 – 18:30 Mood map + I-PANAS-SF 11
12
2.4 Materials
To conduct the study, two distinct materials were used. Qualtrics was used to conduct the PANAS-X and the MHC-SF as a baseline. The UT Survey application was used to measure positive emotions via the mood map and the I-PANAS-SF, as well as
psychological well-being via the MHC-SF.
2.4.1 Baseline Questionnaire via Qualtrics
Qualtrics is an online costumer experience software, that was developed to conduct market research in different fields. Additionally, it enables its users to design and implement surveys in a structured and user-friendly manner. In the present study, Qualtrics was used to conduct the baseline measurement. To create this survey, an informed consent formula, the PANAS expanded form (PA and NA) and the MHC short form were inserted in Qualtrics.
2.4.2 Experience sampling application UT Survey
13 In the present study, UT Survey was used to gather data about the participants’ positive emotions and psychological well-being. To measure these constructs, an informed consent formula, a mood map, the positive affect subscale of the I-PANAS-SF and the MHC-SF were inserted in the application.
2.5 Measurement instruments
2.5.1 Construct Positive Emotions
PANAS-X The PANAS-X is the expanded form of the Positive and Negative Affect
Scale (PANAS), which aims to measure the experience of positive and negative affect. It is developed by Watson, Clark and Tellegen in 1988. The target group of this scale is adults. It consists of two subscales, which measure positive and negative affect. Each subscale contains 30 items. Therefore, the PANAS-X contains 60 items in total. The participants have to rate to what extent they felt for example surprised during the past weeks. The questions are rated on a six-point Likert Scale with options from very slightly or not at all (0) to extremely (5). In the present study, the Cronbach’s α was 0.91 for the positive affect scale, α= 0.95 for the negative affect scale and α=.87 in total, which indicates a very high reliability (Table 2.2).
I-PANAS-SF The I-PANAS-SF is the short form of the Positive and Negative
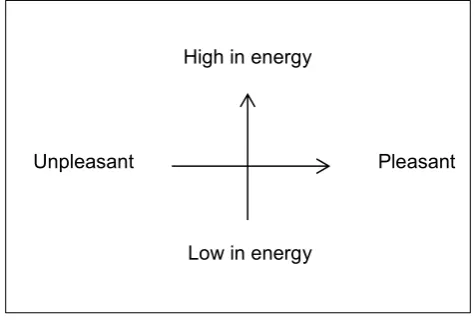
14 Mood Map The Mood-Map is based on the Circumplex Model of Core Affect (Yik,
Steiger, & Russell, 2011). It is a non-retrospective measurement instrument to get
information about a respondent’s state of mind and especially about a person’s perceived
[image:16.595.171.409.320.481.2]emotions, defined by two dimensions. The dimension on the y- axis is high in energy vs. low in energy. The dimension on the x-axis is pleasant vs. unpleasant, as can be seen in Figure 2.1. The participants have to rate how they feel at the present moment by marking the most appropriate position in the map. The scoring range that is used to assess the participants answer goes from -1 (totally negative) to +1 (totally positive). In the present study only the scores on the dimension of pleasant vs. unpleasant are rated to measure positive emotions. For this study, the positive valence is important. The Cronbach’s α for the mood map was 0.84 (Table 2.2).
Figure 2.1 Circumplex Model of Core Affect
2.5.2 Construct Psychological Well-being
MHC-SF The MHC-SF is the short form of the Mental Health Continuum long
form (MHC-LF), which aims to measure mental well-being by self-rating. It is developed by Keyes in 2002. The audience on which the scale should be applied is mentally healthy adults. The MHC-SF consists of three subscales that measure three dimensions of mental health. Those are emotional, social and psychological well-being. The scale contains 14 items in total. Reasoned by the focus of this study only the subscale of psychological well-being is assessed. This subscale contains 6 items. For example, the participants have to rate how often they had the feeling to be satisfied with life during the last month. In the present study, the participants had to rate how they felt during the past few hours. The measurement scale is composed of a six-point Likert Scale which contains options ranging from Never (0) to every day (5). The Cronbach’s alpha of the MHC-SF subscale
Pleasant Unpleasant
High in energy
15 psychological wellbeing in the baseline measurement was α= .76. The total Cronbach’s α of the psychological wellbeing subscale in the application was α= .86 (Table 2.2).
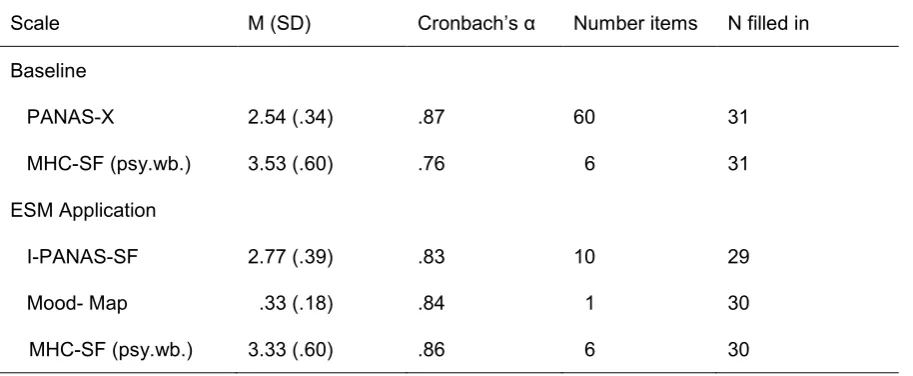
2.5.3 Reliability of the measurement instruments
As can be seen in Table 2.2, the reliability was high overall for all four scales and the concerned subscales. The Cronbach’s α values were above .70, which is comparable to other studies (Thompson, 2007; Lamers, Westerhof, Bohmeijer, ten Klooster, Keyes, 2010). Moreover Table 2.2 shows that all participants, who filled in the baseline questionnaires, and that the number of participants that filled in the application
[image:17.595.80.537.340.528.2]questionnaires is high as well.
Table 2.2 Mean Scores and reliability of the scales assessed in the baseline measurement and in
the application
Scale M (SD) Cronbach’s α Number items N filled in
Baseline
PANAS-X 2.54 (.34) .87 60 31
MHC-SF (psy.wb.) 3.53 (.60) .76 6 31
ESM Application
I-PANAS-SF 2.77 (.39) .83 10 29
Mood- Map .33 (.18) .84 1 30
MHC-SF (psy.wb.) 3.33 (.60) .86 6 30
2.6 Data analysis
17
3 Results
3.1 Concurrent validity
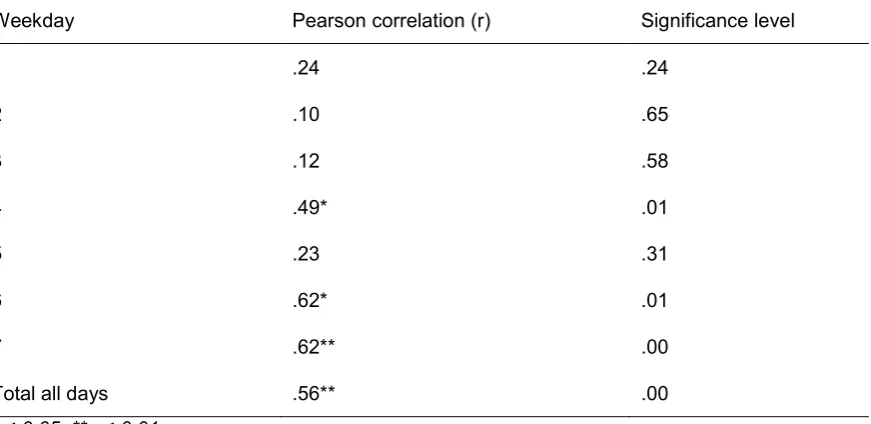
[image:19.595.95.531.325.537.2]As shown in Table 3.1, a moderate positive two-tailed significant correlation in total is found between the scores on the PANAS-X PA subscale and the scores on the I-PANAS-SF (r= .56) over all days. Additionally, a moderate significant positive correlation is found between both scales on day 4 (r= .49). Significantly high positive correlations are found on day 6 (r= .62) and day 7 (r= .62). In contrast, the scales have shown to correlate low on day 1 (r=.24), day 2 (r= .10), day 3 (r= .12) and day 5 (r=.23). Apart from day five, the Pearson Correlation increases with the number of days.
Table 3.1 Pearson correlation between the PANAS-X PA subscale and the I-PANAS-SF PA
subscale (concurrent validity)
Weekday Pearson correlation (r) Significance level
1 .24 .24
2 .10 .65
3 .12 .58
4 .49* .01
5 .23 .31
6 .62* .01
7 .62** .00
Total all days .56** .00
*p ≤ 0.05; **p ≤ 0.01
3.2 Convergent validity
18 with r=.15.
Table 3.2 Pearson correlation between the mood map and the I-PANAS-SF PA subscale
Weekday Pearson correlation (r) Significance level
1 .15 .48
2 .31 .17
3 .48* .02
4 .68** .00
5 .35 .13
6 .68** .01
7 .74** .00
Total all days .42* .03
*p ≤ 0.05; **p ≤0.01
The mean scores on both scales per day are also illustrated in Figure 3.1. Figure 3.1 shows that the mean scores on both scales stay relatively constant during the first three days. The scores on the mood map increase from 0,3 to 0,4 on day four as compared to the I-PANAS-SF where the scores are still relatively constant. It is remarkable that the mean scores on both scales decrease to the same extent on day five. While the scores on the I-PANAS-SF increase again on day six to the starting level, the scores on the mood map decrease further.
Figure 3.1 Daily mean scores of the mood map (x-axis) and the I-PANAS-SF (PA)
0,2 0,25 0,3 0,35 0,4 0,45 0,5 0,55 0,6
1 3 5 7 9 11 13 15 17 19 21 23 25 27
sco
re
s
points of measurement
Day 1-7
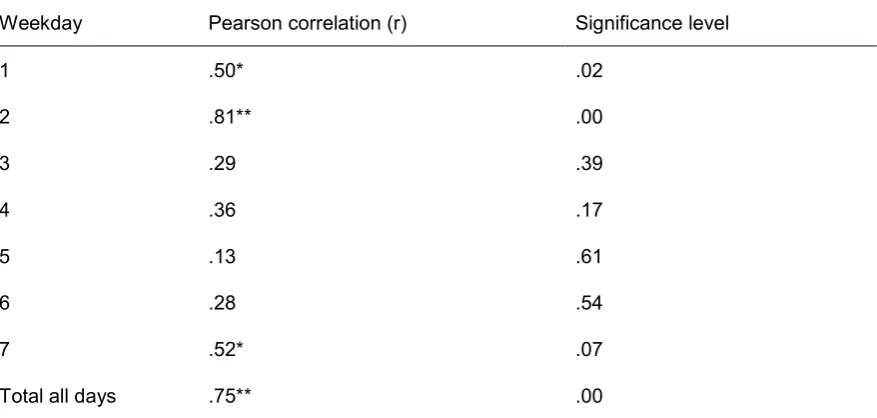
[image:20.595.83.525.545.727.2]19 As shown in Table 3.3, in total a high significant positive correlation (two-tailed) between the I-PANAS-SF and the MHC-SF is found over all days (r=.75). In more detail, the highest correlation is found on day two (r=.81), while a moderate significant positive correlation could be found on day one (r=.50), day four (r=.36) and day seven (r=.52). The correlations are notably lower in the middle of the week. An especially low positive correlation is found on day three (r=.29), day five (r=.13) and day six (r=.28). Furthermore, Table 3.3 shows that the highest correlations are found in the first days of the measurement and on the last day.
Table 3.3 Pearson correlation between the I-PANAS-SF PA subscale and the MHC-SF
psychological well-being subscale
Weekday Pearson correlation (r) Significance level
1 .50* .02
2 .81** .00
3 .29 .39
4 .36 .17
5 .13 .61
6 .28 .54
7 .52* .07
Total all days .75** .00
*p ≤ 0.05; **p ≤0.01
20
Figure 3.2 Daily mean scores of the mood map (x-axis), the I-PANAS-SF (PA) and the MHC-SF
subscale of psychological well-being
3.3 Fluctuations (mood map)
Figure 3.3 illustrates the fluctuations of the daily mean score and the scores per time slot measured by the mood map. The mood map clearly displayed occurring fluctuations in the
participants’ answers. The overall scores per day reach their maximum at day five (mean= .45), while they are the lowest at the second timeslot of day four (Appendix E). Furthermore it shows that the mean scores of all participants are higher in the end of the week than in the beginning of the week. Next to this result, the occurring fluctuations on each day can be described in more detail. Overall it is remarkable that the participants scored the lowest at the first time slot every day, and the highest at the last time slot every day. Moreover, the Figure shows that the scores on day three and six are at its lowest point at the second time slot of the day. Additionally, day two shows a contrasting pattern. On that day, the participants scored highest at the first time slot, and lowest at the last one. Further it has to be mentioned that the scores on the sixth day do not fluctuate as high as on the other days; overall low scores are displayed at all time slots. Finally, it is apparent that the fluctuations per time slot are equal on day one and day seven.
0,2 0,3 0,4 0,5 0,6 0,7 0,8
1 3 5 7 9 11 13 15 17 19 21 23 25 27
sco
re
s
points of measurement
Day 1-7
Mood map daily average I-PANAS-SF
21
Figure 3.3 Mean scores per day and scores of every time slot of the mood map
0,1 0,2 0,3 0,4 0,5 0,6
1 3 5 7 9 11 13 15 17 19 21 23 25 27
sco
re
s
points of measurement
Day 1-7
22
4 Discussion
The aim of this psychometric study was to consider if the experience sampling application UT Survey is an appropriate, reliable and valid method to assess the experience of positive emotions in the daily life by means of the I-PANAS-SF, as compared to a baseline measurement (concurrent validity). Moreover, this study aimed to find out to what extent the experience sampling application is appropriate to detect fluctuations in the experience of positive emotions.
4.1 Concurrent and convergent validity of the I-PANAS-SF
The results of this study have shown that the I-PANAS-SF is a valid and reliable scale to measure the construct of positive emotions in daily life, especially when assessed by means of the experience sampling method. As expected, a significant positive correlation was found between the scores on the PANAS-X PA subscale (baseline), and the scores on the I-PANAS-SF (application). Nevertheless, the overall correlation is moderate instead of the expected low. The moderate correlation indicates that the I-PANAS-SF has a good psychometric quality, even if it is assessed non-retrospective and more frequent than designated. Thus, the I-PANAS-SF has shown to have a good concurrent validity in regard to the PANAS-X.
As it was expected, a significant positive correlation was found between the I-PANAS-SF and the mood map in the application. Again, the analyses showed that the moderate Pearson correlation is higher than expected in advance. This indicates a good convergent validity of the I-PANAS-SF. Thus, next to the I-PANAS-SF, the mood map has proven to be an appropriate measuring instrument to measure the construct of positive emotions by means of experience sampling. Although both instruments are disparate in construction, they have shown to correlate moderately, when measuring the construct of positive emotions. Furthermore, the different frequency of answering both scales (seven times vs. 28 times) has shown to have just little impact on the correlation.
23 Next to the finding that the I-PANAS-SF correlated with the other assessed scales to a higher extent than expected, the analyses displayed several patterns concerning the correlation during the week. Firstly, correlations between the I-PANAS-SF and the other scales (PANAS-X, mood map, MHC-SF) have shown to be weakest in the beginning of the week. This could be due to possible uncertainties of the participants of how to use the app (technical and practical knowledge) on the first day of the study. The increasing correlation with the number of days could be explained by the familiarization with the application and the questionnaires. Especially at the weekend days (day six and day seven) the correlations are shown to be throughout on their highest. This may be due to the fact that the participants filled in the baseline questionnaire at the weekend days (Saturday, Sunday) the week before as well. Thus, it can be assumed that the participants’ experienced positive emotions to an equal extent during both weekends. Moreover, the different height of the correlations at the weekend and within the week can be explained by the Dynamic Model of Affect (Potter, Zautra & Reich, 2000). This model states, that the (probably stressful)
context of an individual influences to what extent two constructs, such as positive emotions and psychological well-being, correlate with each other. Therefore, the diverging correlations between the scales over the days could be explained by the participants being more likely to be in another context during the weekend than within the week
(Zautra, Berkhof, & Nicolson, 2002).
4.2 Fluctuations of positive emotions in daily life
As expected, the mean scores of the construct of positive emotions (mood map) highly fluctuate over the week and over the time slots during each day. The fluctuations are displayed by the experience sampling application to a great extent, due to the nature of the ESM to assess variations in the emotional state of participants. Participants self-report feelings and psychological states in real time, in their natural environment, and on different and frequent time points (4 time slots per day; thus 28 time slots per week) (Ebner-Priemer & Trull, 2009). This ensures the assessment of a greater variability of experience and current within-personal processes.
24 current activity (working vs. non-working) have an effect on mood and well-being. People experience greater satisfaction, related to positive emotions and enhanced well-being during weekends and non-working times. Furthermore, Fritz, Sonnentag, Spector and McInroe (2010) reported that a recovery process takes place during the weekend due to relaxing activities, and the possibility to spend more social time with family and friends. According to Stone, Schneider, and Harter (2012), the patterning of differences in the experience of positive and negative mood during the week is called the day-of-the-week effect. Additionally, the results have shown that the overall experience of positive emotions increases exponentially on day four (Thursday). This might be explained by the habits of Dutch students to go out on Thursday nights.
Besides displaying fluctuations over the week, the mood map also displayed fluctuations of positive emotions within days. It is found that the participants overall experienced the least pleasure at the first time slot every day (9:00), and the most pleasure at the last time slot (21:00). This is supported by Clark, Watson, and Leeka (1989) who found that positive affect increases from morning to noon due to the diurnal and circadian rhythm, with mood being worst in the morning and getting better in the evening. Especially in regard to the daily rhythm of students (participants in this study), it can be assumed that they just woke up at 9:00, or that they were not awake that long at the first time slot. Thus, they may not experience high pleasure when filling in the application that ‘early’ in the morning, while it can be assumed that the participants were most likely to meet friends or do other social or relaxing activities which promote pleasure in the evening.. Overall, Bolger, DeLongis, Kessler, and Schilling (1989) explain occurring fluctuations within a day and over the week by the effect of daily stressors as interpersonal conflicts, on mood.
The assumption that a stressful context has an impact on an individual’s affective state (e.g. experience of positive emotions) is supported by the Dynamic Model of Affect again (Potter, Zautra & Reich, 2000).
4.3 Server breakdown day five
25 only filled in the mood map incomplete for day five. Fortunately a trend in the fluctuations of the reported experience of positive emotions within a day and over the week could be revealed anyway.
4.4 Limitations
Prior to discussing recommendations for future research, several limitations concerning the technical functioning and the implementation of this study have to be discussed. First of all, a study which based the data collection on technical devices has to take possible technical limitations into account, especially if an application is still as new as the UT Survey application. The main problem was the server breakdown on day five. Beside the technical limitations, there have been some limitations in the implementation of the study and the analysis of the data as well. The instruction mail and the manual seemed to be a bit long for the respondents. As a consequence, some respondents did not read all information and thus did not know that they had to fill in the baseline questionnaire in advance. Additionally, the mood map was the only scale, which was assessed four times a day. Thus, only scores on the mood map could be used to display fluctuations in the
participants’ experience of positive emotions within the day. Furthermore, by only taking the mean scores into account in the analysis, the variance of the scores was minimized.
4.5 Recommendations for future research
In future research, limitations of the current study should be adjusted. Improvements should be made concerning the retrospectivity of the questions. While the mood map
26 psychological well-being as frequent as the mood map (4 times a day). This would give some indication if the construct of psychological well-being is more stable over time than the construct of positive emotions. Thirdly, the participants should be asked for their current activity at the particular time slots in future research to get some indication about the motive to report a higher or lower extent of positive emotions. As a last point, future research could aim to compare the self-rated experience of positive emotions via the UT Survey application in students as compared to same age employed people, to investigate if employed people experience more or less positive emotions over a day due to possibly more workload, and if the emotions fluctuate to an equal extent within a day. Furthermore, the experience of positive emotions in daily life in students could be compared to the experience of other age groups, as elderly. A difference in the experience of positive emotions could be expected due to age related emotion-regulation strategies (Blanchard-Fields, Stein, & Watson, 2004) and different daily routine.
4.6 Conclusion
By displaying moderate to high positive correlations between the I-PANAS-SF and the other scales (PANAS-X, mood map, MHC-SF), this psychometric study confirmed that the I-PANAS-SF is a reliable and valid (good concurrent and convergent validity) scale to measure the construct of positive emotions in daily life and especially in the context of the experience sampling method application UT Survey. Furthermore, the results of this study indicate that the experience sampling application UT Survey is very convenient measuring constructs by means of different scales, even if the scales are measured more often than designated and if they possibly have to be adjusted to the application. Moreover, the experience sampling application has proven to be an appropriate method to detect
27
References
Abe, J. (2011). Positive emotions, emotional intelligence, and successful experiential learning. Personality and Individual Differences, 51(7), pp. 817-822.
Biglan, A., & Hayes, S. (1996). Should the behavioral sciences become more pragmatic? The case for functional contextualism in research on human behavior. Applied & Preventive Psychology, pp. 47-57.
Blanchard-Fields, F., Stein, R., & Watson, T. (2004). Age Differences in Emotion-Regulation Strategies in Handling Everyday Problems. The Journals of
Gerontology, pp. 261-269.
Bohlmeijer, E., Ten Klooster, P., De Kleine, E., Westerhof, G., & Lamers, S. (2016, April). Een empirische vergelijking van drie meetinstrumenten: Geestelijke
gezondheid als positieve uitkomst van behandeling. De Psycholoog, pp. 47-54.
Bolger, N., DeLongis, A., Kessler, R., & Schilling, E. (1989, November). Effects of daily stress on negative mood. Journal of Personality and Socia Psychology, pp. 808-818.
Clark, L., Watson, D., & Leeka, J. (1989). Diurnal Variation in the Positive Affects.
Motivation and Emotion, pp. 205-234.
Cohn, M. A., Fredrickson, B. L., Brown, S., Mikels, J., & Conway, A. (2009). Happiness unpacked: positive emotions increase life satisfaction by building resilience.
Emotion, p. 361.
Crawford, J., & Henry, J. (2004, september). The Positive and Negative Affect Schedule (PANAS): Construct validity, measurement properties and normative data in a large non-clinical sample. British Journal of Clinical Psychology, pp. 245-265.
28 Diener, E. (2000). Subjective well-being:The science of happiness and a proposal for a
national index. American Psychologist, pp. 34-43.
Ebner-Priemer, U., & Trull, T. (2009). Ambulatory Assessment. Eur Psychol., 14(2), pp. 109-119.
Egloff, B., Tausch, A., Kohlmann, C., & Krohne, H. (1995). Relationships between time of day, day of the week, and positive mood: Exploring the role of the mood measure. Motivation and Emotion, pp. 99-108.
Fledderus, M. (2012). Acceptance and Commitment Therapy for Public Mental Health
Promotion. Universiteit Twente .
Fredrickson. (2001). The role of positive emotions in positive psychology: The broaden-and-built theory of positive emotions. Am Psychol., 56(3), pp. 218-226.
Fredrickson, B. (1998). What good are positive emotions? Review of general
psychology, 2(3), p. 300.
Fredrickson, B., & Branigan, C. (2005). Positive emotions broaden the scope of
attention and thought-action repertoires. Cognition and Emotion, pp. 313-332.
Fritz, C., Sonnentag, S., Spector, P., & McInroe, J. (2010). The weekend matters: Relationships between stress recovery and affective experiences. Journal of
Organizational Behavior, pp. 1137-1162.
Hartig, J., Frey, A., & Jude, N. (2008). Testtheorie und Fragebogenkonstruktion. Frankfurt am Main: Springer Verlag.
Houben, M. (2015). The relation between short-term emotion dynamics and
psychological well-being: A meta-analysis. Psychological Bulletin, pp. 901-930.
29 Keyes, C. (2002, June). The Mental Health Continuum: From Languishing to
Flourishing in Life. Journal of Health and Social Behavior, pp. 207-222.
Kuesten, C., & Amway, A. (2014). A global study using PANAS (PA and NA) scales to measure consumer emotions associated with aromas of phytonutrient supplements. Food Quality and Preference, pp. 86-97.
Lambert, M., & Erekson, D. (2008). Positive psychology and the humanistic tradition.
Journal of Psychotherapy Integration, pp. 222-232.
Lamers, S., Westerhof, G., Bohlmeijer, E., ten Klooster, P., & Keyes, C. (2010).
Evaluating the psychometric properties of the mental health Continuum- Short Form (MHC-SF). Journal of Clinical Psychology, pp. 99-110.
Lamers, S., Westerhof, G., Bohlmeijer, E., ten Klooster, P., & Keyes, C. (2011, January ). Evaluating the psychometric properties of the mental health Continuum-Short Form (MHC-SF). Journal of Clinical Psychology, pp. 99-110.
Lamers, S., Westerhof, G., Bohlmeijer, E., ten Klooster, P., & Keyes, C. (2011).
Evaluating the psychometric properties of the Mental Health Continuum-Short Form (MHC-SF). Journal of Clinical Psychology, pp. 99-110.
Law, K., Wong, C., & Song, L. (2004). The Construct and Criterion Validity of Emotional Intelligence and It's Potential Utility for Management Studies. Journal of
Applied Psychology, pp. 483-496.
Lyubomirsky, S., King, L., & Diener, E. (2005, Nov). The Benefits of Frequent Positive Affect: Does Happiness Lead to Success? Psychological Bulletin, pp. 803-855.
Morisky, D., Green, L., & Levine, D. (1986). Concurrent and Predictive Validity of a Self-reported Measure of Medication Adherence. Medical Care.
Mroczek, D., & Kolarz, C. (1998). The effect of age on positive and negatve affect: A developemntal perspective on happiness. Journal of Personality and Social
30 Napa Scollon, C., Kim-Prieto, C., & Diener, E. (2009). Experience Sampling: Promises
and Pitfally, Strengths and Weaknesses. In E. Diener, Assessing Well-Being, The
Collected Works of Ed Diener (pp. 157-180). Springer.
Potter, P., Zautra, A., & Reich, J. (2000, September). Stressful events and information processing dispositions moderate the relationship between positive and negative affect: Implications for pain patients. Annals of Behavioral Medicine , pp. 191-198.
Rana, S. (2016). Profile of adolescent's psoitive emotions: An indicator of their psychological well-being. Psychological Studies .
Ryan, R., Bernstein, J., & Warren Brown, K. (201095-122). Weekends, Work, and Well-Being: Psychological Need Satisfactions and Day of the Week Effects on Mood, Vitality, and Physical Symptoms. Journal of Social and Clinical Psychology.
Seligman, M., & Csikszentmihalyi, M. (2014). Positive Psychology: An introduction.
Springer Netherlands, pp. 279-298.
Sheldon, K., & King, L. (2001). Why positive psychology is necessary. (A. P. Association, Ed.) American Psychologist, pp. 216-217.
Stone, A., Schneider, S., & Harter, J. (2012). Day-of-week mood patterns in the United
States: On the existence of Blue Monday , Thank God it's Friday and weekend
effects. The Journal of Positive Psychology: Dedicated to furthering research and
promoting good practice, pp. 306-314.
Tellegen, A., & Watson, D. (1985). Structures of mood and personality and their relevance to assessing anxiety, with an emphasis on self-report. Anxiety and
anxiety disorders, pp. 681-706.
Thompson, E. (2007, March). Development and Validation of an Internationally Reliable Short-Form of the Positive and Negative Affect Schedule (PANAS).
31 Thompson, R. (2007). Development ad validation of an internationally reliable
short-form of the positive and negative affect schedule (PANAS). Journal of
cross-cultural psychology, pp. 227-242.
Trompetter, H., Borgonjen, F., Zwart, M., & van Tongeren, S. (2015). UTSurvey Manual v1. Available from http://www.utwente.nl/igs/datalab.
Watson, D., Clark, L., & Tellegen, A. (1988). Development and validation of brief measures of positive and negative affect: The PANAS scales. Journal of
Personality and Social Psychology, pp. 1063-1070.
Westmeyer, H. (2007). Introduction to the Special Issue on Advances in the
Methodology of Ambulatory Assessment. European Journal of Psychological
Assessment, pp. 203-205.
Williams, M. (2015). Affect, Emotion, and Emotion Regulation in the Workplace: Feelings and Attitudinal Structuring. Negotiation Journal, pp. 425-428.
Yarroch, W. (1991). The Implications of Content versus Item Validity on Science Tests.
Journal of research in science teaching, pp. 619-629.
Yik, M., Steiger, J., & Russell, J. (2011). A 12-Point Circumplex Structure of Core Affect.
Emotion, pp. 705-731.
32
Appendix
Appendix A.
E-mail for the respondents
Dear …,
Thank you for your participation in this study. Before you start with filling in questionnaires, you are asked to read the following information carefully.
This study is part of a bachelor thesis at the University of Twente. The aim of this study is to have a look at students’ experience of positive emotions. Furthermore, the experience of positive emotions will be researched in combination with social, emotional and
psychological well-being of students.
This study consists of two parts.
1. Firstly, you have to fill in an online questionnaire. Completing it will take about 10 minutes. The online questionnaire consists of one general part about your demographical details and three scales related to mental health, positive emotions and perceived feelings of anxiety. We ask you to fill in this questionnaire until 10-04-2016 (Sunday).
To get to the questionnaire, click the link below:
https://qtrial2016q2az1.az1.qualtrics.com/jfe/form/SV_e4Fa3KFC5M3pxSR
2. Secondly, you have to fill in questions via the application called UT Survey. The
application asks you to fill in questions from 11-04-2016 until 17-04-2016. Furthermore, it asks you to fill in questions four times a day. Each time you receive push messages on your smartphone. Completing the questionnaires on the application will take about 5 minutes a day.
33 Further explanation on how to download and use the application is given in the instruction manual in the attachment of this e-mail.
There are no ‘right’ or ‘wrong’ answers for as well filling in the online questionnaire, as filling in the questions via the application. Just answer the questions honestly according to your personal experience and feeling. Select the answer that apples to you the best in this moment.
At any point of this study, your anonymity is ensured. We will keep information about you confidential, and protect it from unauthorized disclosure, tampering, or damage. All information we can obtain from your answers will be used only for this research. Your participation is voluntary and you have the right not to participate at all or to leave the study at any time.
Thank you for reading this e-mail.
For further information or questions, you can contact
34
Appendix B.
Manual for the UTSurvey application
Instructions for using the UTsurvey Application
Dear participant,
Thank you for taking part in our study about positive emotions. As you already know, you will need an application to fill in most of the surveys. To make sure that you won't have any problems by using the application during the study we send you this instruction manual. As you will see below, there are screenshots with translations in the instruction, because the application is only available in Dutch. If you have any questions, do not hesitate to contact us ([email protected] or [email protected]).
We would like to ask you to download the application and to sign in before 11.04.2016. Otherwise is it not possible to fill in all the surveys.
From 11.04.2016 until 17.04.2016 you will receive 4 questionnaires every day. The questions are accessible at 09:00, 12:00, 17:00 and 21:00. You will have 90 minutes to fill in each.
35
Appendix C.
Informed consent and demographic data
Dear participant,
Thank you for your participation in this study. Before you start filling in the questionnaire, you are asked to read the following information carefully.
The aim of this study is to look at positive emotions and mental health. Completing the questionnaire will take about 10 minutes. There are no "right" or "wrong" answers, just answer the questions honestly according to your personal experience and feeling. Select the answer that applies to you the best in this moment.
The questionnaire consists of one general part about your demographical details and three scales related to your emotional state during the last few days.
At any point of this study, your anonymity is ensured. We will keep information about you confidential, and protect it from unauthorized disclosure, tampering, or damage. All
information we can obtain from your answers will be used only for this research. Your participation in voluntary and you have the right not to participate at all or to leave the study at any time.
36
Appendix D.
Scores and reliability of the PANAS-X and the MHC-SF in the baseline measurement per day
Scale M (SD) Cronbach’s α Number
items
N filled in
PANAS-X
PA
NA
2.54 (.37)
3.09 (.60)
2.08 (.67)
.87
.91
.95
60
27
33
31
31
31
MHC-SF
psy. wb.
3.27 (.53)
3.53 (.60)
.87
.76
14
6
31
37
Appendix E.
Scores of the I-PANAS-SF; the MHC-SF and the mood map in the experience sampling application per day
Scale M (SD) Cronbach’sα Number
items N filled in I-PANAS-SF (PA) day 1 day 2 day 3 day 4 day 5 day 6 day 7 2.77 (.40) 2.85 (.60) 2.83 (.77) 2.83 (.70) 2.83 (.80) 2.76 (.61) 2.39 (.64) 2.75 (.65) .82 .74 .85 .85 .84 .81 .84 .82 10 10 10 10 10 10 10 10 29 25 21 23 23 20 15 20 Mood-Map day 1 day 2 day 3 day 4 day 5 day 6 day7 .33 (.18) .33 (.21) .28 (.32) .30 (.25) .29 (.29) .45 (.23) .34 (.28) .34 (.29) .84 .83 .83 .83 .79 .08 .82 .84 1 1 1 1 1 1 1 1 30 28 28 27 28 28 25 25
MHC-SF (psy. wb.)