Panelists' performances and strategies in paper based and
computer based projective mapping
SAVIDAN, Capucine and MORRIS, Cecile <http://orcid.org/0000-0001-6821-1232>
Available from Sheffield Hallam University Research Archive (SHURA) at: http://shura.shu.ac.uk/9502/
This document is the author deposited version. You are advised to consult the publisher's version if you wish to cite from it.
Published version
SAVIDAN, Capucine and MORRIS, Cecile (2015). Panelists' performances and strategies in paper based and computer based projective mapping. Journal of Sensory Studies, 30 (2), 145-155.
Copyright and re-use policy
See http://shura.shu.ac.uk/information.html
Title: Panelists' performances and strategies in paper based and computer based projective
1
mapping
2
3
Running title: computer and paper based projective mapping
4
5
Capucine H. Savidan; Cecile Morris*
6
7
Sheffield Hallam University
8
Food Group
9
Howard Street, Sheffield
10
S1 1WB, UK
11
Tel: +44 (0) 114 2252759
12
Fax: +44 (0) 114 2254449
13
14
Abstract:
16
Projective Mapping has recently attracted a lot of attention and the main sensory data
17
acquisition software packages have developed interfaces to collect projective mapping data.
18
However, the comparison between paper and computer based projective mapping has never
19
been reported. The objectives of this research were to 1) compare the consensus maps and
20
panelists' performances for paper and computer based projective mapping and 2) analyze the
21
panelists' strategies while performing either tasks. In the first part of the study, 32 panelists
22
were asked to perform both paper and computer based projective mapping on 8 beer samples.
23
In a second part of the study, 10 panelists were asked to repeat the tasks whilst “thinking
24
aloud” their strategy. There was no significant difference in panelists' performance as
25
assessed by the People Performance Index (PPI) between the paper and computer tasks. The
26
consensus maps obtained were similar with respect to sample groupings, RV coefficients and
27
variation explained by the first 2 dimensions. Individual panelists adopted similar strategies
28
on paper and computer but strategies differed greatly between panelists.
29
Practical applications:
30
The results reported here will help panel leaders making informed decisions with respect to
31
support choice when designing projective mapping tests. Additionally, an insight into the
32
diversity of panelists' mapping strategies is provided which may inform further research and
33
discussion into the most appropriate instructions given to panelists and/or type of panel used.
34
Key words: Projective Mapping, Napping, sensory, People Performance Index, Think Aloud,
35
MFA.
36
1. Introduction:
38
Projective Mapping is a relatively recent descriptive technique (Risvik et al. 1994; Risvik et
39
al. 1997) which has attracted a lot of attention due to its relative ease of use and cost
40
effectiveness compared to the more traditional descriptive methods such as Quantitative
41
Descriptive Analysis (QDA). As a result, a number of contributions have focused on
42
evaluating the performance of projective mapping and its limitations against other rapid
43
descriptive methods (Ares et al. 2010; Nestrud and Lawless 2010) or traditional descriptive
44
analysis (Kennedy and Heymann 2009; Mielby et al. 2014; Moussaoui and Varela 2010). The
45
consensus is that projective mapping is well suited to gathering quick, preliminary descriptive
46
information on samples which present a reasonable degree of dissimilarity and that it
47
compares well with other rapid methods (Mielby et al. 2014; Varela and Ares 2012).
48
Identified strengths of projective mapping are its holistic nature and versatility with respect to
49
the type of panel (consumer vs. trained). Since judges are not given any instructions relating
50
to the discrimination criteria to use in order to build their maps, projective mapping has often
51
been described as a holistic method (Dehlholm et al. 2012; Varela and Ares 2012). This
52
differs in nature to other descriptive methods, notably QDA, in which panelists analytically
53
assess attributes separately (Lawless and Heymann 2010). This difference between the
54
techniques may be reflected in the type of panel used to carry out projective mapping and a
55
number of studies have focused on whether consumers could be used to generate equivalent
56
data as trained panelists. Some have concluded this was the case (Albert et al. 2011), and
57
others have found that trained panelists performed better (Barcenas et al. 2004). Despite the
58
assumption that judges approach the task holistically, there is, to date, no real insight into the
59
strategies which panelists adopt to perform projective mapping.
60
As limitations go, it is accepted that projective mapping does not provide the same richness
61
of descriptive information as QDA and notably, there are not any average scores which can
be compared across samples for any attribute (Valentin et al. 2012), prompting some to
63
question their "actionability" (Moskowitz 2002) .
64
Despite these well documented limitations, projective mapping has been applied and
65
validated with an ever growing range of food products such as fresh strawberries (Vicente et
66
al. 2014); mortadellas (Santos et al. 2013); potato purees (Jimenez et al. 2013) and high
67
alcohol beverages (Louw et al. 2014) to cite only the most recent examples. In this context
68
of fast growth, it is not surprising that all the major sensory data acquisition software
69
packages have now developed interfaces to collect projective mapping data directly on
70
screen, by-passing thus the elaboration of a map using physical products placed on a large flat
71
surface. However, to date, no study has reported whether the results obtained from the
72
traditional paper based projective mapping agreed with those obtained via computer screens.
73
Comparison between pen-and-paper and online data acquisition methods are well
74
documented in other fields such as social sciences (Campos et al. 2011; Díaz de Rada and
75
Domínguez-Álvarez 2014; Gravlee et al. 2013). Overall, there appears to be a good
76
agreement between the 2 methods, with subtle differences observed in terms of item response
77
rates and expense of qualitative data generated from open ended questions (Díaz de Rada and
78
Domínguez-Álvarez 2014). However, there are major differences between surveys and
79
sensory analysis, namely the controlled conditions in which the data is acquired (sensory
80
booths) and the fact that panelists are required to taste food products as part of the task and
81
few sensory studies have looked into the comparability of paper and computer acquisition
82
methods. A descriptive sensory study concluded that substituting paper ballots for computer
83
ballots did not significantly alter experimental results (Swaney-Stueve and Heymann 2002).
84
However, the transferability of these findings to projective mapping is yet to be
85
demonstrated.
The objectives of this research were twofold: to compare the consensus maps for paper and
87
computer based projective mapping as well as to analyze the panelists' strategies while
88
performing either task.
89
90
2. Materials and Methods:
91
The aim of the first study was to compare the maps obtained on paper and on computer.
92
Thirty-two consumers were asked to perform both paper and computer based projective
93
mapping on 8 samples of beer (6 different samples and 2 duplicates). The aim of the second
94
study was not to compare the projective mapping results for both tasks (first study) but to
95
investigate the strategies adopted by the panelists. Ten panelists were asked to perform the
96
same tasks once more while describing their strategies. In a food context, asking panelists to
97
“think aloud” as they perform a task to understand their working has been insightfully used
98
elsewhere to investigate emotion reporting (Jaeger et al. 2013) but also to obtain an insight
99
into participants’ cognitive strategies when presented with different recall aids to estimate
100
portion sizes (Chambers et al. 2000). The study set-up was deliberately selected to explore
101
the relative performance of paper and computer based projective mapping in the most
102
challenging and relevant to routine data acquisition conditions: consumers, rather than a
103
trained panel, were used and a complex product (beer) was selected as this has been shown to
104
impact on results (Louw et al. 2014).
105
106
2.1.Panellists:
107
Thirty-two regular (at least once every 2 months) beer drinkers (20 males) aged 20 to 60 were
108
recruited via flyers and word of mouth to took part in the first part of the study. They were
109
composed of 19 academic staff, 9 technical/manual workers and 4 students. The number of
untrained panelists / consumers used in studies comparing projective mapping to other
111
techniques ranges between 8 and 30 panelists and is typically between 12 to 24 panelists (for
112
a detailed review of number of panelists in projective mapping studies, see Table 1 of Hopfer
113
and Heymann 2013). Ten of those panelists (6 males) aged 20 to 50 agreed to come back for
114
the second part of the study for an in-depth investigation of their strategies.
115
2.2.Samples:
116
An initial screening of the samples ensured a reasonable homogeneity of the samples. Three
117
alcohol levels were selected: alcohol free (Beck’s blue containing no more than 0.05% ABV
118
by Beck's and Erdinger Alkoholfrei by Erdinger Weibräu), light beers (Beck’s premium
119
light 2.3% ABV by Beck's and Bière Blonde 2.6% ABV by Brasserie) and regular beers
120
(Beck’s 4.8% ABV by Beck's and Foster Gold 4.8% ABV by Foster). Two blind duplicates
121
were included to assess judge’s ability to perform the task and discriminate between samples.
122
In order to minimize the amount of alcohol ingested by the panelists, the two alcohol free
123
beers were selected as the duplicate samples. Forty ml of fridge cold (4°) samples were
124
presented in small transparent plastic gallipots simultaneously to the panelist. The order in
125
which the samples were arranged on the trays differed between panelists and was based on
126
William’s Latin square design.
127
2.3.Studies:
128
2.3.1. First study:
129
The panelists were randomly allocated to either perform the paper or computer projective
130
mapping task during their first session and came back to perform the other task at a later time,
131
typically one week later. In line with the procedure described in Dehlholm et al. (2012), the
132
panelists, who had never performed a projective mapping task before, attended a 10 minutes
instruction session prior to both tasks. For the paper task, panelists were shown an example of
134
a paper map acquired with tomato soup samples. For the computer task, panelists were
135
required to build their maps on the computer screen within the space provided to that effect.
136
They were shown, on a large projection screen, how to move the samples within that space
137
and how to record attributes for each sample on electronic sample tags. Panelists attended
138
both sets of instruction sessions regardless of which task they performed first. The
139
instructions provided in the booths were the same for both tasks: “Please evaluate the
140
samples in front of you from left to right and place them on the provided space according to
141
how similar or dissimilar they are for you. The more similar the samples are, the closer they
142
should be positioned to each other, the more dissimilar they are the further apart they should
143
be positioned" (Hopfer and Heymann 2013).
144
After completing both tasks, panelists were asked which task they had felt most comfortable
145
with and why.
146
2.3.2. Second study:
147
Ten panelists aged 20 to 50 (6 males, 6 academic staff, 3 technical staff and 1 student) agreed
148
to come back and take part in the second study which involved performing both the paper and
149
computer projective mapping whilst thinking aloud their strategies. The panelists, who
150
already had experience of both supports, were randomly allocated to start either with the
151
paper or computer task and were reminded of the general instructions for each task.
152
Additionally, they were asked to think aloud their strategies as they carried out the tasks and
153
were recorded using a SONY IC Recorder (ICD-PX312/PX312F).
154
2.4.Support:
For the paper task, panelists were provided with sheets of paper measuring 60 cm x 40 cm.
156
For the computer task, panelists were not provided with any paper and performed their maps
157
directly on the computer screen available on the booth. The computer screens were 24.6 cm x
158
18.5 cm and the actual map space dimensions were 16.0 cm x 10.6 cm. While the supports
159
dimensions varied greatly, it was important to compare the methods as they would be applied
160
by panel leaders who would not dispose in their booths of computer screens of equivalent
161
dimensions as the paper maps most commonly used in projective mapping (60 cm x 40 cm).
162
For the paper maps, each sample coordinate was measured from the bottom left corner of the
163
map and reported in Excel (Microsoft, Seattle, US) along with the attributes generated by the
164
panelists. For the computer maps, the data was acquired using Compusense (Guelph, Canada)
165
and the coordinates of the computer based maps were exported from Compusense into Excel
166
along with the attributes generated by the panelists for each sample.
167
2.5. Data analysis:
168
2.5.1. People Performance Index:
169
The People Performance Index (PPI) which is the ratio between the distance separating 2
170
duplicates over the greatest distance separating any 2 samples on the map was calculated as
171
reported in Hopfer and Heymann (2013). A factorial repeated measures ANOVA (repeated
172
measure: panelist; factors: duplicate pair and support) was performed using SPSS v21 (IBM
173
Corporation, Armonk, NY) to test for significant differences in PPIs.
174
Additionally, based on individual map examination, criteria to assess panelists' performance
175
based on their PPIs were introduced as such: PPI ≤ 0.20 excellent; 0.20 < PPI ≤ 0.30 good;
176
0.30 < PPI ≤ 0.40 fair; 0.40 < PPI ≤ 0.50 poor; 0.50 < PPI inadequate.
177
2.5.2. Product coordinates and attributes count:
Multiple Factor Analysis (MFA) was introduced to deal with data tables of different natures
179
by, in essence, performing a PCA on each subset of data and superimposing them (Pagès and
180
Husson 2001). In this respect, it has proved highly suitable to analyze projective mapping
181
data where product coordinates and attribute counts can be analyzed simultaneously. The
182
paper and computer based projective mapping data were analyzed by MFA (MFA, Husson et
183
al. 2014) in R (R core team 2013) using FactoMineR (Lê et al. 2008). A Hierarchical Cluster
184
Analysis (HPCP, Husson et al. 2014)was performed on the first 5 dimensions of the MFA
185
results. Each individual map was considered as a group and RV coefficients were computed
186
(MFA using FactoMineR) to evaluate the degree of agreement between individual maps as
187
well as individual maps and overall configuration (Robert and Escoufier 1976). Synonyms of
188
attributes used to describe the samples were pooled together (example: "pale" and "light
189
colour") and attributes cited only once were discarded as reported elsewhere (Ares et al.
190
2010; Albert et al. 2011). For each modality (paper and computer), the attribute frequency
191
counts across all assessors were collated as a separate group in the same data structure as that
192
described by Nestrud and Lawless (2008); Moussaoui and Varela (2010) and Pagès (2005).
193
Hierarchical Multiple Factor Analysis (HMFA) was introduced to take into account the
194
hierarchical nature of some data sets (Le Dien and Pagès 2003) and has successfully been
195
applied to the comparison of sensory methods (Perrin et al. 2008; Ares et al. 2010) or
196
replicates (Kennedy 2010). It was therefore used to represent the combined product map from
197
the paper and computer projective mapping (1st level) which were themselves composed of 2
198
groups: map coordinates and attribute frequency counts.
199
2.5.3. Think Aloud Task:
200
The panelists' strategy audio files were analyzed for content and 4 dimensions were derived
201
from the analysis in order to fully characterize the mapping strategies adopted. At the start of
202
the task, panelists were found to differ in their early attention focus (building the map or
generating attributes); moreover some panelists compared samples for overall
204
similarities/differences while others focused on specific attributes to build their maps. This
205
lead to the generation of a holistic vs attribute driven approach dimension. Some panelists
206
attributed meanings to their axis and this was recorded in a 3rd dimension (axis meaning) to
207
investigate whether different panelists used different attributes to discriminate between
208
samples. Finally, which criteria were used to place the samples on the map (grouping similar
209
samples or placing different samples apart) was recorded in the grouping strategy
210
dimension. Panelist's strategies were assessed against those 4 dimensions for each modality.
211
212
3. Results:
213
3.1.Panelists' performance
214
The presentation of 2 pairs of duplicate samples for both paper and computer based maps
215
meant that 4 PPIs were generated by panelist. The PPIs ranged from 0.04 to 1.00 and
216
averaged 0.30 and 0.39 on the paper and 0.31 and 0.35 on the computer for duplicate pairs 1
217
and 2 respectively. For each task, panelists were excluded from the final analysis if both PPIs
218
were greater than 0.40 (poor) or the average of both PPIs was greater than 0.50 (inadequate)
219
as this was taken as an indication that the panelist had difficulties either with the task or the
220
type of sample. Twenty three and 24 panelists were included respectively in the paper and
221
computer analysis.
222
Twenty panelists out of 32 stated that they were more comfortable with the computer task;
223
overwhelmingly citing being able to move the samples around the screen map on re-taste as
224
the main reason for this (although this flexibility was cited as the reason for preferring the
225
paper support by one panelist who felt it was too easy to change her mind). The judges who
226
were more comfortable performing the task on paper (10 out of 32) often cited the same
reason: greater flexibility to move samples around and use the whole space but also cited
228
being able to draw relationships between samples/attributes (using arrows for example). Two
229
panelists out of 32 stated being equally comfortable performing either. Overall, the majority
230
of the panelists was more comfortable using the computer to perform the task however; this
231
did not translate into a significantly better performance as assessed by PPI and there was no
232
significant difference in performance with respect to support type (p = 0.744) or duplicate
233
pair (p = 0.105).
234
3.2. Consensus maps
235
3.2.1. Comparison between paper and computer based projective mapping
236
A HMFA was performed on the paper and computer dataset. The samples coordinates and
237
attribute frequency count represented one level of hierarchy and acquisition method
238
(paper/computer) represented another. Figure 1 presents the overall product map with the
239
superimposed partial clouds associated with the 2 tasks and Figure 2 presents the relationship
240
of the groups to the first two dimensions.
241
Figures 1 and 2 thereabout
242
Both sets of duplicate samples came out grouped together. The space was defined by a
243
triangle which extremities were represented by the Erdinger and Beck’s blue samples (clearly
244
opposed on dimension 1) and the Brasserie Blonde and beck’s light (opposed to the others on
245
dimension 2). The partial clouds representing both acquisition methods remained close to the
246
samples barycenter indicating a good level of agreement between the methods; this was
247
further supported by the proximity of the groups with respect to their contribution to
248
dimension 1 and 2 (variation 61.4%, Figure 2). However, while this representation pointed to
249
a good agreement between the paper and computer tasks, it did not give any indication of
agreement between individual maps and each acquisition method was studied separately to
251
this effect.
252
Figures 3 and 4 present the consensus maps obtained respectively from the paper and
253
computer based projective mapping exercises.
254
Figures 3 and 4 thereabout
255
There was an overall excellent agreement between the paper and computer generated
256
consensus maps. The first 2 dimensions represented respectively 61.7% and 59.5% of the
257
variation for the paper and computer projective mapping tasks. The samples groupings were
258
very similar for both modalities as evidenced by identical clusters (Figures 3 and 4).
259
Duplicate samples were grouped together while the 2 light beers were grouped together and
260
the 2 strong beers formed the last cluster. Dimension 1 opposed the Erdinger samples to the
261
Beck’s blue samples while dimension 2 opposed the light beers (Beck’s light and Brasserie
262
Blond) to the other samples. Beck's and Foster Gold were found towards the center of the
263
maps.
264
The average number of attributes generated per panelist and per sample was slightly greater
265
for the computer task (4.2) than for the paper task (3.6). Grouping synonyms and removing
266
the attributes cited only once resulted in the generation of respectively 36 and 31 different
267
attributes for the paper and computer tasks. The attributes significantly correlated to the first
268
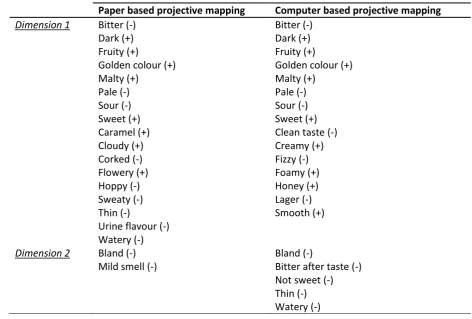
two dimensions are presented in Table 1.
269
Table 1 thereabout
270
A strong level of agreement in sample description/attribute generation was observed between
271
the paper and computer tasks with 8 common attributes for dimension 1 (5 positively
272
correlated and 3 negatively correlated) and 1 common attribute (bland, negatively correlated)
for dimension 2. Anecdotally, panelists did not generate attributes related to alcohol content
274
or strength and informal feedback indicated that they had not guessed that some beers were
275
alcohol free.
276
3.2.2. Panelists' comparison
277
Reasonably good agreements were observed between the individual maps and the consensus
278
maps with RV coefficients averaging 0.69 (range 0.45 to 0.93) for the paper MFA and 0.63
279
(range 0.30 to 0.93) for the computer MFA. RV coefficients between individual maps ranged
280
from 0.06 to 0.92 (average 0.44) and 0.01 and 0.88 (average 0.35) for respectively the paper
281
and computer projective mapping tasks. While these values are in line with those reported
282
elsewhere (Hopfer and Heymann 2013), they are indicative of poor agreements between
283
some of the individual maps. This disagreement is unlikely to stem from poor quality maps as
284
only maps meeting the PPI criteria outlined in section 3.1. and deemed of good quality were
285
included in the final analysis. In order to understand the origin of the poor agreement
286
observed between some individual maps, 10 panelists were asked to come back for a second
287
session in which they were required to “think aloud” their strategies whilst performing the
288
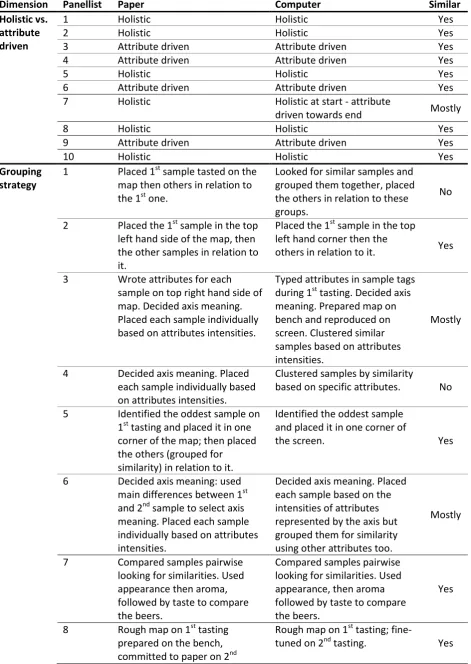
tasks. Content analysis of the recordings identified 4 dimensions to the panelists' mapping
289
strategies. The breakdown of the panelists' strategies into these 4 dimensions is presented in
290
Table 2.
291
Table 2 thereabout
292
The strategies adopted by panelists from task to task proved remarkably stable on all 4
293
strategy dimensions. In this respect, a change of support did not induce a major shift in
294
panelists' strategy but often resulted in an adaptation of the same strategy. For example, on
295
first tasting, panelist 3 wrote the samples attributes in one corner of the paper map or on the
296
electronic tags. But different panelists adopted vastly different strategies ranging from purely
holistic with no articulated meaning associated with the axis to attribute-led approaches in
298
which the panelist attributed meanings to the axis. Even within these two approaches (holistic
299
vs. attribute-led), there existed considerable differences in the map construction for the
300
holistic approach with some panelists clustering similar samples together (panelist 1), others
301
focusing on greatest differences (panelist 5) and yet another clustering samples by perceived
302
“class” of samples (panelist 8: traditional beers / low quality). For the attribute-led approach,
303
the choice of attributes around which the map was built differed with criteria based on three
304
different modalities: appearance, taste and texture. It is interesting to notice that while none
305
of the panelists explicitly used smell to label their axis, a number of attributes related to
306
aroma compounds were significantly correlated with the first two dimensions on the maps,
307
such as flowery, fruity, caramel and honey. This is consistent with the approach used by
308
panelist 6 who defined axis meanings (bitterness and thickness) but fine-tuned the map using
309
other attributes (smell). There was no difference between the average PPI values obtained
310
using the holistic approach (average: 0.23) and attribute-led approach (average: 0.23).
311
312
4. Discussion:
313
Overall, despite the fact that a majority of panelists were more comfortable performing
314
projective mapping on the computer, which may be a reflection of the panelists' occupations,
315
the type of support (paper/computer) did not impact on panelists' performance as assessed by
316
the PPI; nor did it impact on the final map results with very similar consensus maps generated
317
in terms of sample grouping and opposition between samples. In this respect, it could be
318
argued that the paper and computer maps generated did not differ more than replicates of the
319
same task, indeed studies specifically investigating projective mapping repeatability showed
320
that overall similarities and dissimilarities were conserved despite somewhat different
consensus maps (Hopfer and Heymann 2013) and/or poor agreements between individual
322
panelist's replicates (Kennedy 2010). Whilst there is surprisingly little literature on the
323
subject of paper vs. computer in the field of sensory science, it has often been reported that
324
pen-and-paper and online data acquisition methods yield similar results in other disciplines
325
(Campos et al. 2011; Díaz de Rada and Domínguez-Álvarez 2014; Gravlee et al. 2013;
326
Swaney-Stueve and Heymann 2002). The subtle differences reported surrounded item
327
response rate and expense of answers on open ended questions, which may be compared to
328
the number of attributes generated in projective mapping. In this respect, the same trend was
329
observed in this study whereby the average number of attributes generated per sample and per
330
panelist was slightly higher on the computer than on paper, however, this did not result in
331
richer sample descriptions as slightly more different attributes were generated on paper. A
332
similar observation was reported when comparing paper and computer based hard laddering
333
techniques (Russell et al. 2004): participants, who were able to review previous answers on
334
the paper, generated new links between levels while they re-used more often existing links on
335
the computer. In the computer version of projective mapping, panelists could easily select
336
attributes which they had already typed to describe another sample and this may have
337
facilitated their selection and discouraged the generation of new attributes, resulting in a
338
higher average number of attributes per sample and panelist but an overall lower number of
339
different attributes used to characterize the sample set. However, the differences remained
340
small and the overall trend was that of a good agreement between the techniques.
341
The fact that a small percentage of panelists struggle with projective mapping is well
342
documented (Pagès 2005; Veinand et al. 2011) with panelists rating projective mapping as
343
more difficult than techniques based on the evaluation of sensory characteristics (Ares et al.
344
2011). In line with this, some poor performances on the people performance index were
345
observed and results from panelists who failed to correctly identify duplicates were not
included in the final analysis. Despite this, RV coefficients demonstrated a range of
347
agreement levels between individual maps as observed elsewhere (Hopfer and Heymann
348
2013). This may partly be explained by the vastly different strategies adopted by panelists
349
irrespective of the support used. Although the number of panelists used in the second part of
350
the study is relatively small, the study did not aim to report all possible strategies adopted and
351
there is sufficient evidence that considerable differences in how panelists having received the
352
same instructions approach the task, exist. While self-reported strategies in projective
353
mapping have never been documented before, different cognitive strategies which appeared
354
unrelated to spatial or verbal abilities have been evidenced in conceptual mapping (Hilbert
355
and Renkl 2008), In projective mapping, different separation criteria and map structures were
356
reported elsewhere using a close examination of the maps generated (Hopfer and Heymann
357
2013). Our findings extend and confirm these observations. This sheds a new light on
358
projective mapping as a task which has up until now frequently been described as a holistic
359
method (Dehlholm et al. 2012; Varela and Ares 2012) as opposed to an attribute-driven (or
360
reductionist) one. It is clear from this data that while the holistic dimension of the task is
361
represented in the fact that panelists are free to select the attributes which they use to
362
discriminate between samples; some panelists spontaneously adopt a reductionist approach.
363
This may explain the success of partial napping, in which panelists are required to build
364
different maps for each modality with greater RV coefficients reported for replicates within
365
each modality than for global napping (Louw et al. 2013). This could be attributed to a lower
366
number of possible attributes against which operating the discrimination in partial napping.
367
This may be taken as an indication that more prescriptive instructions may improve
368
performance, however, no trend was observed with respect to panelists' strategy and
369
performance on PPI. The range of strategies adopted by consumers may partly explain why a
370
relatively high number of consumers compared to current practices in the field has recently
been advocated to ensure map stability; although this was estimated using a conservative RV
372
coefficient criteria and it was noted that the number of consumers required to reach stability
373
decreased with increasing levels of difference between the samples (Vidal et al. 2014).
374
Introducing blind duplicates to remove the judges experiencing difficulties with the task or
375
product range may also increase reliability and decrease the number of consumers required.
376
377
5. Conclusion:
378
The majority of panelists reported being more comfortable performing the task on computer;
379
however, this did not impact on panelists' performance which was not significantly different
380
between the paper and computer tasks and there was a high level of agreement between the
381
paper and computer consensus maps. Panelists adopted similar strategies to perform either
382
task, but those differed drastically between panelists. In this respect, the limitations of
383
computer based projective mapping are the same as those documented for paper based
384
projective mapping. It is recommended that blind duplicates are included in the sample set. It
385
is likely that the panelists used in this study were reasonably computer literate and not fully
386
representative of consumers selected from a wider range of occupations. These results should
387
therefore be interpreted with caution and may not be generalized to populations with low
388
degrees of computer literacy.
389
Further work should investigate strategies adopted by trained panels as they may approach
390
the task in a more analytical way and may display greater consensus around the attributes
391
selected to discriminate between samples.
392
393
6. Declaration of interest:
The authors do not have any conflict of interest to declare.
395
396
7. List of references:
397
ALBERT, A., VARELA, P., SALVADOR, A., HOUGH, G. and FISZMAN, S. 2011.
398
Overcoming the issues in the sensory description of hot served food with a complex texture.
399
Application of QDA, flash profiling and projective mapping using panels with different
400
degrees of training. Food Qual. Pref. 22, 463-473
401
ARES, G., DELIZA, R., BARREIRO, C., GIMÉNEZ, A. and GÁMBARO, A. 2010.
402
Comparison of two sensory profiling techniques based on consumer perception. Food Qual.
403
Pref. 21, 417-426
404
ARES, G., VARELA, P., RADO, G. and GIMÉNEZ, A. 2011. Are consumer profiling
405
techniques equivalent for some product categories ? The case of orange-flavoured powdered
406
drinks. Int. J. Food Sci. Technol. 46, 1600-1608
407
BARCENAS, P., PÉREZ ELORTONDO, F. J. and ALBISU, M. 2004. Projective mapping in
408
sensory analysis of ewes milk cheeses: A study on consumers and trained panel performance.
409
Food Res. Int. 37, 723-729
410
CAMPOS, J. A. D. B, ZUCOLOTO, M. L., BONAFÉ, F. S. S, JORDANI, P. C. and
411
MAROCO, J. 2011. Reliability and validity of self-reported burnout in college students: A
412
cross randomized comparison of paper-and-pencil vs. online administration. Comp. Hum.
413
Behavior. 27, 1875-1883
CARTIER, R., RYTZ, A., LECOMTE, A., POBLETE, F., KRYSTLIK, J., BELIN, E. and
415
MARTIN, N. 2006. Sorting procedure as an alternative to a product sensory map. Food Qual.
416
Pref. 17, 562-571
417
CHAMBERS, E. IV., GODWIN, S. L. And VECCHIO, F. A. 2000. Cognitive strategies for
418
reporting portion sizes using dietary recall procedures. J. Am. Diet. Assoc. 100, 891-897
419
DEHLHOLM, C., BROCKHOFF, P. B., MEINERT, L., AASLYNG, M. D. and BREDIE,
420
W. L. P. 2012. Rapid descriptive sensory methods – Comparison of Free Multiple Sorting,
421
Partial Napping, Napping, Flash Profiling and conventional profiling. Food Qual. Pref. 26,
422
267-277
423
DÍAZ de RADA, V. and DOMÍNGUEZ-ÁLVAREZ, J. A. 2014. Response quality of
self-424
administered questionnaires: A comparison between paper and web questionnaires. Social
425
Sci. Comp. Review. 32, 256-269
426
GRAVLEE, C. C., BERNARD, H. R., MAXWELL, C. R. and JACOBSOHN, A. 2013.
427
Mode effects in free-list elicitation: Comparing oral, written, and web-based data collection.
428
Social Sci. Comp. Review. 31, 119-132
429
HILBERT, T. S. and RENKL, A. 2008. Concept mapping as a follow-up strategy to learning
430
from texts: what characterizes good or poor mappers? Instr. Sci. 36, 53-73
431
HOPFER, H. and HEYMANN, H. 2013. A summary of projective mapping observations –
432
The effect of replicates and shape, an individual performance measurements. Food Qual.
433
Pref. 28, 164-181
434
HUSSON, F., JOSSE, J., LÊ, S. and MAZET, J. 2014. Multivariate Exploratory Data
435
Analysis and Data Mining with R (Version 1.28)
JAEGER, S. R., CARDELLO, A. V. and SCHUTZ, H. G. 2013. Emotion questionnaires : A
437
consumer-centric perspective. Food Qual. Pref. 30, 229-241
438
JIMENEZ, M. J., CANET, W. and ALVAREZ, M. D. 2013. Sensory Description of Potato
439
Puree Enriched with Individual Functional Ingredients and Their Blends.J. Texture Stud. 44,
440
301-316
441
KENNEDY, J. 2010. Evaluation of replicated projective mapping of granola bars. J. Sens.
442
Stud. 25, 672-684
443
KENNEDY, J. and HEYMANN, H. 2009. Projective mapping and descriptive analysis of
444
milk and dark chocolates. J. Sens. Stud. 24, 220-223
445
LAWLESS, H. T. and HEYMANN, H. 2010. Sensory Evaluation of Food. 2nd ed. Springer,
446
New York, NY
447
LÊ, S., JOSSE, J. and HUSSON, F. 2008. FactoMineR: An R package for multivariate
448
analysis. J. Stat. Software. 25, 1-18
449
450
LE DIEN, S. and PAGÈS, J. 2003. Hierarchical multiple factor analysis: Application to the
451
comparison of sensory profiles. Food Qual. Pref. 14, 397-403
452
LOUW, L., MALHERBE, S., NAES, T., LAMBRECHTS, M. and VAN RENSBURG, P.
453
2013. Validation of two Napping techniques as rapid sensory screening tools for high
454
alcohol products. Food Qual. Pref. 30, 192-201
455
LOUW, L., OELOFSE, S., NAES, T., LAMBRECHTS, M., VAN RENSBURG, P. and
456
NIEUWOUDT, H. 2014. Trained sensory panellists’ response to product alcohol content in
the projective mapping task: observations on alcohol content, product complexity and prior
458
knowledge. Food Qual. Pref. 34, 37-44
459
MIELBY, L. H., HOPFER, H., JENSEN, S., THYBO, A.K. and HEYMANN, H. 2014.
460
Comparison of descriptive analysis, projective mapping and sorting performed on pictures of
461
fruit and vegetable mixes. Food Qual. Pref. 35, 86-94
462
MOSKOWITZ, H. 2002. Mapping in product testing and sensory analysis: A well lit path or
463
a dark statistical labyrinth? J. Sens. Stud. 17, 207-213
464
MOUSSAOUI, K. A. and VARELA, P. 2010. Exploring consumer product profiling
465
techniques and their linkage to a quantitative descriptive analysis. Food Qual. Pref. 21,
1088-466
1089
467
NESTRUD, M. A. and LAWLESS, H. T. 2008. Perceptual mapping of citrus juices using
468
projective mapping and profiling data from culinary professionals and consumers. Food Qual.
469
Pref. 19, 431-438
470
NESTRUD, M. A. and LAWLESS, H. T. 2010. Perceptual mapping of apples and cheeses
471
using projective mapping and sorting. J. Sens. Stud. 25, 390-405
472
PAGÈS, J. 2005. Collection and analysis of perceived product inter-distances using multiple
473
factor analysis: Application to the study of 10 white wines from the Loire Valley. Food Qual.
474
Pref. 16, 642-649
475
PAGÈS, J. and HUSSON, F. 2001. Inter-laboratory comparison of sensory profiles:
476
Methodology and results. Food Qual. Pref. 12, 297-309
PERRIN, L., SYMONEAUX, R., MAÎTRE, I., ASSELIN, C., JOURJON, F. and PAGÈS, J.
478
2008. Comparison of three sensory methods for use with the Napping procedure: Case of
479
ten wines from Loire valley. Food Qual. Pref. 19, 1-11
480
R Core team. 2013. R: A language and environment for statistical computing. R Foundation
481
for Statistical Computing, Vienna, Austria. http://www.R-project.org/. Last accessed
482
02.01.2015.
483
RISVIK, E., McEWAN, J. A., COLWILL, J. S., ROGERS, R. and LYON, D. H. 1994.
484
Projective mapping: A tool for sensory analysis and consumer research. Food Qual. Pref. 5,
485
263-269
486
RISVIK, E., McEWAN, J. A. and RØDBOTTEN, M. 1997. Evaluation of sensory profiling
487
and projective mapping data. Food Qual. 1, 63-71
488
ROBERT, P. and ESCOUFIER, Y. 1976. A unifying tool for linear multivariate statistical
489
methods: the RV-coefficient. Appl. Statist. 25, 257-265
490
RUSSELL, C. G., FLIGHT, I., LEPPARD, P., VAN LAWICK VAN PABST, J. A.,
491
SYRETTE, J. A. and COX, D. N. 2004. A comparison of paper-and-pencil and computerised
492
methods of "hard" laddering. Food Qual. Pref. 15, 279-291
493
SANTOS, B. A., POLLONIO, M. A. R., CRUZ, A. G., MESSIAS, V. C., MONTEIRO, R.
494
A., OLIVEIRA, T. L. C., FARIA, J. A. F., FREITAS, M. Q. and BOLINI, H. M. A. 2013.
495
Ultra-flash profile and projective mapping for describing sensory attributes of prebiotic
496
mortadellas.Food Res. Int. 54, 1705-1711
497
SWANEY-STUEVE, M. and HEYMANN, H. 2002. A comparison between paper and
498
computerized ballots and a study of simulated substitution between the two ballots used in
499
descriptive analysis. J. Sens. Stud. 17, 527-537
VALENTIN, D., CHOLLET, S., LELIÈVRE, M. and ABDI, H. 2012. Quick and dirty but
501
still pretty good : a review of new descriptive methods in food science. Int. J. Food Sci.
502
Technol. 47, 1563-1578
503
VARELA, P. and ARES, G. 2012. Sensory profiling, the blurred line between sensory and
504
consumer science. A review of novel methods for product characterization.Food Res. Int. 48,
505
893-908
506
VEINAND, B., GODEFROY, C., ADAM, C. and DELARUE, J. 2011. Highlight of
507
important product characteristics for consumers. Comparison of three sensory descriptive
508
methods performed by consumers. Food Qual. Pref. 22, 474-485
509
VIDAL, L., SILVA CADENA, R., ANTÚNEZ, L., GIMENÉZ, A., VARELA, P. and ARES,
510
G. 2014. Stability of sample configurations from projective mapping: How many consumers
511
are necessary? Food Qual. Pref. 34, 79-87
512
VICENTE, E., VARELA, P., DE SALDAMENDO, L. and ARES, G. 2014. Evaluation of the
513
sensory characteristics of strawberry cultivars throughout the harvest season using projective
514
mapping.J. Sci. Food Agric. 94, 591-599
515
Table 1: attributes significantly (p<0.05) correlated to dimensions 1 and 2 – 1st study 517
Paper based projective mapping Computer based projective mapping Dimension 1 Bitter (-) Bitter (-)
Dark (+) Dark (+) Fruity (+) Fruity (+)
Golden colour (+) Golden colour (+) Malty (+) Malty (+)
Pale (-) Pale (-) Sour (-) Sour (-) Sweet (+) Sweet (+) Caramel (+) Clean taste (-) Cloudy (+) Creamy (+) Corked (-) Fizzy (-) Flowery (+) Foamy (+) Hoppy (-) Honey (+) Sweaty (-) Lager (-) Thin (-) Smooth (+) Urine flavour (-)
Watery (-)
Dimension 2 Bland (-) Bland (-)
Mild smell (-) Bitter after taste (-) Not sweet (-) Thin (-) Watery (-) 518
Table 2: panellists’ strategies for paper and computer PM tasks – 2nd study 520
Dimension Panellist Paper Computer Similar Holistic vs.
attribute driven
1 Holistic Holistic Yes
2 Holistic Holistic Yes
3 Attribute driven Attribute driven Yes 4 Attribute driven Attribute driven Yes
5 Holistic Holistic Yes
6 Attribute driven Attribute driven Yes 7 Holistic Holistic at start - attribute
driven towards end Mostly
8 Holistic Holistic Yes
9 Attribute driven Attribute driven Yes
10 Holistic Holistic Yes
Grouping strategy
1 Placed 1st sample tasted on the map then others in relation to the 1st one.
Looked for similar samples and grouped them together, placed the others in relation to these groups.
No
2 Placed the 1st sample in the top left hand side of the map, then the other samples in relation to it.
Placed the 1st sample in the top left hand corner then the
others in relation to it. Yes
3 Wrote attributes for each sample on top right hand side of map. Decided axis meaning. Placed each sample individually based on attributes intensities.
Typed attributes in sample tags during 1st tasting. Decided axis meaning. Prepared map on bench and reproduced on screen. Clustered similar samples based on attributes intensities.
Mostly
4 Decided axis meaning. Placed each sample individually based on attributes intensities.
Clustered samples by similarity
based on specific attributes. No
5 Identified the oddest sample on 1st tasting and placed it in one corner of the map; then placed the others (grouped for similarity) in relation to it.
Identified the oddest sample and placed it in one corner of
the screen. Yes
6 Decided axis meaning: used main differences between 1st and 2nd sample to select axis meaning. Placed each sample individually based on attributes intensities.
Decided axis meaning. Placed each sample based on the intensities of attributes represented by the axis but grouped them for similarity using other attributes too.
Mostly
7 Compared samples pairwise looking for similarities. Used appearance then aroma, followed by taste to compare the beers.
Compared samples pairwise looking for similarities. Used appearance, then aroma followed by taste to compare the beers.
Yes
8 Rough map on 1st tasting prepared on the bench, committed to paper on 2nd
Rough map on 1st tasting;
tasting.
9 Separated the samples by colour then smelled them all writing down attributes along, then tasted all the samples writing down attributes before finishing the map. Used arrows to link descriptors to crosses on the map.
Prepared a rough map on the bench, decided on attributes to discriminate between samples before reproducing the map on
the screen. No
10 Identified similar samples to group together.
Identified similar samples to
group together. Yes
Axis meaning
1 No articulated meaning for axis. No articulated meaning for axis. Yes 2 No articulated meaning for axis. No articulated meaning for axis. Yes 3 Appearance/colour selected as
dimension before starting to taste. Complemented by bitter/sweet after 3 samples.
Appearance/colour selected as dimension before starting to taste. Complemented by bitter/sweet after a few samples.
Yes
4 After tasting 2 samples, axis meaning selected as flat – frothy (x axis) and sweet – bitter (y axis).
No articulated axis meaning.
No
5 No articulated meaning for axis. No articulated meaning for axis. Yes 6 Bitterness and thickness
established right away as axis meaning.
Bitterness and thickness established as axis meaning after a few samples.
Yes
7 No articulated meaning for axis. No articulated meaning for axis but placed last samples in relation to others citing colour and sweetness.
Mostly
8 Perceived product category used ("traditional beers" at the top).
Perceived product category used ("real ales" or "low quality").
Yes
9 X axis related to colour, y axis not specified.
Selected attributes for the x and y axis early on "I have now selected the attributes I'll use to build my map" but does not speak them out loud.
Mostly
10 Not consciously articulated but used "sweetness" and "light" to characterise and separate groups of samples.
Not consciously articulated but used "bitter" and "light straw" to characterise and separate groups of samples.
Yes
Early attention focus
1 Map: built the map then focused on attributes.
Map: built the map then
generated attributes. Yes 2 Map: built the map then wrote
attributes down.
Attributes: typed attributes in sample tags then generated the map.
No
3 Attributes: wrote attributes down for all samples in the top left corner of the map before generating the map.
Attributes: typed attributes for each sample in the sample tags
521
522
4 Concurrent: wrote the attributes down as the map was
generated.
All samples dragged onto the screen to type attributes. Appearance attributes typed first then concurrent, attributes/map.
Mostly
5 Map: generated the map then wrote the attributes on re-tasting/finalising the map.
Map: typed the attributes when
happy with the map. Yes
6 Concurrent: described samples using the axis meaning and sample characteristics to generate the map.
Concurrent: typed the
attributes in the sample tags as they were tasted and placed on the map.
Yes
7 Concurrent: wrote the attributes down as the map was
generated.
Concurrent: typed the
attributes in the sample tags as they were tasted and placed on the map.
Yes
8 Map: rough generated the map then wrote the attributes on re-tasting/finalising the map.
Concurrent: typed the
attributes in the sample tags as they were tasted and roughly placed on the map. Map fine-tuned on re-tasting.
Mostly
9 Attributes: all samples assessed for appearance then aroma then taste.
Map: quick taste tour to build map on bench then re-taste to fine-tune and type sample descriptions.
No
10 Attributes: described all the samples before placing them on the map and writing down attributes.
Attributes: described all the samples before placing them on the map and typing in the attributes.