Abstract—In this paper, we utilize the RGB color model based on binary joint transform power spectrum for polychromatic pattern recognition. Here, the multi-channel joint transform correlator is set to be the optical discrimination configuration. To achieve the distortion invariance in discrimination processes, we also use the minimum average correlation energy approach to yield sharp correlation peak. The results show the proposed method can detect the target image successfully.
Index Terms—pattern recognition, binary joint transform power spectrum, multi-channel joint transform correlator.
I. INTRODUCTION
The techniques of optical correlator provide following advantages such as real-time signal processing and capability of high-speed parallel operation. Most of the optical pattern recognition systems are based on the 4-f VanderLugt correlator (VLC) [1] and the joint transform correlator (JTC) [2]. In 1966, Weaver and Goodman [3] proposed JTC. Compare with 4-f VLC, the optical structure is uncomplicated. The reference image and target image are displayed side by side at the input plane with no accurate problem. It is easy to be implemented optically and is robust in system alignment. However, there is still zero term that is not necessary [4]. Because the zero term almost overshadows the desired cross-correlation peaks and can reduce discrimination ability. In 1995, Lu eliminated the zero order term with a joint transform power spectrum (JTPS) subtraction to realize the non-zero order JTC (NOJTC) [5-6]. The system is better than the classical JTC. We can obtain high correlation peak intensity, small correlation sidelobes, and narrow correlation bandwidth. Later, Mahalanobis, Kumar, and Casasent utilized the minimum average correlation energy (MACE) [7-8] method based on Lagrange multiplier to get the
Manuscript received October 10, 2010.. This work was supported by the National Science Council in Taiwan, under Grant No. NSC 96-2628-E-155-005-MY3.
Yuming Chen is with the Department of Photonics Engineering, Yuan Ze university, 135 Yung Tung Road, Taoyuan 32026, Taiwan.
Chulung Chen is with the Department of Photonics Engineering, Yuan Ze university, 135 Yung Tung Road, Taoyuan 32026, Taiwan. (Corresponding author. Phone: +886-3-4638800 ext 7513; Fax: +886-3-4639355; E-mail: [email protected]).
Weichih Liao is with the Department of Photonics Engineering, Yuan Ze university, 135 Yung Tung Road, Taoyuan 32026, Taiwan.
Sihliang Fu is with the Department of Photonics Engineering, Yuan Ze university, 135 Yung Tung Road, Taoyuan 32026, Taiwan.
minimum sidelobes So the correlation peak will be sharper. Recently, the multi-level quantized reference function (MQRF) was constructed by Chen et al. [9]. The limited quantized range is suitable for realizing the input plane of JTC system. The zero term also can be solved through the binary JTC [10]. In this system, the Fourier transforms interference intensity is modified to two values. So the interference intensity can be read out. Furthermore, owing to the concern in cost on liquid crystal spatial light modulators, binary JTPS is an additional technique we adopt. In this article, we utilize a NOJTC with RGB channels based on binary joint transform power spectrum.
II. ANALYSIS
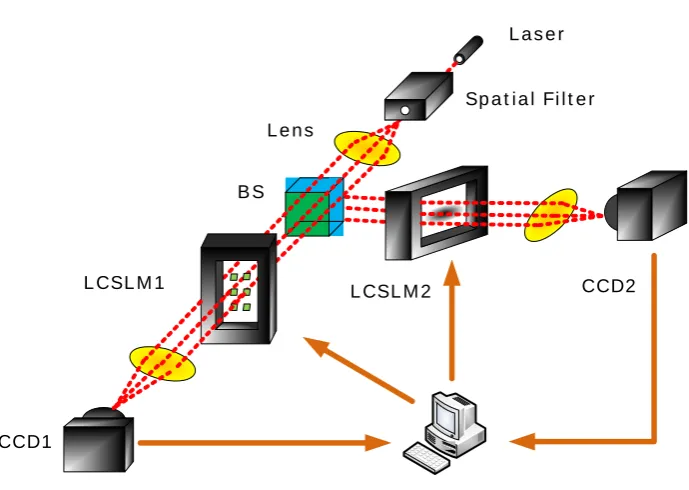
The multi-channel nonzero order joint transform correlator (NOJTC) based on binary joint transform power spectrum is composed of a laser, a beam splitter (BS), three lenses (Lens, Lens1, 2), two image capture devices (CCD1, 2), and two liquid crystal spatial light modulator (LCSLM1,2). The strategy is performed in Fig. 1. Here we describe the positions of reference and the components of target images above on the input plane in Eq. (1).
3 3
1 1
( , ) [ (m , m)] [ (n , n)] .
m n
I x y r x a y y t x a y y
(1)We define y1b, y2 0, and y3 b. I x y( , ) means the
total input plane. The reference images rm are displayed on the left half of LCSLM1 and the target images tn are displayed on the right half of the same SLM panel. The coherent and collimated beam from the collimated lens illuminates the LCSLM1 and lens1. The JTPS will be recorded on the CCD1. The beam illuminates the lens1 can be seen as the process of Fourier transform as follows:
3 1 3 1( , ) ( , ) exp[ 2 ]
( , ) exp[ 2 ] .
x y m x y x m y
m
n x y x n y
n
I f f R f f j af y f
T f f j af y f
(2)We send the obtained JTPS from CCD1 camera to the computer. Then we will subtract the zero-order term (DC term) to get the nonzero JTPS. The JTPS are sent to LCSLM2. The beam illuminates the LCSLM2 pass through lens2 to perform the inverse Fourier transform via Lens2 and the output
Optoelectronic Correlator Based on Binary
JTPS with Multi-level Quantized Reference
Function for Chromatic Image Recognition
coordinates have to reverse. We can obtain the cross-correlation in CCD2. The final cross-correlation output in CCD2 will be expressed as follows:
3 3 2 * 1 1 3 3
2 1 1
( , ) ( , ) ( 2 , )
( , ) ( 2 , ) ,
mn m n
m n
mn n m
m n
o x y c x y x a y y y
c x y x a y y y
(3)the cmn( , )x y r x ym( , )t x yn( , ) represents the cross-correlation between r x ym( , ) and f x ym( , ) ; the symbols and denote the correlation and convolution operations, respectively. Here we use three-channel NOJTC to show the concept. This system is based on the combination of cheaper liquid crystal panel, CCD camera and computer. We send the reference image rm and the target image tn above on the input plane. Here a is the distance from the center of input plane to the reference image. Then we will obtain the NOJTPS in the Fourier transform plane. In this paper, we have applied an efficient technique of the binary JTPS recognition using the concept of NOJTC. The BIJTPS intensity can be binarized by Eq. (3). 1 0 { . 1 if NOJTPS BIJTPS otherwise
. (4)
A joint Fourier transform image correlator that uses a binary spatial light modulator at the Fourier transform plane is presented in LCSLM2. The binary SLM is cheaper and can be used in real-time optical correlation.
By using the Lagrange multipliers technique, the optimum reference function can be obtained in Fourier domain as follows:
1 1 *
1 ˆ
ˆ ˆ ˆ ˆ ˆ ˆ .
HD F F D F C (5)
Since the LCSLM devices in the NOJTC system requires only real-valued modulator. Subsequently, we will prove that the reference function h x yˆ( , ) is a real-valued function. We define Dˆ1Aˆ2. Because Dˆ is a real-valued diagonal matrix, so Aˆ is a real-valued diagonal matrix whose diagonal elements are the positive reciprocal square roots of Dˆ. This allows Eq. (27) can be substituted as:
1 *
ˆ ˆ ˆ ˆ
ˆ ˆ ˆ ˆ ˆ .
HAAR R AAR U (6)
Let ARˆ ˆBˆ. A Fourier transform of real-valued function is a Hermitian symmetric function and Aˆ is a real-valued diagonal matrix, that we know each column of Bˆ represents a Hermitian image. Due to ˆU is a real-valued matrix. It is easy to find each column of Hˆ represents a Hermitian symmetric with
respect to the origin. So we rearrange HˆM1 to a square matrix ˆ
m n
H . The inverse Fourier transform of Hˆm n as follows:
1
ˆ ˆ ( , )x y ( , ) .
H f f h x y (7)
A above, we prove that h x y( , ) is a real-valued reference function in the spatial domain previously. Next, we quantize the reference function to finite integer levels by MQRF as Eq. (8).
( , ) 2
( , ) ,
Q
h x y
Q x y Round
M
(8)
where Round means to change the elements to the nearest integer, M is the maximum absolute value of h x y( , ), and Q
is the quantization parameter of the MQRF. The range of Q is decided from the bit depth. Through the MQRF, h x y( , ) can be expressed approximately as Q x y( , ).
With the observation on the correlation output at the output plane, some measurement criteria for evaluating the recognition ability are defined as follows:
CPI : correlation peak intensity
1.CPI is the maximum intensity of the output correlation plane. The maximum intensity located at the position (0,0). So we define it as
2
CPI c(0, 0) , (9)
2.PCE : peak to correlation energy ratio
Although we define the maximum peak intensity, we don’t know the sharpness of correlation profiles. The relation between desired correlation to total correlation energy is an important index. PCE ratio is defined as
2 2 , (0, 0) PCE= . ( , ) x y c c x y
(10)3.PSR : the primary peak to secondary ratio
We define the ratio between the primary and the secondary correlation peak energy as PSR. The lower PSR indicates the lower pattern discrimination. The PSR at the desires area is given by
2 2 , 2 (0, 0) PSR= ,max ( , ) x y
c
c x y
(11)
III. SIMULATION RESULTS
achieve the goal. Now we attempt to verify the outcomes for different angles in this section.
In our research, we use the multi-channel nonzero order joint transform correlator based on RGB model to be the structure. The target image in Fig. 2 is rotated from -10 o to 10 o (in steps of 2o), and the test set involves angles from -10 o to 10 o (in steps of 1o). The reference images are synthesized by the training images to achieve the distortion invariant. Subsequently, we process the step of Eq. (8) with the MQRF filter, as shown in Fig. 3. The three-dimensional correlation output profile for
7
Q , that compare with the traditional and the binary JTPS method are shown in Figs. 4(a) and (b). We can observe the desired peak obviously and the sidelobes that are diminished. Because we utilize the binary filter on the JTPS, the CPI is not a constant value. But the CPI value is still close to each other, as shown in Fig. 5 (a). When the target image is in the training image set, all the PSR exceeds 15% means that the desired correlation peak energy is much higher than the largest of sidelobes energy, as shown in Fig. 5 (b). The result exactly can be totally detected successfully with binary JTPS.
Moreover, we test the performance of our techniques for noisy input scenes. In order to obtain the exact result, we use samples of 100 different noise images with quantized level Q=7 for investigation. The ACPI APSR, and APCE values versus different SNR from 0 to 10 dB with Q=7, as show in Figs. 6 (a) to (c). The SNR influence the recognition ability obviously, all the CPI curve value decrease after illustrating the tolerance of noise degree in three channels. We observe that the APSR value with SNR = 10 is higher than that for SNR = 9. Because the noises are all random and the samplings maybe are not enough, so we obtained the results with little difference. From the results, we still can obtain the enough good ability for noisy environment.
IV. CONCLUSIONS
In this paper, we have applied an efficient technique of the binary JTPS recognition using the concept of MACE-NOJTC. This system is based on the combination of liquid crystal panel, CCD camera and computer. Then we employ MQRF to change the quantization range and find the better recognition when the quantization parameter Q=7 that is sufficient in our case. We can use cheaper LCSLM to obtain the recognition ability and the results are similar as using higher-quality LCSLM. Besides, with binary filter, we also can use uncomplicated and cheaper LCSLM to achieve our experiment. All the information of patterns is easy to simplify. In the future, we can try to encode the polychromatic pattern to simplify the three channels to one.
REFERENCES
[1] A. VanderLugt, “Signal detection by complex spatial filter,” IEEE Transactions on Information Theory, Vol. IT-10, pp. 139-146, 1964. [2] C. S. Weaver and J. W. Goodman, “A technique for optically convolving
two functions,” Applied Optics, Vol. 5, pp. 1248-1249, 1966.
[3] F. T. S. Yu, Q. W. Song, Y. S. Cheng and D. A. Gregory, “Comparison of detection efficiencies for VanderLugt and joint transform correlators,” Applied Optics, Vol. 29, pp. 225-232, 1990.
[4] C. Chen, “Joint transform correlator with minimum peak variance in
nonzero-mean noise environment,” Optics Communications, Vol. 187, pp. 319-323, 2001.
[5] P. Putwosumarto and F. T. S. Yu, “Robustness of joint transform correlator versus VanderLugt correlator,” Optical Engineering, Vol. 36, pp. 2775-2780, 1997.
[6] C. Li, S. Yin and F. T. S. Yu, “Nonzero-order joint transform correlator,” Optical Engineering, Vol. 37, pp. 58-65, 1998.
[7] C. Chen, “Minimum-variance nonzero order joint transform correlators,” Optics Communications, Vol. 182, pp. 91-94, 2000.
[8] A. Mahalanobis, B. V. K. V. Kumar and D. Casasent, “Minimum average correlation energy filters,” Applied Optics, Vol. 26, pp. 3633-3640, 1987. [9] C. Chen, “Joint transform correlator with minimum peak variance in
nonzero-mean noise environment,” Optics Communications, vol. 187, 2001, pp. 319–323.
Fig. 1. The architecture of system with binary JTPS.
Fig. 2. The original pattern.
Spatial Filter Laser
Lens
BS
LCSLM1
CCD1
LCSLM2 CCD2
Fig. 3 The quantized reference images for Q=7. Figs 4. The 3D correlation output profile. (a) Original (b) Binary JTPS
(a)
Figs 5 (a) CPI versus quantization parameter Q=7.
Figs 5 (b) PSR versus quantization parameter Q=7.
Figs 6. (a) ACPI versus SNR from0dB to 10 dB.
Figs 6. (b) APSR versus SNR from0dB to 10 dB.