Meta-Parametric Design
Abstract
Parametric modelling software often maintains an explicit history of design development in the form of a graph. However, as the graph increases in complexity it quickly becomes inflexible and unsuitable for exploring a wide design space. By contrast, implicit low-level rule systems can offer wide design exploration due to their lack of structure, but often act as black boxes to human observers with only initial conditions and final designs cognisable. In response to these two extremes, the authors propose a new approach called Meta-Parametric Design, combining graph-based parametric modelling with genetic programming. The advantages of this approach are demonstrated using two real case-study projects that widen design exploration whilst maintaining the benefits of a graph representation.
Keywords
Parametric design; conceptual design; design cognition; human-computer interaction; genetic programming.
In Computer-Aided Architectural Design (CAAD), two distinct approaches have found favour in recent years. The first involves parametric modelling using an explicit visual dataflow program in the form of a graph. Design variations are explored by adjusting input parameters. The second approach concerns implicit methods inspired by complex systems, whereby the process of generation is irreducible to an explicit representation.
Although the latter approach can often offer wide design exploration (Bentley and Kumar, 1999), it is debatable whether implicit bottom-up methods are suitable at the conceptual design stage simply because natural systems develop form in this way. Instead, by acknowledging that humans must converse with machines and each other as part of a healthy digital design process, an alternative approach is proposed that offers wide design exploration whilst retaining an explicit representation of development for human cognition.
1. Parametric modelling
to be quickly explored, often beyond the reach of traditional techniques such as hand sketching, physical model making and CAD.
A subset of parametric modelling based on dataflow programming associates parameters and functions to form a Directed Acyclic Graph (DAG). As well as generating a design, the DAG acts as a cognitive artifact describing the history of design development and shifting the focus from final form to that of digital process (Oxman, 2006).
1.1 Parametric design exploration
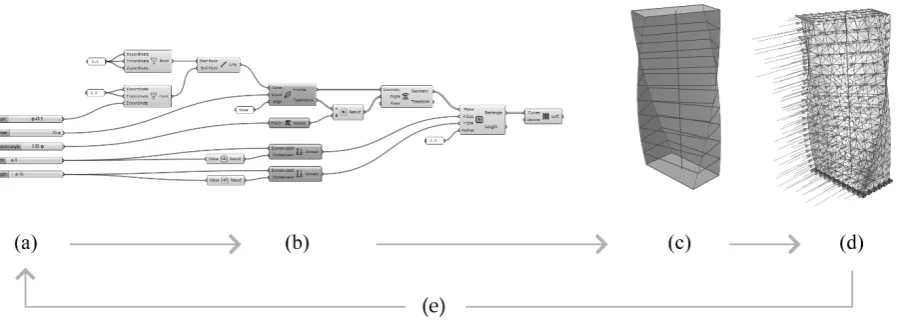
The structure of the DAG governs the design space to be explored when parameters are adjusted (Aish and Woodbury, 2005). A combination of parametric modelling and performance analysis tools allow designs to be evaluated both quantitatively and qualitatively in real-time when adjusting parameters (Shea et al., 2005). A typical DAG-based parametric schema is shown in Figure 1. Five numeric parameters (a) are passed through associated functions (b) that generate the design (c). Performance feedback from analysis (d) guides parameter adjustment, either manually or by setting an objective function and using a metaheuristic algorithm (e).
[image:2.595.76.525.520.682.2]To date, the most popular metaheuristics used in parametric design are evolutionary algorithms, due to their ability to efficiently explore a wide and unknown solution space (Turrin et al., 2011). Such tools are becoming increasingly mainstream as little or no programming experience is required to use them. For example, the introduction of the Galapagos Evolutionary Solver for Grasshopper (Rutten, 2013) has increased their popularity in architectural design (Ercan and Elias-Ozkan, 2015).
1.2 Limitations at the concept stage
The conceptual design stage is when the most important decisions are made that will shape the future of a project. It is also the time when least is known about the design constraints and objectives that will co-evolve during design development (Menges, 2012). Even if consistent quantitative design drivers can be identified, there often exists qualitative criteria that cannot be easily defined.
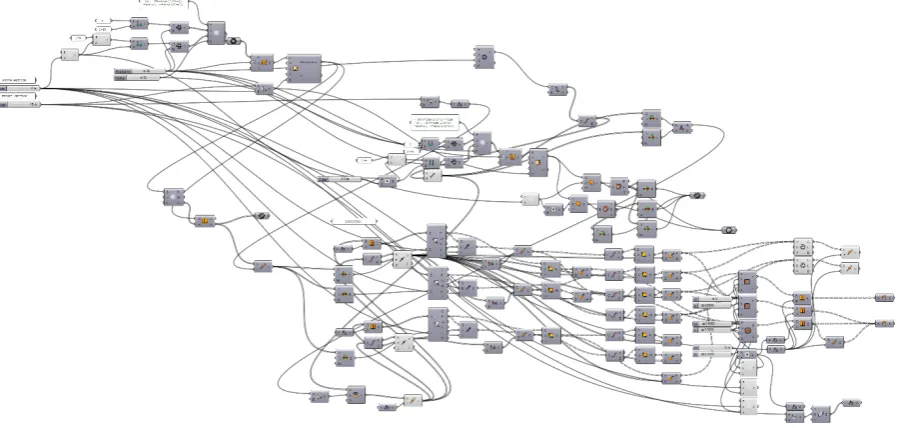
Although a DAG-based parametric model keeps a record of how the building geometry is created, displaying this explicitly comes at a price. As Aish and Woodbury (2005, p. 11) state: “nothing can be created in a parametric system for which a designer has not explicitly externalised. This runs counter to the often-deliberate cultivation of ambiguity that appears to be part of the healthy design process”. As the DAG becomes ever more complicated, so its flexibility reduces. The graph can quickly resemble a tangle of spaghetti, making it hard to follow geometric relationships (Davis et al., 2011) (Figure 2). In terms of design exploration, one is often left merely fine tuning numeric parameters.
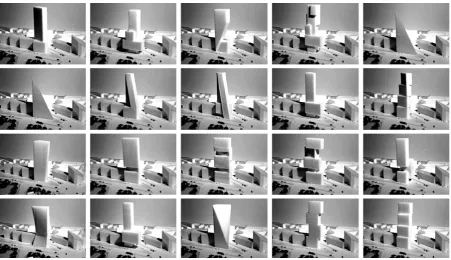
[image:3.595.75.524.489.703.2]The time required to generate topologically different parametric models is one reason why hand sketching and physical models are still popular at the concept stage, where the design process can jump between completely different typologies (Figure 3). That said, extracting quantitative performance is often difficult with sketches and physical models, leading to a temptation to begin with computer models from day one; a shift encouraged by developments in Building Information Modelling (BIM) for the early design stage (Eastman, 2009).
Figure 3. Physical massing models allow exploration of different design typologies but are difficult to analyse quantitatively.
1.3 Limitations on future development
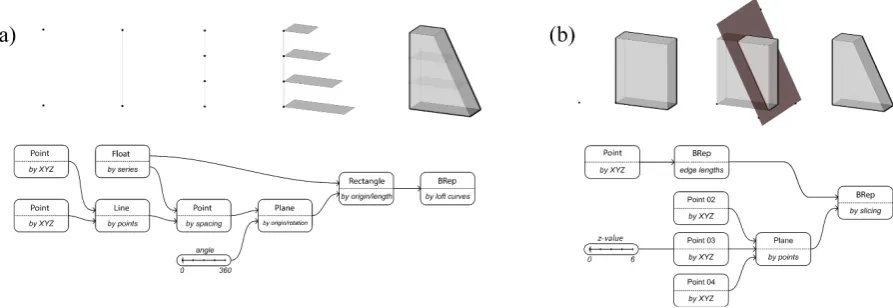
The relationship between a parametric model and its output is many-to-one, i.e. an identical form can be constructed using different parametric definitions. Figure 4 shows the same form created by lofting through shrinking floor profiles (a) and by slicing a cuboid with an inclined plane (b). Although the resulting form is identical, the graph structure defines subsequent model development. The design process can easily become locked-in, with any changes to requirements resulting in a time-consuming rebuild of the model from scratch (Holzer et al., 2007).
Figure 4. For the same initial form, two different parametric definitions give different design spaces when adjusting parameters.
2. An implicit approach
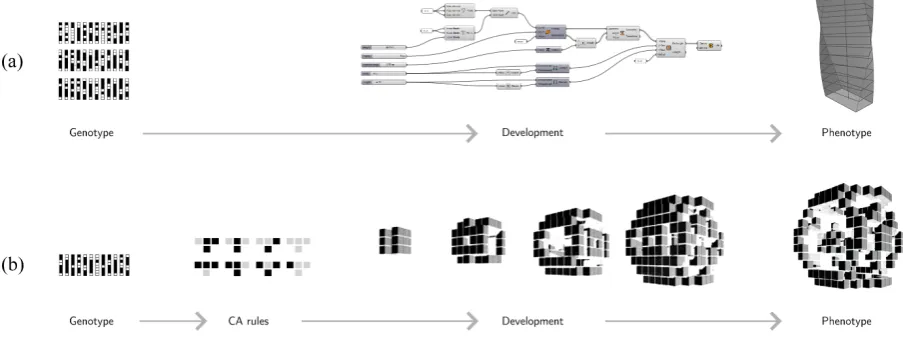
Unlike parametric models, natural systems do not keep an explicit record of how to build an organism laid out in their genes. An organism’s DNA contains rule based information that encodes an emergent process of development from a single embryo, i.e. morphogenesis. The complexity of an emergent process means that small alterations to the genotype can often lead to large changes to the phenotype, for example its size, shape and number of repeating modules in the living form. A small change to a relatively small set of genes known as the homeobox for example can give rise to large changes to the final ‘body-plan’ of the organism (Weinstock, 2010). 2.1 Artificial embryogenesis
Figure 5. Comparison between an implicit (a) and explicit (b) embryogeny for generating simple forms. CA example taken from Coates et al. (1999).
2.2 The process black-box
Whilst implicit methods have many advantages, the difficulty of understanding a complex development process is often overlooked. In Bentley and Kumar’s (1999) implicit example, only the final resulting design was available with no simple description of the development (i.e. CA rules to final design) that could be easily understood. This is in contrast to a parametric definition for example (Figure 5). In addition, due to the indirect mapping from genotype to phenotype, a small change in the initial rules and the process has to be run again from scratch. Even then it is difficult for the human observer to wilfully influence such a complex process, since any intervention can lead to a vastly different outcomes. This irreducibility is a well-known characteristic of both chaotic (Strogatz, 2006) and complex systems (Wolfram, 1984).
2.3 Impact on collaboration
The non-adoption of automatic plan generation tools in architecture (Liggett, 2000) shows the importance of feeling involved in the generative design process. As Derix states (2010, p. 64), when black box tools are developed for others to deploy, “the designer is side-lined into a seed-watch-evaluate role who feels their intentions and heuristics are not participating in the search”.
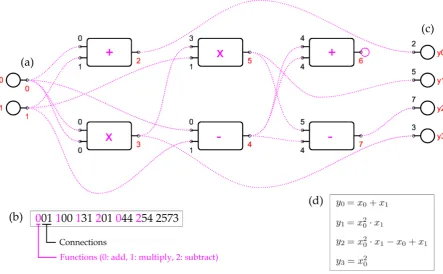
Figure 6. A simple Cartesian Genetic Programming example. An integer-string genotype encodes a DAG that produces a set of equations.
3. Meta-parametric design
In response to both the inflexibility of explicit modelling tools and the irreducibility of an implicit approach, the possibility of automatically generating parametric models is an interesting alternative (Harding et al., 2013). Although Gero and Kumar (1993) have previously shown methods to widen the design space using re-parameterisation, this approach goes one step further in order to think topologically (DeLanda, 2002) and consider the whole structure of a parametric definition.
3.1 DAG generation
As well as GP using tree structures (Koza, 1994), the automatic generation of DAGs has also been of research interest due to their close relationship to computer algorithms, particularly their application in work scheduling problems (Van Leeuwen, 1991). Cartesian Genetic Programming (CGP) (Miller and Thomson, 2000) is a more recent approach that generates explicit DAGs very similar to that used in parametric design, using an integer genotype encoding. Partly due to its explicit embryogeny, CGP has been successfully used in a wide variety of applications in combination with evolutionary algorithms (Millar, 2003).
An example of a CGP system is given in Figure 6. Initial parameters in the graph are tagged sequentially (a). Each node in the graph is a function with inputs and outputs. When a new node is added, the encoding method (b) defines the specific function from a pick-list and to which outputs in the graph the node inputs are connected. The outputs of this new node are then tagged, and the next node is added. This process continues until the genotype is exhausted. In this example, terminating nodes (c) are also defined so that the graph defines a further phenotype, in this case set of equations (d).
There is an obvious similarity to a CGP system and DAG-based parametric modelling. The functions in a CGP can be replaced with components in a parametric schema, and the terminating nodes are not required. The next section describes the process of applying CGP as a software plug-in to Rhino Grasshopper.
3.2 Embryo plug-in for Grasshopper
Embryo is the name given to a software plug-in to Grasshopper written by the first author that applies a form of CGP to parametric models (Harding, 2014). It was chosen to develop a tool that would work within an existing parametric environment, so that automatically generated DAGs could work alongside those created manually.
In general, Grasshopper model generation can be split into three parts: external parameters (for example numeric sliders, external geometry, etc.), the components in the graph and the topological structure that associates components. These three parts form the basis of the genotype used by Embryo when constructing a parametric model:
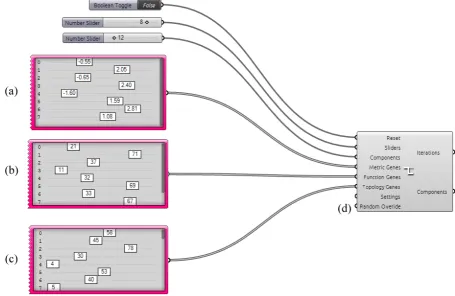
a) Metric genes: control the parameter values for generated sliders and have a direct numerical mapping. These can be either integer or floating point values. These metric parameters are the first objects generated by Embryo.
b) Function genes: when a component is added to the graph, the function genes control the type of component selected from a given pool.
Figure 7. The Embryo component and input parameters
Figure 7 shows how these three sets of genes (a, b and c) are connected to the main Embryo component that generates the parametric model. The user also specifies the number of sliders and components to be used. There exists a random override input (d), which if used generates a random genotype that replaces any existing genes. This feature can be useful in giving an overall feel for the design space.
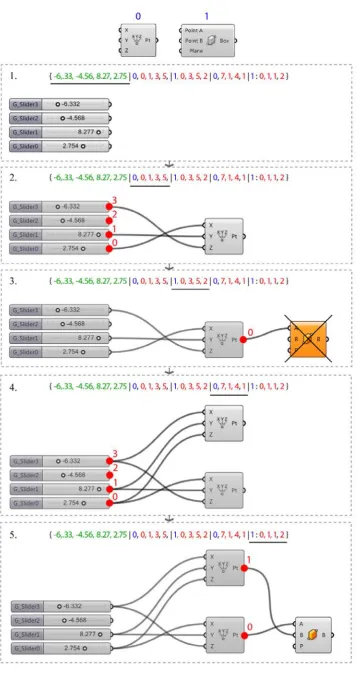
Figure 8 gives a simple example of the genotype-phenotype mapping using two component types. The process is split into five stages. At Stage 1, the first four values of the genotype are interpreted as slider values (green) and placed on the canvas. Stages 2-5 then involve the sequential placing and connecting of components. For each component placed, the function genes (blue) specify the type and topology genes (red) govern the connections for each input. Note that the number of topology genes per component (by default set to length 4) is constant regardless of the number of inputs the component has. Although requiring a larger genotype, this ensures that should a component be replaced (e.g. a single mutation of the genotype), the effects of having a different number of inputs does not cascade to all subsequent components. These
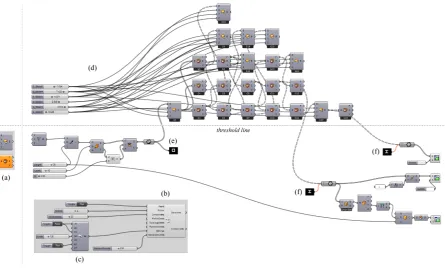
When a component is added, each of its input nodes is connected backwards to an output of a compatible datatype. This is achieved by forming a sublist of valid outputs before connecting using the topological genes; for example if the input Grasshopper datatype is a Number, then the sublist may contain Integers but it cannot contain Points. If the topological gene value is higher than length of the sublist, then modular arithmetic is used. For example at Stage 4 in the example, the first input of the new component is 7, but as there are only 4 suitable inputs available, 7 (mod 4) = 3. Components for which it is not possible to connect an input are removed. At Stage 3, the orange component has failed and is removed because it requires two inputs of Point datatype, but only one is available in the entire graph. However, a similar box component is added later at Stage 5 when two points are available. After each component is added, its outputs become available for connection at the next iteration. A typical Embryo set-up in Grasshopper is shown in Figure 9. The designer specifies the components to be included (a) and the Embryo component is located on the main canvas (b). Settings can be adjusted (c) such as display parameters, whether multiple edges can connect to outputs, geometry preview, displaying failed components, etc. The new graph is then automatically generated above the main Grasshopper canvas area (d). This can include tagged output parameters from an existing model on the main canvas (e). Data can be retrieved from the generated graph and connected to tagged inputs of an existing model (f). Having such a connection to manually created parametric elements helps facilitate working between different levels of abstraction (parametric and meta-parametric) within the same Grasshopper file.
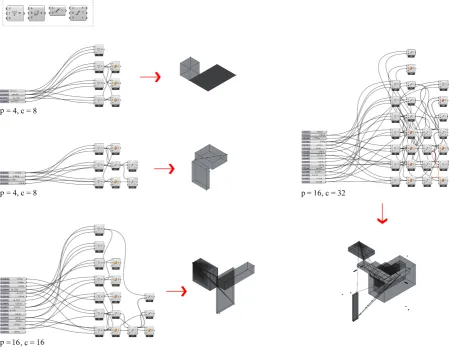
Figure 10. Examples of simple parametric models generated by Embryo with four component types: Cartesian point, line by points, divide curve and box by points.
Some examples of simple graphs and associated designs generated by Embryo are shown in Figure 10, where ‘s’ represents the number of sliders and ‘c’ the number of components.
3.3 Comparison to shape grammars
In effect, Embryo turns Grasshopper into a shape grammar system for exploring combinatorial problems (Stiny and Mitchell, 1978). At present, the variety of components in models generated by humans is at present difficult to achieve and the examples thus far involve relatively simple geometric components and a limitation of one input per parameter. In this sense, meta-parametric modelling could benefit from predefined heuristics or perhaps a form of machine learning over time in terms of successful component combinations, much like humans do in order to increase model complexity.
such as Grasshopper, testing different component combinations is relatively straightforward. CGP has also been shown to reduce the problem of bloat in comparison to tree-based GP (Millar, 2001), although a cap on calculation time would be a useful addition to Embryo. The fact that unsuccessful components are removed from the canvas sequentially (see Figure 8) also helps reduce the chance of errors trickling through the model. In combination with an appropriate metaheuristic, design spaces involving non-computable parametric models can be better avoided during design exploration.
3.4 Combining with metaheuristics
[image:13.595.74.525.414.680.2]The genotype can be easily combined with a metaheuristic algorithm within the Grasshopper environment, for example by using the Galapagos evolutionary solver (Rutten, 2013). An example of such a setup is given in Figure 11 in solving a combinatorial problem, in this case finding a combination of operators (a) that will manipulate six integers to reach a target number. Embryo (b) constructs a graph from gene pools (c), noting that no new sliders are generated, rather existing numbers are tagged (d). The graph is generated (e) and distance from the target number measured (f) which is minimised by Galapagos (g) by altering the gene pools. Essentially, a meta-parametric model is constructed that optimises a parametric model.
Such a fitness function can be defined by recovering not just numbers but geometry generated by Embryo to the main canvas and measuring its performance within Grasshopper (see Section 4.1). Such evolutionary methods using CGP have found that crossover can have a limited effect and hence often rely on mutation alone (Clegg et al., 2007).
As an explicit embryogeny is used, the genotype is mapped directly onto the topological structure of the graph, as opposed to an implicit method with low-level rules. Although a larger genotype is required, this mapping leads to a closer mapping between the genotype and phenotype than with an implicit approach, assisting with evolvability by reducing discontinuity in the search space (Kumar and Bentley, 2000). 3.5 DAG Cognition
[image:14.595.74.523.385.653.2]One advantage of machine generated models is the potential to maintain a consistent structure. In this regard, Embryo generates a DAG that is already topologically sorted into a dependency hierarchy which can assist human understanding post-creation (Figure 12). In addition, tools that step through the graph, previewing each stage of development are included within Embryo.
Although the generated parametric models have the potential to be legible, this varies depending on the situation. For larger graphs there is still the potential ‘spaghetti problem’ (see Section 1.2) with many crossing edges, requiring effort on the part of the user to understand. Ways to counter this range from including graph legibility during the design search itself (see Section 4.1) to providing a method for automatically untangling the graph (Section 5.1).
Embryo can also be used if the legibility is sacrificed to explore more complex models, for example the model shown in Figure 13 which to generate manually would be practically impossible. This potentially extends the capability of tools like Grasshopper in a new direction albeit, one where understanding the model is highly compromised.
4. Implementation
Two real projects are shown here as examples of Embryo being used in different design contexts in practice. Firstly to generate massing concepts for a residential development. Secondly, for a mixed-use tower project whereby parametric models are evolved to match an existing geometric concept design using shape analysis.
4.1 Enhancing design exploration
In collaboration with 3dReid architects and Ramboll engineers, Embryo was used during the concept design stage of a high-density residential project in Tower Hamlets, London. A series of initial design team meetings were held in order to set out the parameters and constraints for the project. This included writing bespoke components based on the project requirements, such as apartment width for single and double aspect accommodation, and high-level bridge links between adjacent buildings to improve connectivity.
Parametric models were initially created using randomly generated genotypes, three examples of which are shown in Figure 14. In almost all cases, bloat was not an issue and models were able to be computed without error. The building performance of each generated design was assessed in real-time within Grasshopper, including daylight assessment, internal floor area, spatial connectivity, building heat loss and views to key London landmarks. This was achieved using a special Embryo component that collects geometry from the generated model (shown * in Figure 15), acting in a similar way to a tagged parameter input on the main canvas (see Section 3.2).
Figure 14. Parametric massing models generated by Embryo for the Tower Hamlets project.
[image:17.595.73.526.416.730.2]to progress. Their influence affected less components and hence the consequences of adjustment were easier for the team to understand.
Embryo was used to generate and analyse novel design ideas that may have otherwise remained unexplored running alongside using more traditional methods such as sketching and physical massing models. Approximately 60 Embryo generated models of a wide variety were used to benchmark the performance (both quantitative and qualitative) of designs created using more traditional methods within the practice. Here, automation made it possible to quickly generate many alternatives for comparison. It was felt however that more work needs to be done on this interface between physical and digital modes of representation, for example 3d printing some of the Embryo massing models would have meant working in both directions in terms of comparing design methods.
Although Embryo was a useful addition to the project, the use of random genotypes in this particular application made design exploration somewhat undirected and disjointed. The use of evolutionary methods on a similar project would be interesting to revisit in the future, in particular incorporating an interactive evolutionary algorithm using artificial selection.
4.2 DAG evolution
Another interesting application is in the creation of parametric definitions for existing CAD geometry. This includes searching for alternative definitions for geometry generated by an existing process (see Section 1.3). Figure 16 shows an example on a mixed-used tower project in collaboration with Danish architects AG5 and Ramboll Engineers in London. An existing concept design made in Grasshopper was used as a target for evolving a machine generated alternative using the Galapagos evolutionary solver (a).
As with the example in the previous section, by retrieving the geometry from the generated model to the main canvas, analysis could be performed within Grasshopper. An objective function was set using vertex matching techniques found in shape analysis (Costa, 2000). Removing crossover and relying on mutation alone was found to generate the best results, something in keeping with similar studies using CGP due to the nature of the encoding (Clegg et al., 2007).
genotypes can lead to similar traits in organisms. A well-known example of this is the independent evolutionary development of the camera eye by both vertebrates and octopuses.
Although promising for simple massing forms, further research on the potential for evolving parametric models for more complex problems is required and the method is not without issue. For example, whilst understanding the new model construction was possible, there was a disconnection in terms of ascribing meaning to the parameters; especially those that controlled many different geometric operations. As in Section 4.1, rather than reducing models to as few parameters as possible, models with more parameters proved to be more useful going forward (Harding, 2014). Clearly more empirical work is required here in terms of understanding model legibility when created by machines, although it is clear that reducing analysis of legibility to the complexity of the graph alone is not sufficient.
5. Conclusion
This paper began by highlighting two main approaches to form generation in computational design, explicit and implicit. The authors argued that an implicit approach, though giving the wide design exploration suitable for the concept stage, has a lack of structure that has often proven to be useful in parametric design. Such methods are therefore difficult to use in a collaborative design environment, where a common language is required for communication between humans and machines. DAG-based parametric models however struggle with topological inflexibility. By allowing them to be automatically generated, this offers a new opportunity for a greater number of parametric definitions to be implemented at concept design stage, where wide design exploration is required. The process of creating parametric models thus becomes similar to sketching and making physical models, but with the added benefits of having a digital presence, i.e. for quantitative measurement or performance analysis.
We call this approach Meta-Parametric Design, and argue it is well equipped to deal with the wicked nature of the concept design stage with unknown constraints and goals. Initial tests on real projects have been positive, although there is much work to be done to understand the potential use of this method and its applications. We believe that this work can inspire the application of genetic programming into the wider computational design community.
5.1 Future work
• Incorporating self-similar structures as part of the DAG encoding (Boers and Sprinkhuizen-Kuyper, 2001), similar to those used with CPPN methods (Clune and Lipson, 2011). This would help to reduce the size of the genotype for more complicated graphs. Grasshopper now includes modular ‘clusters’ (parametric definitions grouped into one single component) that could be useful for this development.
• More work on the legibility of parametric models generated by the machine. Algorithms exist in graph theory, such as reducing the amount of overlapping edges (Verbitsky, 2008) but to the author’s knowledge are yet to be implemented in parametric design.
• Additional study is required in light of the findings in Section 4, namely the preference for models with more parameters not less. Clearly the intelligibility of parametric models cannot be based on graph complexity alone.
• Combining Embryo with interactive evolutionary algorithms that use artificial selection. This would enable qualitative criteria to be better accommodated during design exploration.
• Investigate effective methods for genotype crossover within CGP (Clegg et al., 2007).
• Expansion on the work shown in Section 4.2 whereby parametric definitions are evolved that open up new avenues of design development and negate the problem of parametric ‘lock-in’. The use of Embryo on more case-study projects will help understand both its potential and limitations.
• Integrate a mixture of explicit and implicit approaches. Singh and Gu (2012) have shown the benefits of a mixture of digital design methods for divergent thinking at the early stage, and Grasshopper for example includes components for imperative programming.
5.2 Summary
Architectural design is becoming increasingly obsessed with combining all elements of performative design into a single quantitative tool to be used as early as possible on projects. In this age of increasing computing power, it is easy to forget that how we approach modelling as design teams has just as important role to play as real-time performance analysis tools.
Acknowledgements
This work has been supported in part by Ramboll UK and the EPSRC funded Industrial Doctorate Centre in Systems at The University of Bath (Grant EP/G037353/1). The authors would like to thank both 3DReid and AG5 Architects for adopting the Embryo software plug-in during live projects, with particular mention to Charlie Whitaker, Brian Sheldon and Daniel Nielsen.
References
Aish, R., and Woodbury, R. (2005). Multi-level interaction in parametric design. In:
Smart Graphics, Springer Berlin Heidelberg, 151-162.
Bentley, P., and Kumar, S. (1999). Three ways to grow designs: A comparison of evolved embryogenies for a design problem. In: Genetic and Evolutionary Computation Conference, 35-43.
Bentley, P. J., and Wakefield, J. P. (1998). Generic evolutionary design. In: Soft Computing in Engineering Design and Manufacturing, Springer London, 289-298.
Boers, J. and Sprinkhuizen-Kuyper, G. (2001). Combined biological metaphors. In: M. Patel, V. Honavar and K. Balakrishnan (Eds.) Advances in the Evolutionary Synthesis of Intelligent Agents, MIT Press, Cambridge, MA, 153-183.
Clegg, J.; Walker, J. A. and Miller, J. F. (2007). A new crossover technique for Cartesian genetic programming. In: Proceedings of the 9th annual conference on Genetic and evolutionary computation, 1580-1587.
Clune, J. and Lipson, H. (2011). Evolving 3d objects with a generative encoding inspired by developmental biology. ACM SIGEVOlution, ACM, 5, 2-12.
Coates, P., Healy, N., Lamb, C., and Voon, W. L. (1996). The use of cellular automata to explore bottom up architectonic rules. In: Eurographics UK Chapter 14th Annual Conference, 26-28.
Coates, P., Broughton, T., and Jackson, H. (1999). Exploring three-dimensional design worlds using Lindenmayer systems and genetic programming. Evolutionary design by computers, 323-341.
Coates, P. (2010). Programming architecture. Routledge.
Costa, L., and Cesar Jr, R. M. (2000). Shape analysis and classification: theory and practice. CRC press.
DeLanda, M. (2002). Deleuze and the Use of the Genetic Algorithm in Architecture. Architectural Design, 71(7), 9-12.
Derix, C. (2008). Genetically Modified Spaces. In: Littlefield, D. (Ed.), Space Craft - Developments In Architectural Computing, RIBA Publishing, 22-26.
Derix, C. (2010). Mediating spatial phenomena through computational heuristics. In
Proceedings of the 30th Annual Conference of the Association for Computer Aided Design in Architecture, ACADIA, New York, 21–24 October 2010, 61–66.
Eastman, C. (2009). Automated assessment of early concept designs. Architectural Design, 79(2), 52-57.
Ercan, B., and Elias-Ozkan, S. T. (2015). Performance-based parametric design explorations: A method for generating appropriate building components. Design Studies, 38, 33-53.
Frazer, J. (1995). An evolutionary architecture. Architectural Association Publications. Gero, J. S. and Kumar, B. (1993). Expanding design spaces through new design variables. Design Studies, Elsevier, 14, 210-221.
Harding, J., Joyce, S., Shepherd, P. and Williams, C. (2013). Thinking Topologically at Early Stage Parametric Design. Advances in Architectural Geometry 2012, Springer, 67-76.
Harding, J. (2014). Meta-Parametric Design: Developing a Computational Approach for Early Stage Collaborative Practice. EngD thesis, The University of Bath.
Hernandez, C. R. B. (2006). Thinking parametric design: introducing parametric Gaudi, Design Studies, 27, 309-324.
Holzer, D., Hough, R., and Burry, M. (2007). Parametric design and structural optimisation for early design exploration. International Journal of Architectural Computing, 5(4), 625-643.
Hudson, R., Shepherd, P., and Hines, D. (2011). Aviva Stadium: A case study in integrated parametric design. International Journal of Architectural Computing, 9(2), 187-204.
Kowaliw, T. (2007). A good number of forms fairly beautiful: an exploration of biologically-inspired automated design. PhD thesis, Concordia University.
Liggett, R. S. (2000). Automated facilities layout: past, present and future. Automation in Construction, 9(2), 197-215.
Menges, A. (2012). Biomimetic design processes in architecture: morphogenetic and evolutionary computational design. Bioinspiration and biomimetics, 7(1).
Miller, J. F., and Thomson, P. (2000). Cartesian genetic programming. In: Genetic Programming, Springer Berlin Heidelberg, 121-132.
Miller, J. (2001). What bloat? cartesian genetic programming on boolean problems. In: 2001 Genetic and Evolutionary Computation Conference Late Breaking Papers, 295-302. Miller, J. F., and Thomson, P. (2003). A developmental method for growing graphs and circuits. In: Evolvable Systems: From Biology to Hardware, Springer Berlin Heidelberg,
93-104.
Moussavi, F. (2011). Parametric software is no substitute for parametric thinking. The Architectural Review.
Oxman, R. (2006). Theory and design in the first digital age. Design Studies, 27, 229-265.
Oxman, R. and Gu, N. (2015). Theories and models of parametric design thinking. In:
Proceedings of the 33rd eCAADe Conference, Vienna, 2015.
Rutten, D. (2013). Galapagos: On the Logic and Limitations of Generic Solvers.
Architectural Design, 83(2), 132-135.
Shea, K., Aish, R., and Gourtovaia, M. (2005). Towards integrated performance-driven generative design tools. Automation in Construction, 14(2), 253-264.
Singh, V., and Gu, N. (2012). Towards an integrated generative design framework.
Design Studies, 33(2), 185-207.
Steadman, P. (2008). The Evolution of Designs: Biological analogy in architecture and the applied arts. Routledge.
Stiny, G., and Mitchell, W. J. (1978). The palladian grammar. Environment and Planning B, 5(1), 5-18.
Strogatz, S. H. (2001). Nonlinear dynamics and chaos: with applications to physics, biology and chemistry. Perseus publishing.
Van Leeuwen, J. (1991). Graph algorithms, Handbook of theoretical computer science (vol. A): algorithms and complexity. MIT Press, Cambridge, MA.
Verbitsky, O. (2008). On the obfuscation complexity of planar graphs. Theoretical Computer Science, Elsevier, 396, 294-300.
Weinstock, M. (2010). The architecture of emergence: the evolution of form in nature and civilisation. Wiley London/Chichester.