Conference Paper
Oxidation State of a Polyurethane Membrane after
Plasma Etching
Matthew D. Moles,
1Colin A. Scotchford,
2and Alastair Campbell Ritchie
21Division of Electrical Systems and Optics, Faculty of Engineering, University of Nottingham, University Park,
Nottingham NG7 2RD, UK
2Division of Materials, Mechanics and Structures, Faculty of Engineering, University of Nottingham, University Park,
Nottingham NG7 2RD, UK
Correspondence should be addressed to Matthew D. Moles; [email protected]
Received 22 November 2013; Accepted 24 February 2014; Published 8 April 2014
Academic Editors: A. Baykal and J. Gough
This Conference Paper is based on a presentation given by Matthew D. Moles at “UK Society for Biomaterials Annual Conference 2013” held from 24 June 2013 to 25 June 2013 in Birmingham, United Kingdom.
Copyright © 2014 Matthew D. Moles et al. This is an open access article distributed under the Creative Commons Attribution License, which permits unrestricted use, distribution, and reproduction in any medium, provided the original work is properly cited.
Low moduli cell culture substrates can be used to apply dynamic mechanical strain to cells, by surface deformation. Understanding the surface interaction with cells is critical to improving cell adhesion and normal growth. A medical grade polyurethane (PU), Chronoflex AL 80A, was modified by oxygen plasma etching and characterised by X-ray photoelectron spectroscopy. Etching resulted in increased cross-linking at the isocyanate bond and formation of new oxygen moieties. The model, derived from patent data and XPS data of the unetched PU, indicated that the additional oxygen was likely to be hydroxyl and carbonyl groups. Etched membranes enhanced protein adhesion, resulting in full surface coverage compared to unetched PU. The etched PU supported cell adhesion and spreading, while the unetched PU was not conducive to monolayer formation.
1. Introduction
The human body comprises tissues with a range of elastic moduli. Improving the response ofin vitrocell- and tissue-based investigations can be achieved by culturing cells upon a substrate with a modulus closer to that of living tissue, as opposed to tissue culture polystyrene that has a modulus an order of magnitude greater than smooth muscle, for exam-ple, [1]. In addition, dynamic modulation of the substrate can provide mechanical signals that drive differentiation or proliferation.
Previously, a stable biocompatible polyurethane (PU), Chronoflex AL 80A (AdvanSource Biomaterials, Wilming-ton, MA), was tested as a low modulus candidate substrate for a bioreactor capable of subjecting cells to a dynamic mechanical environment [2]. PU was selected as it is more resilient [3] and has a better cell response than similar polymers [4]. It was shown that plasma etching is a key factor
to the success of cell adhesion and normal cell growth: the wettability was found to be dependent on etching power and duration, while roughness was more affected by the duration [2]. Therefore the state of oxidation of the PU membrane has been examined, in order to understand the effects of plasma etching on protein and cell adhesion.
2. Method
2.1. Membrane Manufacture and Modification. PU mem-branes were produced as described previously [2]. In brief, polyurethane membranes of thickness200 ± 10 𝜇m (mean± standard deviation (SD)) were formed by solvent casting with tetrahydrofuran (10% w/w) and drying in a vacuum oven at 50∘C. Surface modification was carried out by etching using an inductively coupled RF-source (13.56 MHz) plasma barrel etcher (Biorad PT7100). The sample chamber was evacuated to 8 Pa, purged with oxygen (grade 2 nitrogen free, BOC,
Surrey, UK), and the pressure was maintained at 20 Pa for 5 min. Samples were then exposed to plasma for 40 s or 80 s at powers of 20–180 W.
2.2. X-Ray Photoelectron Spectroscopy. X-ray photoelectron spectroscopy (XPS) spectra of PU membrane samples were recorded using an Axis Ultra (Kratos Analytical, Kyoto, Japan) with monochromated Al 𝐾𝛼 (1486.6 eV) radiation source with a pass energy of 80 eV for survey spectra and 20 eV for high resolution spectra; the step size was 0.1 eV. The takeoff and acceptance angles were 90∘and 30∘, respectively. Two PU membrane samples (⌀ 11 mm) were taken from separate batches; three areas (700 × 300 𝜇m) per sample were analysed. By modelling peak envelopes on the spectral data, the relative abundance of each chemical environment may be quantified. Data was interpreted using CasaXPS v2.3.1.6 with the Kratos relative sensitivity factor library. Charge correction was carried out by shifting data relative to the C 1 s peak (285.0 eV). Peak and component (30% Gaussian-Lorentz distribution) fitting was carried out with a Tougaard background; data smoothing was not applied. Full width half magnitude (FWHM) was constrained to 0.8–1.3 eV for C 1 s, N 1 s and Si 2p, and 1.5–1.8 eV for O 1s; peaks with a higher binding energy have greater interference and so have a larger FWHM [5].
2.3. Protein Adsorption. Unetched and etched (20 W 40 s) membranes (⌀ 11 mm) were incubated (37∘C, 5% CO2) in 48-well TCPS multiplates for periods of 2 and 5 days with Dulbecco’s Modified Eagle Medium (DMEM) with 10% foetal bovine serum (Fisher Scientific, UK). A control sample was incubated with deionised water. Samples were dried in a nitrogen gas stream after incubation, prior to loading in the XPS analyser.
2.4. Cell Culture. Osteosarcoma MG-63 cells (European Collection of Cell Cultures) were cultured in a humidified 37∘C, 5% CO2 incubator, with culture medium composed of DMEM supplemented with 10% FBS (Fisher Scientific, UK), 1% 200 mM L-glutamine, 5% antibiotics-antimycotics, 5% 1 M HEPES, 1% MEM nonessential amino acids, and 0.15 mg⋅mL−1L-ascorbic acid. Passage 25 cells were harvested with 0.25% trypsin-EDTA and seeded at 20,000 cells⋅cm−3. Medium and reagents were purchased from Fisher Scientific, UK.
3. Results
3.1. XPS
3.1.1. Survey Data. Spectral peaks that correspond to carbon (C 1 s), oxygen (O 1 s), nitrogen (N 1 s), and silicon (Si 2p) were present in the survey spectra of all samples. The surface atomic composition, excluding hydrogen (as it is not detected by XPS), was calculated from the relative peak areas of the XPS spectra, and the values are listed inTable 1. The error for some species (e.g., maximum SD of O 1 s was±2.4) was increased by a slight batch variation that may arise due to operator error in plasma power or duration control; however,
within these batches the error margin is relatively small (e.g., for O 1s, the maximum and minimum SD for the 2 tested batches were±0.72/±0.20 at.% and±0.72/±0.05 at.%, resp.). The high variation of the oxygen of the unetched control membrane (±2.2 at.%) demonstrates that localised variance exists after manufacture, prior to further surface treatment.
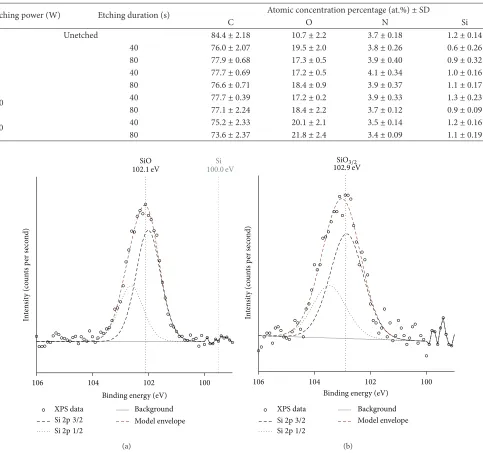
3.1.2. Silicon. Silicon was not part of the material specifica-tion; therefore it is suggested that the source of contamination was silicone oils used in the moulding of the PU pellets and/or packaging extrusion. The high resolution silicon peak of the unetched PU is shown inFigure 1. In all the unetched samples the silicon peak was present at approximately 102.2 eV ± 0.1 eV, which indicates that the silicon was not elemental (99-100 eV [6]) nor was it silicon dioxide, which is known to undergo a chemical shift to approximately 103-104 eV [6,7]. The chemical shift suggests that it was a siloxane bond [6,8], which is indicative of a silicone based organic molecule.
In the case of the etched (20 and 50 W) samples, the Si 2p peak undergoes chemical shift to approximately 102.9 eV, with 1/2 and 3/2 spin states at 102.8 eV and 103.5 eV, respectively. This indicates that oxygen has been added, to form SiO𝑥, where1.8 < 𝑥 < 2. According to the literature [8–12], as the peak maximum was at 102.8 eV the oxidation state is most likely Si III. In addition, the +3 oxidation state is likely to be as a result of coordination with 3 oxygen atoms and 1 carbon atom ((CH3) SiO3/2) [8,12]. After etching at 100 or 180 W, the Si 2p peak was shifted to 103.2–103.5 eV, which is cha-racteristic of SiO2 [9–12]. As Si contributes a significant quantity of oxygen (ca.10%), it was included in the model.
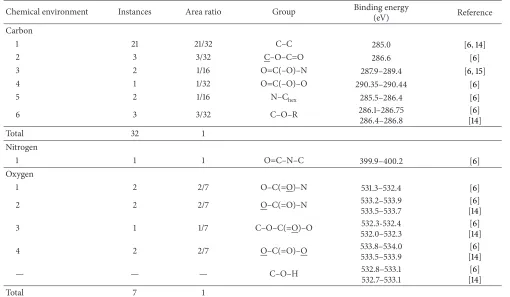
3.1.3. Model and High Resolution XPS Data. A possible molecular structure for Chronoflex, shown inFigure 2, was deduced using data published in the manufacturers patent [13]. It was known that the composition was aliphatic; there-fore the networking components were most likely 4,4 -dicy-clohexylmethane diisocyanate (HMDI) with 1,4-butanediol (1,4-BDO), which are shown linked inFigure 2(b). Given the composition of aliphatic polycarbonates available at the time of the PU invention and based on the patent data, the soft matrix was most likely hexanediol-carbonate glycol (Figure 2(a)). In addition, the ratio of carbonate to diisocyanate to extender was likely to be 2 : 2 : 1 [13]. From this information a table of chemical groups (Table 2), along with the number of chemical environments for C, N, and O, has been compiled.
Table 1: Atomic composition for unetched and etched PU membrane surface as determined by XPS. Data shows mean for 3 scans per sample,
𝑛 = 2.
Etching power (W) Etching duration (s) Atomic concentration percentage (at.%)±SD
C O N Si
Unetched 84.4 ± 2.18 10.7 ± 2.2 3.7 ± 0.18 1.2 ± 0.14
20 40 76.0 ± 2.07 19.5 ± 2.0 3.8 ± 0.26 0.6 ± 0.26
80 77.9 ± 0.68 17.3 ± 0.5 3.9 ± 0.40 0.9 ± 0.32
50 40 77.7 ± 0.69 17.2 ± 0.5 4.1 ± 0.34 1.0 ± 0.16
80 76.6 ± 0.71 18.4 ± 0.9 3.9 ± 0.37 1.1 ± 0.17
100 40 77.7 ± 0.39 17.2 ± 0.2 3.9 ± 0.33 1.3 ± 0.23
80 77.1 ± 2.24 18.4 ± 2.2 3.7 ± 0.12 0.9 ± 0.09
180 40 75.2 ± 2.33 20.1 ± 2.1 3.5 ± 0.14 1.2 ± 0.16
80 73.6 ± 2.37 21.8 ± 2.4 3.4 ± 0.09 1.1 ± 0.19
100
102 104
106
In
te
n
si
ty (co
u
n
ts p
er s
eco
nd)
SiO Si
102.1eV 100.0eV
Binding energy (eV)
Background
Model envelope XPS data
Si2p3/2 Si2p1/2
(a)
In
te
n
si
ty (co
u
n
ts p
er s
eco
nd)
102.9eV
SiO3/2
100
102 104
106
Binding energy (eV)
Background
Model envelope XPS data
Si2p3/2 Si2p1/2
(b)
Figure 1: High resolution XPS spectra of the silicon region. (a) Unetched PU membrane; (b) PU membrane etched at 20 W 40 s.
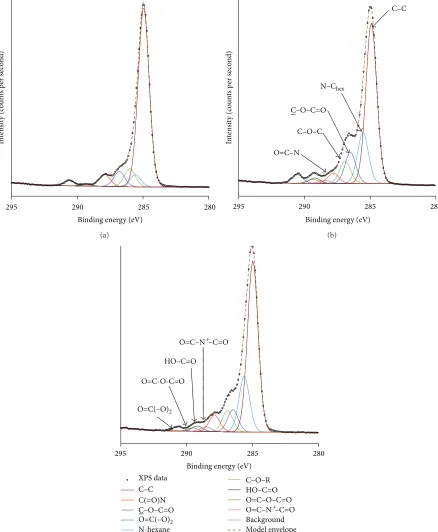
a complete fit when applied to the etched sample, indicating significant changes to the chemical structure. A hydroxyl component, assigned to 286.4–286.7 eV [6], did not complete the model. However, a hydroxyl adjacent to a carbonyl (289.2-289.3 eV [6]) would account for the pronounced (289.2-289.3 eV shoulder (Figures3(b)and3(c)).
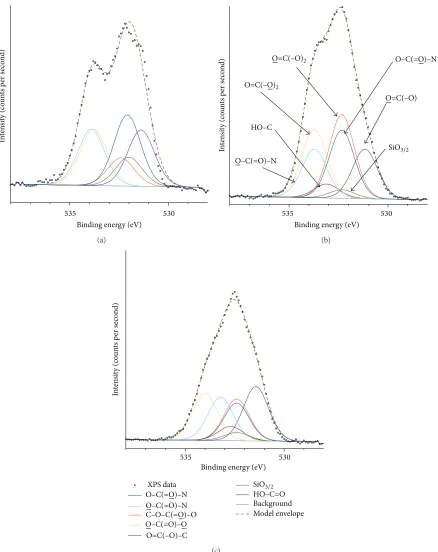
The unetched O 1 s peak was fitted with a four-component model (Table 2), along with components for siloxane and an additional carboxyl peak (532.1 eV) (Figure 4(a)). The model for etched samples (Figures4(b)and4(c)) required further modification: there was a high possibility of hydroxylation occurring during oxidative plasma etching, and hydroxyls are known to form on oxide coatings [16]. Addition of a
[image:3.600.61.544.95.548.2]C C OH O
O O
C C
HO
3
4 4
2
4
6
6 1 1
H2
H2
H2 H2
(CH3)4 (CH3)4
2
(a)
C HN C HN
O
HO C
O
C C OH
1
O
1
2
1 1
1
1 1
1
3 3
5 5 2 6
1 1 1 1 1 1
H2 H2 H2
(CH3)2
1 1
[image:4.600.102.501.71.247.2](b)
Figure 2: Model molecular structure of Chronoflex AL: (a) polycarbonate matrix component and (b) aliphatic hard segment composed of HMDI and 1,4 butanediol. The chemical environments of the soft (a) and hard (b) segments: carbon (red), nitrogen (green), and oxygen (blue).
Table 2: Chemical groups and environments present in the derived structure of Chronoflex PU. The underscored atom shown in the group column is the contributing chemical environment of that row.
Chemical environment Instances Area ratio Group Binding energy
(eV) Reference
Carbon
1 21 21/32 C–C 285.0 [6,14]
2 3 3/32 C–O–C=O 286.6 [6]
3 2 1/16 O=C(–O)–N 287.9–289.4 [6,15]
4 1 1/32 O=C(–O)–O 290.35–290.44 [6]
5 2 1/16 N–Chex 285.5–286.4 [6]
6 3 3/32 C–O–R 286.1–286.75
286.4–286.8
[6]
[14]
Total 32 1
Nitrogen
1 1 1 O=C–N–C 399.9–400.2 [6]
Oxygen
1 2 2/7 O–C(=O)–N 531.3–532.4 [6]
2 2 2/7 O–C(=O)–N 533.2–533.9
533.5–533.7
[6]
[14]
3 1 1/7 C–O–C(=O)–O 532.3-532.4
532.0–532.3
[6]
[14]
4 2 2/7 O–C(=O)–O 533.8–534.0
533.5–533.9
[6]
[14]
— — — C–O–H 532.8–533.1
532.7–533.1
[6]
[14]
Total 7 1
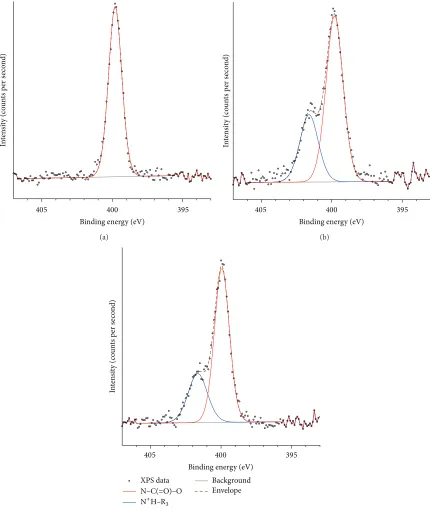
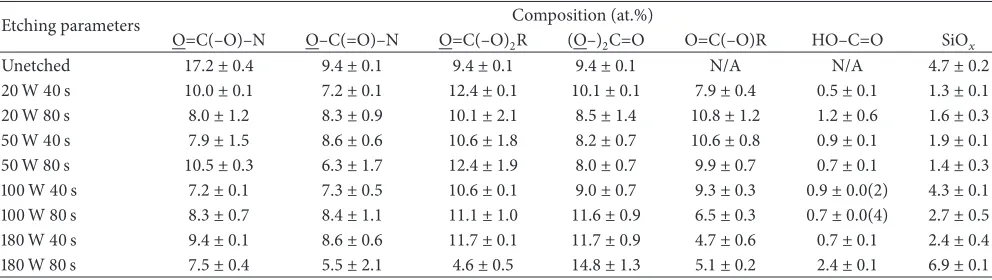
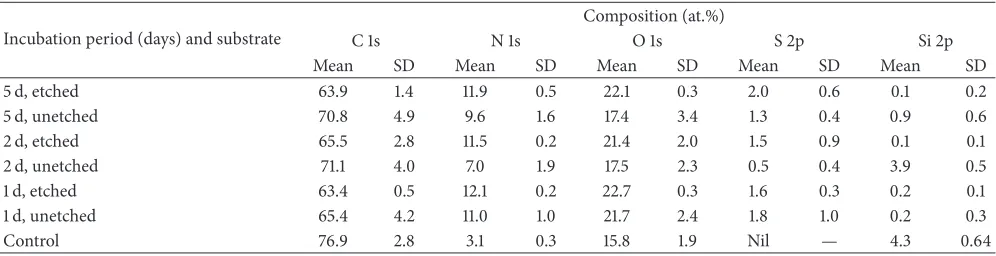
The N 1 s peak of the unetched sample consisted of a single component (399.9 eV); the binding energy was similar to isocyanate bonds reported for other polymers [6]. After plasma etching, the N 1s peak was resolved into 2 distinct components at 399.9 eV and 401.6 eV, which contributed 70 at.% and 30 at.%, respectively, to the nitrogen peak (Figure 5). The component at 401.6 eV was most likely due to formation
of ammonium ions by cross-linking [6]. It was unlikely that oxidation occurred at the nitrogen position, as that would incur a much higher chemical shift (e.g., NO2isca.+5.0 eV from 399.9 eV) [6].
[image:4.600.47.557.331.628.2]295 290 285 280
In
te
n
si
ty (co
u
n
ts p
er s
eco
nd)
Binding energy (eV)
(a)
In
te
n
si
ty (co
u
n
ts p
er s
eco
nd)
295 290 285 280
Binding energy (eV)
C–C
O=C–N
C–O–C C–O–C=O
N–Chex
(b)
HO–C=O
O=C(–O)2
O=C(–O)2
O=C–N+–C=O
O=C–N+–C=O
O=C-O-C=O
Background
Model envelope
C–C
C(=O)N
N-hexane
C–O–R
XPS data
HO–C=O
O=C–O–C=O C–O–C=O
295 290 285 280
Binding energy (eV)
[image:5.600.80.518.74.606.2](c)
Figure 3: High resolution spectrum for C 1 s unetched membrane (a) and membranes etched at (b) 20 W 40 s and (c) 20 W 80 s.
oxygen, nitrogen, silicon, sulphur, sodium, and chlorine. A control sample was preincubated with sterile DI water; sulphur and buffer salts were undetected (Table 4).
The silicon signal was stronger on unetched PU incubated for 2 days and reduced but still present after 5 days (Figure 6, Table 4). The Si 2p peak was as strong as on nonincubated
samples and was a singlet with components at 102.2 eV (Si II) and 102.8 eV (Si III). In each scanned area, sulphur was detected regardless of whether or not the silicon signal was present (Table 4), as shown inFigure 6.
535 530
In
te
n
si
ty (co
u
n
ts p
er s
eco
nd)
Binding energy (eV)
(a)
O=C(–O)
HO–C
SiO3/2
O–C(=O)–N
O–C(=O)–N
O=C(–O)2
O=C(–O)2
535 530
Binding energy (eV)
In
te
n
si
ty (co
u
n
ts p
er s
eco
nd)
(b)
535 530
In
te
n
si
ty (co
u
n
ts p
er s
eco
nd)
Binding energy (eV)
O=C(–O)–C
Background
Model envelope
XPS data
HO–C=O
SiO3/2
O–C(=O)–N
O–C(=O)–N
O–C(=O)–O C–O–C(=O)–O
[image:6.600.82.520.68.620.2](c)
Figure 4: High resolution XPS spectrum of the O 1 s peak for PU: (a) unetched and etched at 20 W for (b) 40 s and (c) 80 s.
of incubation (Figure 7,Table 4). The Si 2p values shown in Table 4 have high error due to the software automatically trying to analyse peaks that were at background levels.
3.3. Cell Adhesion. Cells were seeded onto unetched and etched PU that was preincubated for 48 h with culture
In
te
n
si
ty (co
un
ts p
er s
eco
nd)
405 400 395
Binding energy (eV)
(a)
In
te
n
si
ty (co
un
ts p
er s
eco
nd)
405 400 395
Binding energy (eV)
(b)
In
te
n
si
ty (co
u
n
ts p
er s
eco
nd)
405 400 395
Binding energy (eV)
Background
Envelope
XPS data N–C(=O)–O
N+H–R3
[image:7.600.85.515.72.583.2](c)
Figure 5: High resolution XPS spectrum of the N 1 s peak for PU membranes: (a) unetched and etched at 20 W for (b) 40 s and (c) 80 s.
however on the unetched PU the cells aggregated to form clusters. The clusters continued to grow in size during the 8-day culture period.
4. Discussion
A model was fitted to the XPS data, based on a theoretical structure. The model can be used as the basis to determine changes to the PU surface following oxidation by plasma
250 200 150 100 50 0 Binding energy (eV)
In
te
n
si
ty (co
u
n
ts p
er s
eco
nd)
2days
5days
S (2s) Cl (2p)S (2p)
Si (2s) Si (2p)
[image:8.600.191.408.72.274.2]Na (2s) Na (2p)
Figure 6: XPS spectrum (truncated) of unetched PU incubated for 2 and 5 days with culture medium.
250 200 150 100 50 0
In
te
n
si
ty (co
u
n
ts p
er s
eco
nd)
Binding energy (eV)
2days
5days
S (2s) Cl (2p) S (2p) Na (2s) Na (2p)
Figure 7: XPS spectrum (truncated) of etched (20 W, 40 s) PU incubated for 2 and 5 days with culture medium.
on the environment [18, 19]. Adventitious carbon, on the unetched samples, may also skew the analysis [20]; unetched samples were stored in aluminium foil and after etching were transferred to the XPS analyser chamber within 3 h; therefore adventitious carbon was unlikely.
Following etching the C : O ratio became3.7 ± 0.17and
4.3 ± 0.15for 20 W 40 s and 80 s, respectively, while the C : N ratio was23.3 ± 0.95and18.5 ± 0.75. The model indicated that etching increased the proportion of C=O (C 1 s: 286.5 and 289.3 eV; O 1 s: 531.4 and 532.4 eV), as well as introducing cross-linking involving nitrogen. Peaks corresponding to HO–C=O were found in both C 1 s and O 1 s. Hydroxyl groups, in the case of polystyrene, have been proven to be essential for cell adhesion [21].
Incubation of cell culture substrates with proteins, par-ticularly proteins with the RGD sequence, improves cell adhesion. PU was incubated with a protein mixture, and it
was determined that etched membranes had complete cover-age (Figure 7). Unetched PU showed strong signals for sili-con and weaker signals for sulphur, in comparison to etched PU. The presence of both signals suggests that protein adsorp-tion sites were limited on the unetched surface. Membranes were handled at the edge using tweezers, which may have led to variation in the quantity of adsorbed protein dis-turbed/removed during transfer from the incubation plate to the washing plate; however analysis was carried out on the central region.
[image:8.600.194.408.313.503.2]3h
Etched
(a)
Unetched
(b)
1d
(c) (d)
8d
[image:9.600.52.548.587.727.2](e) (f)
Figure 8: Phase contrast micrographs of MG-63 cells on etched and unetched PU after 2 h, 1 day, and 8 days of static culture. Scale bar is
100𝜇m.
Table 3: Oxidation model for plasma etched PU, showing the predicted contribution of each group to the total oxidation. Data shows mean
±SD for𝑛 = 3.
Etching parameters Composition (at.%)
O=C(–O)–N O–C(=O)–N O=C(–O)2R (O–)2C=O O=C(–O)R HO–C=O SiO𝑥
Unetched 17.2 ± 0.4 9.4 ± 0.1 9.4 ± 0.1 9.4 ± 0.1 N/A N/A 4.7 ± 0.2
20 W 40 s 10.0 ± 0.1 7.2 ± 0.1 12.4 ± 0.1 10.1 ± 0.1 7.9 ± 0.4 0.5 ± 0.1 1.3 ± 0.1
20 W 80 s 8.0 ± 1.2 8.3 ± 0.9 10.1 ± 2.1 8.5 ± 1.4 10.8 ± 1.2 1.2 ± 0.6 1.6 ± 0.3
50 W 40 s 7.9 ± 1.5 8.6 ± 0.6 10.6 ± 1.8 8.2 ± 0.7 10.6 ± 0.8 0.9 ± 0.1 1.9 ± 0.1
50 W 80 s 10.5 ± 0.3 6.3 ± 1.7 12.4 ± 1.9 8.0 ± 0.7 9.9 ± 0.7 0.7 ± 0.1 1.4 ± 0.3
100 W 40 s 7.2 ± 0.1 7.3 ± 0.5 10.6 ± 0.1 9.0 ± 0.7 9.3 ± 0.3 0.9 ± 0.0(2) 4.3 ± 0.1
100 W 80 s 8.3 ± 0.7 8.4 ± 1.1 11.1 ± 1.0 11.6 ± 0.9 6.5 ± 0.3 0.7 ± 0.0(4) 2.7 ± 0.5
180 W 40 s 9.4 ± 0.1 8.6 ± 0.6 11.7 ± 0.1 11.7 ± 0.9 4.7 ± 0.6 0.7 ± 0.1 2.4 ± 0.4
Table 4: Surface composition of PU membrane incubated with culture medium. Data shows mean with SD (𝑛 = 3). Cl 2s and Na 2s were excluded from the calculation of elemental proportions.
Incubation period (days) and substrate
Composition (at.%)
C 1s N 1s O 1s S 2p Si 2p
Mean SD Mean SD Mean SD Mean SD Mean SD
5 d, etched 63.9 1.4 11.9 0.5 22.1 0.3 2.0 0.6 0.1 0.2
5 d, unetched 70.8 4.9 9.6 1.6 17.4 3.4 1.3 0.4 0.9 0.6
2 d, etched 65.5 2.8 11.5 0.2 21.4 2.0 1.5 0.9 0.1 0.1
2 d, unetched 71.1 4.0 7.0 1.9 17.5 2.3 0.5 0.4 3.9 0.5
1 d, etched 63.4 0.5 12.1 0.2 22.7 0.3 1.6 0.3 0.2 0.1
1 d, unetched 65.4 4.2 11.0 1.0 21.7 2.4 1.8 1.0 0.2 0.3
Control 76.9 2.8 3.1 0.3 15.8 1.9 Nil — 4.3 0.64
onto tissue culture polystyrene [2]. XPS of protein incubated etched PU did not show a silicon signal, which indicated complete protein coverage, which may have been a key factor in cells achieving confluence. This suggests that the oxidation, due to etching, was effective at increasing available protein and cell adhesion sites. According to the model, the hydroxyl groups accounted for a very small proportion of oxygen moieties, but the evidence shows that it was sufficient.
5. Conclusions
It has been shown that oxidative plasma etching of a medical grade PU alters the surface chemistry and roughness. XPS data showed cross-linking at the isocyanate group, involving 30 at.% of the nitrogen. Oxidation of the surface added hydroxyl and additional carbonyl groups. The former oxygen moieties were most likely responsible for the improved protein adsorption on etched surfaces and consequently the improved cell adhesion.
Conflict of Interests
The authors declare that there is no conflict of interests regarding the publication of this paper.
Acknowledgments
This project was funded through an EPSRC Grant, EP/ P505658/1, for Matthew Moles. Assistance from Mrs. Emily Smith with collecting XPS data and for discussions of the data is gratefully acknowledged. The authors thank the United Kingdom Society for Biomaterials for the opportunity to present this paper at the 2013 conference.
References
[1] A. J. Engler, M. A. Griffin, S. Sen, C. G. B¨onnemann, H. L. Sweeney, and D. E. Discher, “Myotubes differentiate optimally on substrates with tissue-like stiffness: pathological
implica-tions for soft or stiff microenvironments,”The Journal of Cell
Biology, vol. 166, no. 6, pp. 877–887, 2004.
[2] D. M. Moles, C. A. Scotchford, and A. C. Ritchie, “Development of an elastic cell culture substrate for a novel uniaxial tensile
strain bioreactor,”Journal of Biomedical Materials Research A,
2013.
[3] Q. Chen, S. Liang, and G. A. Thouas, “Elastomeric biomaterials
for tissue engineering,”Progress in Polymer Science, vol. 38, no.
3-4, pp. 584–671, 2013.
[4] C. Moraes, Y. K. Kagoma, B. M. Beca, R. L. M. Tonelli-Zasarsky, Y. Sun, and C. A. Simmons, “Integrating polyurethane
cul-ture substrates into poly(dimethylsiloxane) microdevices,”
Bio-materials, vol. 30, no. 28, pp. 5241–5250, 2009.
[5] H. J. Mathieu, “Auger electron spectroscopy,” inSurface Analysis
the Principal Techniques, J. Vickerman and I. Gilmore, Eds., pp.
9–46, John Wiley & Sons, West Sussex, UK, 2009.
[6] G. Beamson and D. Briggs,High Resolution XPS of Organic
Polymers: The Scienta ESCA300 Database, Wiley, Chichester,
UK, 1992.
[7] H. Kim, M. Seo, M.-H. Park, and J. Cho, “A critical size of silicon
nano-anodes for lithium rechargeable batteries,”Angewandte
Chemie International Edition, vol. 49, no. 12, pp. 2146–2149, 2010.
[8] L.-A. O’Hare, B. Parbhoo, and S. R. Leadley, “Development of a methodology for XPS curve-fitting of the Si 2p core level of
siloxane materials,”Surface and Interface Analysis, vol. 36, no.
10, pp. 1427–1434, 2004.
[9] S. S. Chao, Y. Takagi, G. Lucovsky et al., “Chemical states study
of Si in SiO𝑥films grown by PECVD,”Applied Surface Science,
vol. 26, no. 4, pp. 575–583, 1986.
[10] J. R. Pitts, T. M. Thomas, A. W. Czanderna, and M. Passler,
“XPS and ISS of submonolayer coverage of Ag on SiO2,”Applied
Surface Science, vol. 26, no. 1, pp. 107–120, 1986.
[11] F. Rochet, G. Dufour, H. Roulet et al., “Modification of SiO through room-temperature plasma treatments, rapid thermal annealings, and laser irradiation in a nonoxidizing atmosphere,”
Physical Review B, vol. 37, no. 11, pp. 6468–6477, 1988.
[12] B. H. Augustine, W. C. Hughes, K. J. Zimmermann, A. J. Figueiredo, X. Guo, and C. C. Chusuei, “Surface characteriza-tion of oxygen-plasma treated poss-based acrylic polymer thin
films,”Polymer Preprints, vol. 48, no. 1, pp. 789–788, 2007.
[13] M. Szycher and A. M. Reed, inventors, PolyMedia Industries, assignee. Biostable polyurethane products, 1993.
[14] G. P. L´opez, D. G. Castner, and B. D. Ratner, “XPS O 1s binding energies for polymers containing hydroxyl, ether, ketone and
ester groups,”Surface and Interface Analysis, vol. 17, no. 5, pp.
267–272, 1991.
[15] M. J. Hearn, B. D. Ratner, and D. Briggs, “SIMS and XPS
stud-ies of polyurethane surfaces. 1. Preliminary studstud-ies,”
[16] J. C. Bolger, “Acid base interactions between oxide surfaces and
polar organic compounds,” inAdhesion Aspects of Polymeric
Coatings, K. L. Mittal, Ed., pp. 3–18, Plenum Press, New York,
NY, USA, 1983.
[17] B. J. Tyler, B. D. Ratner, D. G. Castner, and D. Briggs, “Variations between Biomer lots. I. Significant differences in the surface chemistry of two lots of a commercial poly(ether urethane),”
Journal of Biomedical Materials Research, vol. 26, no. 3, pp. 273–
289, 1992.
[18] H.-B. Lin, K. B. Lewis, D. Leach-Scampavia, B. D. Ratner, and S. L. Cooper, “Surface properties of RGD-peptide grafted poly-urethane block copolymers: variable take-off angle and
cold-stage ESCA studies,”Journal of Biomaterials Science, vol. 4, no.
3, pp. 183–198, 1993.
[19] D. Zhang, R. S. Ward, Y. R. Shen, and G. A. Somorjai,
“Environ-ment-induced surface structural changes of a polymer: anin situ
IR + visible sum-frequency spectroscopic study,”The Journal of
Physical Chemistry B, vol. 101, no. 44, pp. 9060–9064, 1997.
[20] S. Evans, “Correction for the effects of adventitious carbon
over-layers in quantitative XPS analysis,”Surface and Interface
Ana-lysis, vol. 25, no. 12, pp. 924–930, 1997.
[21] A. S. Curtis, J. V. Forrester, C. McInnes, and F. Lawrie, “Adhesion
of cells to polystyrene surfaces,”Journal of Cell Biology, vol. 97,
Submit your manuscripts at
http://www.hindawi.com
Scientifica
Hindawi Publishing Corporationhttp://www.hindawi.com Volume 2014
Hindawi Publishing Corporation
http://www.hindawi.com Volume 2014 Hindawi Publishing Corporation
http://www.hindawi.com Volume 2014
Hindawi Publishing Corporation
http://www.hindawi.com Volume 2014
Ceramics
Journal ofHindawi Publishing Corporation
http://www.hindawi.com Volume 2014
Nanoparticles
Journal ofHindawi Publishing Corporation
http://www.hindawi.com Volume 2014
Hindawi Publishing Corporation
http://www.hindawi.com Volume 2014
International Journal of
Biomaterials
Hindawi Publishing Corporation
http://www.hindawi.com Volume 2014
Nanoscience
Journal ofTextiles
Hindawi Publishing Corporation
http://www.hindawi.com Volume 2014 Journal of
Hindawi Publishing Corporation
http://www.hindawi.com Volume 2014
Crystallography
Journal ofHindawi Publishing Corporation
http://www.hindawi.com Volume 2014
The Scientific
World Journal
Hindawi Publishing Corporationhttp://www.hindawi.com Volume 2014
Hindawi Publishing Corporation
http://www.hindawi.com Volume 2014
Coatings
Journal ofAdvances in
Materials Science and Engineering Hindawi Publishing Corporation
http://www.hindawi.com Volume 2014
Hindawi Publishing Corporation
http://www.hindawi.com Volume 2014
Hindawi Publishing Corporation
http://www.hindawi.com Volume 2014
Metallurgy
Journal ofHindawi Publishing Corporation
http://www.hindawi.com Volume 2014
BioMed
Research International
Materials
Journal ofHindawi Publishing Corporation
http://www.hindawi.com Volume 2014
N
a
no
ma
te
ria
ls
Hindawi Publishing Corporation
http://www.hindawi.com Volume 2014
Journal of