https://www.scirp.org/journal/jss ISSN Online: 2327-5960
ISSN Print: 2327-5952
DOI: 10.4236/jss.2019.712013 Dec. 9, 2019 176 Open Journal of Social Sciences
Research on the Development of “Ghost City”
Based on Night Light Data: Taking Sichuan
Province as an Example
Qiqi Zeng
1, Wenjun Zhang
21School of Civil Engineering and Architecture, Southwest University of Science and Technology, Mianyang, China 2School of Environment and Resources, Southwest University of Science and Technology, Mianyang, China
Abstract
Due to the improvement of urbanization level and unreasonable development in China, many cities have begun to appear as “Ghost City”; that is, the phe-nomenon of high vacancy rate and low occupancy rate in urban areas. The emergence of this phenomenon will seriously affect the healthy development of cities. Therefore, the monitoring and analysis of the urban “Ghost City” index is of great significance to urban population and urban construction. This paper uses Landsat8 remote sensing image data, night light remote sensing image data, and resident population data of various cities and counties in Sichuan Province to calculate the “Ghost City” index, and obtains the “Ghost City” Index of prefecture-level cities and county-level cities in Sichuan Province. Based on the judgment criteria of the Ghost City, the calculation results show that three cities have become “Ghost City” within the research scope; eight ci-ties have a tendency to develop into “Ghost City”; the rest of the cici-ties have developed well and there has not been a “Ghost City” phenomenon. Accord-ing to this conclusion, this paper studies the similarities and differences be-tween the cities that are the ghost towns or the cities with the development trend of ghost towns, analyzes the reasons for the formation of ghost towns and makes suggestions for the urbanization of Sichuan Province, and pro-vides reference for the direction of urban development and rational planning.
Keywords
Urbanization, DMSP/OLS, “Ghost City” Index, Light Gray Value
1. Introduction
Since the reform and opening-up, China’s urbanization has increased, and the
How to cite this paper: Zeng, Q.Q. and Zhang, W.J. (2019) Research on the Devel-opment of “Ghost City” Based on Night Light Data: Taking Sichuan Province as an Example. Open Journal of Social Sciences, 7, 176-188.
https://doi.org/10.4236/jss.2019.712013
Received: November 17, 2019 Accepted: December 6, 2019 Published: December 9, 2019
Copyright © 2019 by author(s) and Scientific Research Publishing Inc. This work is licensed under the Creative Commons Attribution International License (CC BY 4.0).
DOI: 10.4236/jss.2019.712013 177 Open Journal of Social Sciences
urbanization process has gradually accelerated, and the demand for housing has also risen sharply. The National Urban Land Use Data Summary Results Analy-sis Report [1] mentioned that the national urban land area increased by 1.65 million hectares in 2009-2014, with an average annual growth rate of 4.2%, indi-cating that urban construction land is increasing in a large amount. The devel-opment and unreasonable develdevel-opment of the city led to the emergence of emp-ty cities or ghost cities, that is, the phenomenon of high housing vacancy rate and low occupancy rate [2].
Due to the insufficient monitoring of the dynamic changes of urban popula-tion informapopula-tion, the phenomenon of “Ghost City” has appeared one after anoth-er. The emergence of this phenomenon has seriously affected the development of the city and restricted the advancement of urbanization, resulting in the waste of land resources and weakening urban operational efficiency. The criterion for “Ghost City” is that the ratio of urban population to built-up area is less than 0.5 or slightly higher than 0.5 (the standard is based on the land occupation stan-dard from the Ministry of Housing and Urban-Rural Development, the built-up area per square kilometer holds 10,000 people), this criterion known as the “Ghost City” Index. This study takes Sichuan Province as an example, combined with the 2013 Landsat8 OLI_TIRS and DMSP/OLS night-time remote sensing image data, through the fitting of the urban population and the extraction of the built-up area, to achieve the city-level and county-level cities in Sichuan Prov-ince. The analysis and monitoring of the “Ghost City” index, and through the analysis of the reasons for the formation of the ghost city phenomenon, propose corresponding countermeasures, and provide the basis for urban development and planning.
2. Research Scope and Data
2.1. Research Scope
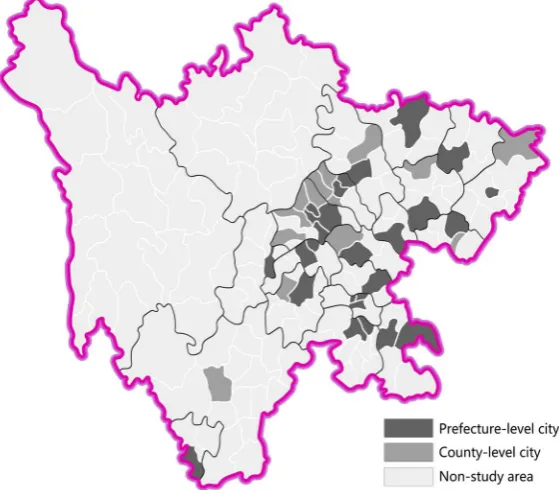
Sichuan Province has complex landforms and has four types of landforms: moun-tains, hills, plains and plateaus. Therefore, this paper selects Sichuan Province as the research scope and provides reference for the study of ghost cities in other cities in China. Sichuan governs 18 prefecture-level cities, 3 autonomous prefec-tures, 17 county-level cities, 108 counties, and 4 autonomous counties. In this study, only 18 prefecture-level cities and 17 county-level cities were selected as research areas analysis (Figure 1) and monitoring of the “Ghost City” index in Sichuan Province.
2.2. Data Sources
DOI: 10.4236/jss.2019.712013 178 Open Journal of Social Sciences
Figure 1. Research scope.
(DMSP) was taken in 2013. In this paper, the data of the night light in Sichuan Province extracted by the study is 0 - 63, the saturated light gray value is 63, and the spatial resolution is 1km (Note: Due to the DMSP/OLS luminous remote sens-ing image data on the National Geophysical Data Center website as of 2013, the research data selected in this paper is the 2013 data).
2) Landsat8 OLI_TIRS remote sensing image data. The satellite imagery cov-ering the whole region of Sichuan Province was selected in 2013. The data comes from the Geospatial Data Cloud Platform of the Computer Network Information Center of the Chinese Academy of Sciences (http://www.gscloud.cn).
3) Population data of city-level and county-level cities at various levels. From the China Statistics Information Network (http://www.tjcn.org/).
4) Other auxiliary data. It mainly includes vector administrative boundaries at the national, provincial, municipal, and county levels in China.
3. Data Processing
3.1. DMSP/OLS Data Processing
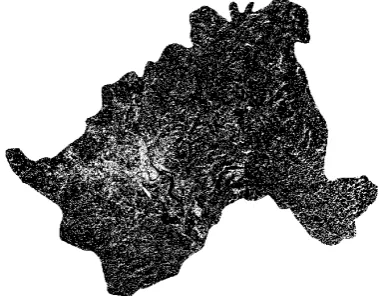
In order to obtain the remote sensing image data of the study area, the obtained DMSP/OLS luminous remote sensing image data is tailored according to the ad-ministrative boundary vector data of Sichuan Province, and the DMSP data of various cities and county-level cities in Sichuan Province are obtained (Figure 2).
DOI: 10.4236/jss.2019.712013 179 Open Journal of Social Sciences
Figure 2. DMSP data of various cities and county-level cities in Sichuan Province.
The important basis for assessing the level of urban development is urban con-struction land. Researchers at home and abroad have made a lot of research on the extraction of urban construction land. Among them, Xu Hanqiu [3] pro-posed to use the IBI building land index to extract urban built-up areas from re-mote sensing images. Accuracy can reach more than 96%. The IBI building land index can be constructed by the three indexes of normalized building index NDBI, vegetation cover index NDVI and improved normalized water body in-dex MNDWI.
Calculation formula as follows:
(
) (
)
NDBI= B6 B5− B6 B5+ (1)
(
) (
)
NDVI= B5 B4− B5 B4+ (2)
(
) (
)
MNDWI= B3 B6− B3 B6+ (3)
Among them, B3, B4, B5 and B6 are the green band, the red band, the near- infrared band, and the SWIR1 band of the Landsat8 OLI_TIRS image.
The IBI building land index formula is as follows:
(
)
(
)
NDBI NDVI MNDWI 2
IBI
NDBI NDVI MNDWI 2
− +
=
+ +
(4)
Substituting the Equation (1), Equation (2), Equation (3) into the Equation (4), the finishing can be obtained:
(
) (
) (
) (
) (
) (
)
(
) (
) (
) (
) (
) (
)
2 B6 B5 B6 B5 B5 B4 B5 B4 B3 B6 B3 B6
IBI
2 B6 B5 B6 B5 B5 B4 B5 B4 B3 B6 B3 B6
− + − − + − − +
=
− + + − + + − + (5)
Due to space limitations, the processing results of all prefecture-level cities and county-level cities cannot be displayed. Only the construction land and built-up areas extracted by the IBI index of Mianyang City are displayed here, as shown in Figure 3 and Figure 4.
4. Research Ideas and Methods
DOI: 10.4236/jss.2019.712013 180 Open Journal of Social Sciences
[image:5.595.278.472.265.411.2]Figure 3. Mianyang City construction land extracted by IBI index.
[image:5.595.212.538.441.641.2]Figure 4. Mianyang City built-up area.
Figure 5. Research process.
DOI: 10.4236/jss.2019.712013 181 Open Journal of Social Sciences
this study may have certain errors due to the difficulty of obtaining. It is only for the study of the ghost city index method, and the data will be continuously im-proved in future research.
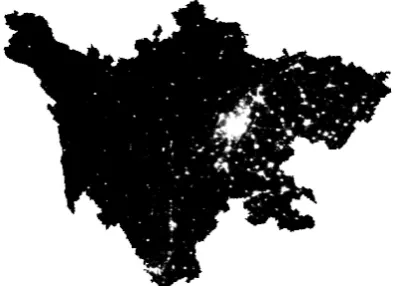
4.1. Population Spatialization
The administrative boundary vector data of Sichuan Province is overlapped with the night light remote sensing image, and the DMSP/OLS data of each city and county level city is obtained through the cropping in the GIS data management tool, and the data of night light intensity greater than 6 is obtained through attribute extraction, and after extraction, the data is extracted. The light intensity distribution is shown in Figure 6. After obtaining the data of night light intensi-ty greater than 6 in various cities and counties, use the zoning statistics function to calculate the sum of the light gray values of the nighttime lighting data of each city and county level (Table 1, Figure 7).
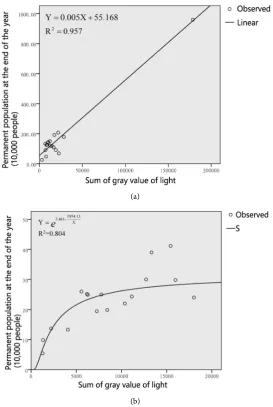
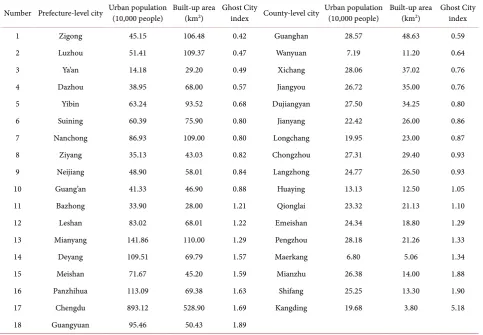
[image:6.595.274.473.387.529.2]Many scholars have confirmed that the spatial distribution of population has a certain correlation with nighttime lighting data. This paper will fit and analyze the sum of the light intensity and the resident population of 18 prefecture-level cities and 17 county-level cities in Sichuan (Figure 8). In the figure, the sum of the light intensity values of each city is X, and the number of permanent resi-dents in each city is Y.
Figure 6. DMSP data with a light intensity greater than 6.
[image:6.595.276.474.563.706.2]DOI: 10.4236/jss.2019.712013 182 Open Journal of Social Sciences
Table 1. The sum of the light gray values of the Prefecture-level city and County-level
cities.
Number Prefecture-level city The sum of the light gray values County-level city The sum of the light gray values
1 Zigong 9030 Guanghan 18,012
2 Luzhou 10,281 Wanyuan 1313
3 Ya’an 2835 Xichang 15,436
4 Dazhou 7789 Jiangyou 11,139
5 Yibin 12,647 Dujiangyan 13,323
6 Suining 12,078 Jianyang 5566
7 Nanchong 17,385 Longchang 4178
8 Ziyang 7026 Chongzhou 12,724
9 Neijiang 9780 Langzhong 7771
10 Guang’an 8266 Huaying 2206
11 Bazhong 6779 Qionglai 6271
12 Leshan 16,604 Emeishan 7266
13 Mianyang 28,371 Pengzhou 15,973
14 Deyang 21,901 Maerkang 1265
15 Meishan 14,333 Mianzhu 10,371
16 Panzhihua 22,618 Shifang 8421
17 Chengdu 178,623 Kangding 4061
18 Guangyuan 19,091
Source: Author self-painting.
According to Figure 8, the matching of the city’s light intensity value with the resident population has a good effect. Therefore, the population quantity infor-mation extracted by real-time remote sensing data is scientific and accurate. The urban population is obtained by fitting the regression equation. The calculation formula of the urban population Num1 of the prefecture-level city and the urban population of the county-level city is as follows:
Num1=0.005 DN× (6)
1954.13 3.461
DN
Num2=e − (7)
Note: DN is the sum of the light gray values of the city and county level cities.
4.2. “Ghost City” Index
DOI: 10.4236/jss.2019.712013 183 Open Journal of Social Sciences (a)
[image:8.595.237.511.69.477.2](b)
Figure 8. Light and population fit curve. (a) Prefecture-level city; (b) County-level city.
attention to the development of “healthy cities”. The existence of the “Ghost City” phenomenon is inevitably inconsistent with the trend of urban healthy devel-opment. The “Ghost City” index is an important indicator to measure whether the city has become a “Ghost City” [4]. Therefore, the monitoring of the “Ghost City Index” is particularly important.
According to the built-up area of prefecture-level cities and county-level cities in Sichuan Province extracted from the previous article and the urban popula-tion obtained according to the fitted regression equapopula-tion, the “Ghost City” index of prefecture-level cities and county-level cities in Sichuan Province is calculated (Table 2). The calculation formula is as follows:
Num Index
S
= (8)
DOI: 10.4236/jss.2019.712013 184 Open Journal of Social Sciences
Table 2. The “Ghost City” index of the Prefecture-level city and County-level cities.
Number Prefecture-level city Urban population (10,000 people) Built-up area (km2) Ghost City index County-level city Urban population (10,000 people) Built-up area (km2) Ghost City index
1 Zigong 45.15 106.48 0.42 Guanghan 28.57 48.63 0.59
2 Luzhou 51.41 109.37 0.47 Wanyuan 7.19 11.20 0.64
3 Ya’an 14.18 29.20 0.49 Xichang 28.06 37.02 0.76
4 Dazhou 38.95 68.00 0.57 Jiangyou 26.72 35.00 0.76
5 Yibin 63.24 93.52 0.68 Dujiangyan 27.50 34.25 0.80
6 Suining 60.39 75.90 0.80 Jianyang 22.42 26.00 0.86
7 Nanchong 86.93 109.00 0.80 Longchang 19.95 23.00 0.87
8 Ziyang 35.13 43.03 0.82 Chongzhou 27.31 29.40 0.93
9 Neijiang 48.90 58.01 0.84 Langzhong 24.77 26.50 0.93
10 Guang’an 41.33 46.90 0.88 Huaying 13.13 12.50 1.05
11 Bazhong 33.90 28.00 1.21 Qionglai 23.32 21.13 1.10
12 Leshan 83.02 68.01 1.22 Emeishan 24.34 18.80 1.29
13 Mianyang 141.86 110.00 1.29 Pengzhou 28.18 21.26 1.33
14 Deyang 109.51 69.79 1.57 Maerkang 6.80 5.06 1.34
15 Meishan 71.67 45.20 1.59 Mianzhu 26.38 14.00 1.88
16 Panzhihua 113.09 69.38 1.63 Shifang 25.25 13.30 1.90
17 Chengdu 893.12 528.90 1.69 Kangding 19.68 3.80 5.18
18 Guangyuan 95.46 50.43 1.89
Source: Author self-painting.
5. Analysis of Calculation Results
According to the Ghost Town Index obtained above, 35 cities in Sichuan Prov-ince (18 prefecture-level cities and 17 county-level cities) can be divided into three categories:
There are 3 cities with an index less than 0.5, including Zigong, Luzhou and Ya’an. Such cities have become ghost towns, and their urban development has serious problems, and there has been an imbalance between urban population and urbanization. Therefore, it is necessary to implement new urbanization and realize ghosting urbanization through rational use of land resources and plan-ning.
There are 8 cities with indices ranging from 0.5 to 0.8, including Dazhou, Nanchong, Yibin, Suining, Guanghan, Wanyuan, Xichang and Jiangyou. Al-though this type of city has not become a ghost town, its urbanization still has problems. It also needs to provide a more rational urbanization development strategy for the city in terms of policies and planning.
DOI: 10.4236/jss.2019.712013 185 Open Journal of Social Sciences
Huaying, Qionglai, Emeishan, Pengzhou, Maerkang, Mianzhu, Shifang and Kangding. The urbanization of this type of city is more reasonable, basically achieving the balanced development of urban population and urbanization. In the later stage of construction and development, it is necessary to monitor the urban population and urbanization information in real time to avoid the devel-opment trend of “ghost town”.
In summary, there are three cities in Sichuan Province where there are ghost towns, and another eight cities have a tendency to become “ghost towns”. The rest of the cities are developing better. In general, the overall situation of the province is good. According to the construction of the ghost city index in Si-chuan Province, it can be concluded that in the process of urban development in Sichuan Province, it is still necessary to pay attention to the rational use of re-sources and the rationality of urban development, so that the city that is a ghost city can basically achieve ghost city transformation and cities that have not be-come ghost towns avoid forming a trend toward ghost towns or bebe-come ghost towns.
6. The Reason for the Formation of Ghost Towns
According to the previous analysis of the ghost city index, the ghost towns in Sichuan Province are mainly distributed in the southeast, and the cities with ghost town development trends are mainly distributed in the northeast. There is basi-cally no ghost town phenomenon in central Sichuan. The central part of Sichuan Province is dominated by cities such as Chengdu and Mianyang, and Chengdu, as the capital of Sichuan Province, is therefore more attractive to people, so there is no ghost city phenomenon.
According to a large number of literature research, many scholars also pay more attention to the ghost city phenomenon. Among them, Nie Xiangyu [5] and Duan Lufeng [6] have elaborated on the types of ghost towns. The types are mainly disaster-type ghost cities, fading ghost cities, and planning advanced type ghost cities, planning lag ghost cities and real estate ghost cities. Among them, the dis-aster-type ghost town is mainly caused by the city’s lack of popularity, which leads to becoming an empty city. The decline-type ghost town is caused by the deple-tion of resources in the process of urban development, resulting in the loss of population, thus forming a ghost city. Planning advanced ghost towns is Due to unreasonable planning, far exceeding the demand of urban planning population, many construction land is idle. Planning a lag-type ghost town is because the planning cannot meet the needs of the urban population, the planning function is too single or the public service facilities and infrastructure are not perfect, re-sulting in urban population outflow. Real estate-type ghost town is due to the emergence of real estate speculation, resulting in the expansion of the real estate market, making the urban housing occupancy rate too low, vacancy rate is too high, thus forming a ghost town.
DOI: 10.4236/jss.2019.712013 186 Open Journal of Social Sciences
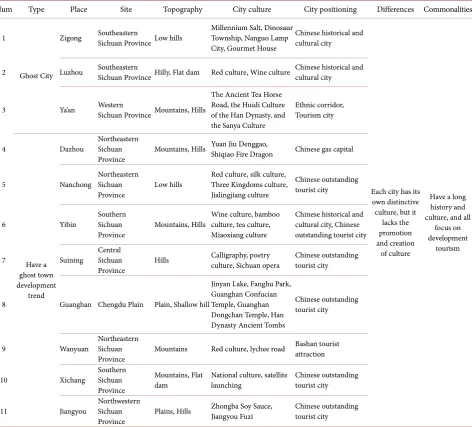
Table 3. Comparison of similarities and differences between cities.
Num Type Place Site Topography City culture City positioning Differences Commonalities
1
Ghost City
Zigong Southeastern Sichuan Province Low hills Millennium Salt, Dinosaur Township, Nanguo Lamp City, Gourmet House
Chinese historical and cultural city
Each city has its own distinctive culture, but it
lacks the promotion and creation
of culture
Have a long history and culture, and all focus on development
tourism 2 Luzhou Southeastern Sichuan Province Hilly, Flat dam Red culture, Wine culture Chinese historical and cultural city
3 Ya’an Western Sichuan Province Mountains, Hills
The Ancient Tea Horse Road, the Huidi Culture of the Han Dynasty, and the Sanya Culture
Ethnic corridor, Tourism city 4 Have a ghost town development trend
Dazhou Northeastern Sichuan
Province Mountains, Hills Yuan Jiu Denggao, Shiqiao Fire Dragon Chinese gas capital
5 Nanchong Northeastern Sichuan
Province Low hills
Red culture, silk culture, Three Kingdoms culture, Jialingjiang culture
Chinese outstanding tourist city
6 Yibin Southern Sichuan
Province Mountains, Hills
Wine culture, bamboo culture, tea culture, Miaoxiang culture
Chinese historical and cultural city, Chinese outstanding tourist city
7 Suining Central Sichuan
Province Hills
Calligraphy, poetry
culture, Sichuan opera Chinese outstanding tourist city
8 Guanghan Chengdu Plain Plain, Shallow hill
Jinyan Lake, Fanghu Park, Guanghan Confucian Temple, Guanghan Dongchan Temple, Han Dynasty Ancient Tombs
Chinese outstanding tourist city
9 Wanyuan Northeastern Sichuan
Province Mountains Red culture, lychee road Bashan tourist attraction
10 Xichang Southern Sichuan Province
Mountains, Flat
dam National culture, satellite launching Chinese outstanding tourist city
11 Jiangyou Northwestern Sichuan
Province Plains, Hills
Zhongba Soy Sauce,
Jiangyou Fuzi Chinese outstanding tourist city
Source: Author self-painting.
trend of ghost towns in this study are not in line with the disaster-type and the decline-type ghost city. Most of the cities (such as Luzhou, Ya’an, etc.) are mainly tourism development. Due to the excessive development of tourism, most of the buildings or service facilities in urban construction are aimed at tourism. In or-der to pursue the interests of the tourism industry, the large-scale construction of the tourism industry has led to a reduction in the utilization rate of urban land, thus forming a ghost town. In addition to this, there are also ghost towns created by cities in order to promote development, large-scale construction of new dis-tricts, and new districts that are not attractive to the population and enterprises.
7. Conclusions and Suggestions
Land-DOI: 10.4236/jss.2019.712013 187 Open Journal of Social Sciences
sat8 OLI_TIRS remote sensing image were used to construct the ghost city index of each city in Sichuan Province. The lower the utilization rate of urban land re-sources, the lower the ghost city index; the higher the utilization rate of urban land resources, the higher the ghost city index. “Ghost Town” is always closely linked with the urbanization of the Great Leap Forward and over-exploitation of real estate. It is a subjective “making city” movement that lacks rational cogni-tion and scientific consideracogni-tions [7]. Therefore, the study of the Ghost Town Index is conducive to the monitoring of the urbanization of the city, which is conducive to the healthy and rapid development of each city.
The existence of ghost towns will result in low land resource utilization and waste of land, and will hinder the healthy and rapid development of cities. There-fore, how to rationally urbanize is a key issue for urban development. Combined with the previous analysis of the Sichuan Ghost Town Index and the reasons for the formation of ghost towns, the paper puts forward suggestions on the future of ghosting and rational urbanization in Sichuan.
1) Government level: In the process of urban development, the stage of growth of urban development is overemphasized, while the ups and downs of urban de-velopment may be neglected [8]. Therefore, in the process of development, scien-tific decision-making should be made to rationally plan the situation of the city. The distribution law of urban population density is declining from the tradition-al centrtradition-al area to the suburbs, so the intensity of human activities in the newly developed areas of the city is significantly lower than that of the urban old city
[9]. In the process of urbanization, the construction of the new district must be gradual and gradual, and it is necessary to strengthen the supervision and man-agement of urban planning to prevent the emergence of unorderly spreading [10]
and lead to the formation of “empty cities” and “ghost cities”.
2) Planner level: Each city has its own unique culture and resources. In the planning, it should avoid the “Same Imagines of the City” and all construction methods cannot be copied. Planning and design should focus on the development of traditional culture with urban characteristics, strengthen residents’ sense of identity with the city, and enhance the vitality of the city.
In summary, ghost towns will bring various environmental problems such as land waste and waste of resources. Cities such as Ya’an and Zhangzhou should be committed to revitalizing “ghost towns”. Therefore, each city should imple-ment scientific and rational urban planning. When planning and constructing, it should be realistic and conform to local conditions and integrate local culture to enhance the city’s attractiveness and vitality.
Conflicts of Interest
The authors declare no conflicts of interest regarding the publication of this pa-per.
References
DOI: 10.4236/jss.2019.712013 188 Open Journal of Social Sciences
Summary Results Analysis Report [EB/OL].
[2] Su, H.R., Zhang, Z., Li, A., Lei B.B. and Li, Y.F. (2017) Design and Implementation of Remote Sensing Monitoring System for Ghost City Index. Computer knowledge and technology, 13, 260-262.
[3] Xu, H.Q., Du, L.P. and Sun, X.D. (2011) Definition and Automatic Extraction of Urban Construction Area Based on Remote Sensing Index. Journal of Fuzhou Uni-versity (Natural Science Edition), 39, 707-712.
[4] Bai, Lu. (2016) “Ghost City”: Misunderstanding of a City. Lanzhou University, Lanz-hou.
[5] Nie, X.Y. and Liu, X.J. (2013) Type Analysis and Governance of “Ghost City” in the Process of Urbanization. Journal of Nantong University (Social Science Edition), 29, 111-117.
[6] Duan, L.F., Wei, M. and Che, Z.H. (2017) Analysis of the Planning-Type “Empty City” Phenomenon under the Background of New Urbanization. Ecological Economy, 33, 116-121.
[7] Tong, D.H. (2014) The Death and Birth of Chinese Cities—Getting out of Fei Xiao-tong’s Trap. The Eastern Publishing, 8, 18-21.
[8] Gao, S.Q. (2017) The Phenomenon, Concept and Research Traceability of Contract-ing Cities. Urban Planning International, 32, 50-58.
[9] Long, W. and Wu, K. (2016) Several Realistic Problems of Urbanization in China: Spatial Expansion, Population Contraction, Low-density Human Activities and Ur-ban Scope Definition. UrUr-ban Planning Forum, 2, 72-77.