Serial MR diffusion to predict treatment
response in high-grade pediatric brain
tumors: a comparison of regional and
voxel-based diffusion change metrics
Daniel Rodriguez Gutierrez, Muftah Manita, Tim Jaspan, Robert A. Dineen,
Richard G. Grundy, and Dorothee P. Auer
Division of Radiological and Imaging Sciences, University of Nottingham (D.R.G., M.M., R.A.D., D.P.A.), Nottingham University Hospital Trust (T.J.), and The Children‘s Brain Tumor Research Centre, University of Nottingham, Nottingham, United Kingdom (D.R.G., T.J., D.P.A., R.G.G.)
Background. Assessment of treatment response by
mea-suring tumor size is known to be a late and potentially confounded response index. Serial diffusion MRI has shown potential for allowing earlier and possibly more reliable response assessment in adult patients, with limited experience in clinical settings and in pediatric brain cancer. We present a retrospective study of clinical MRI data in children with high-grade brain tumors to assess and compare the values of several diffusion change metrics to predict treatment response.
Methods. Eighteen patients (age range, 1.9 –20.6 years)
with high-grade brain tumors and serial diffusion MRI (pre- and posttreatment interval range, 1– 16 weeks posttreatment) were identified after obtaining parental consent. The following diffusion change metrics were compared with the clinical response status assessed at 6 months: (1) regional change in absolute and normal-ized apparent diffusivity coefficient (ADC), (2) voxel-based fractional volume of increased (fiADC) and decreased ADC (fdADC), and (3) a new metric based on the slope of the first principal component of function-al diffusion maps (fDM).
Results. Responders (n¼12) differed significantly
from nonresponders (n¼6) in all 3 diffusional change metrics demonstrating higher regional ADC increase, larger fiADC, and steeper slopes (P,.05). The slope
method allowed the best response prediction (P,.01,
h2¼0.78) with a classification accuracy of 83% for a slope of 588 using receiver operating characteristic (ROC) analysis.
Conclusions. We demonstrate that diffusion change
metrics are suitable response predictors for high-grade pe-diatric tumors, even in the presence of variable clinical diffusion imaging protocols.
Keywords: ADC, fDM, pediatric tumor, response
prediction, serial diffusion.
C
urrent assessment of CNS tumor treatment re-sponse is based on evaluating changes in tumor size several weeks or months after the end of the treatment course. Tumor size is generally estimated from anatomical CT or MRI images,1,2 but volumechanges can occur relatively late than other physiological changes that may indicate tumor response at an earlier stage. Furthermore, reduction in the proportion of active tumor cells during treatment may not necessarily correlate with lesion dimensions, because there may be areas of edema and necrosis.3 Therefore, significant
effort is being applied in the development and validation of functional imaging markers for early response assess-ment, such as changes in tumor metabolites, diffusion, or perfusion characteristics.4–6
Diffusion MRI is a widely used technique for both diagnosis and treatment response. Regional apparent diffusion coefficient (ADC) changes, estimated from pre- and posttreatment regions of interest (ROIs), have been proposed to predict tumor response to radiation/ chemotherapy, with increased ADC associated with
#The Author 2013. Published by Oxford University Press on behalf of the Society for Neuro-Oncology.
This is an Open Access article distributed under the terms of the Creative Commons Attribution License (http:// creativecommons.org/licenses/by-nc/3.0/), which permits non-commercial use, distribution, and reproduction in any
Corresponding Author:Dorothee Auer, MD, Division of Radiological and Imaging Sciences, Room W/B 1441, Queens Medical Centre, Derby Rd., Nottingham NG7 2UH, UK (dorothee.auer@nottingham. ac.uk).
Received November 28, 2012; accepted February 15, 2013.
doi:10.1093/neuonc/not034
N E U R O - O N C O LO G Y
Advance Access publication April 12, 2013
at University of Nottingham on November 22, 2016
http://neuro-oncology.oxfordjournals.org/
a more favorable clinical course.7–10In the limited
pedi-atric literature, decreased diffusion has been reported in nonresponding diffuse intrinsic brainstem gliomas (after an initial increase due to radio-therapy effects)11,12and nonresponding medulloblastomas.13
Alternatively, individual pixel-to-pixel ADC compar-isons may provide a more accurate description of tumor progression by accounting for regional heterogeneity. Several studies have investigated the value of functional diffusion maps (fDMs) in predicting tumor response in adult tumors, time to progression (TTP), and overall survival (OS) after cytotoxic or anti-angiogenic thera-pies.4,7,14,15 Typically, the 2 imaging biomarkers
ex-tracted from fDMs are relative volumes exhibiting a decrease16,17and an increase4,18in ADC. This requires
selecting a threshold level that defines what constitutes an increase or a decrease in ADC. Several studies have investigated empirically what threshold values may best separate responders from nonresponders, ranging from 0.25 to 0.75×1023mm2/s.4,7,14,16 Apart from the choice of threshold, there are other technical factors that may affect the calculation of fDM and re-gional ADC metrics, including image processing steps, such as registration,19 and the specifics of ROI selec-tion.16Furthermore, the majority of fDM and regional serial ADC analyses published thus far are single-center prospective studies using consistent imaging protocols and identical scanners, often limited to a single tumor type. In clinical practice, however, it is common to en-counter different acquisition protocols and scanners among patients and variation in intervals between follow-up scans. All these factors may confound re-sponse prediction.
Here, we present the first study, to our knowledge, that investigates and compares the robustness and suit-ability of several diffusion change metrics for assessment of treatment response on highly heterogeneous clinical pediatric data. We investigate the effects that different ROI selection, registration technique, and threshold selection have on fDM metrics and compare these 2 re-gional metrics. Finally, we present a new postprocessing method that avoids empirical threshold selection for fDM analysis by using a Principal Component Analysis (PCA) on the scatter of pre- and posttreatment pixel-by-pixel ADC values to infer changes of diffusion heterogeneity. This new approach removes the need to estimate the fDM threshold and may help to provide a simpler and robust tool to assess response.
Materials and Methods
Patients
All patients participating in this study signed informed consent to have their data collected and used for research by the UK Child Cancer and Leukaemia Group (CCLG) Functional Imaging Group database, a UK National Health Service (NHS) Research Ethics Committee– approved study. Eighteen patients with high-grade tumors (World Health Organization [WHO] grade III
and IV) were included (age range, 1.9 – 20.6 years) who had undergone 2 diffusion MR scans before (0.1 –6.3 weeks) and after (1 –16 weeks) the start of chemotherapy/radiotherapy as part of clinical care. All patients had diagnosis confirmed by histology, except for one patient with a secreting germ cell tumor, as reviewed by 2 neuro-pathologists with.15 years of ex-perience. Only patients with residual disease were included and, thus, excluded any macroscopic complete resection. Response was defined at 6 months after the be-ginning of treatment, using combined clinical and radio-logical criteria according to new Response Assessment in Neuro-Oncology (RANO) criteria20 assessed by an
experienced pediatric oncologist (R.G.) and neuro-radiologists (T.J., R.A.D., or D.P.A.). All patients received standard clinical treatment (Table1).
MRI
Clinical MRI scans were obtained before and after che-motherapy and/or radiotherapy as part of clinical care. The first scan was always performed before the begin-ning of treatment and/or biopsy. MRI scans were per-formed on 1 of 3 scanners, a 1.5T GE Sigma (General Electric Medical Systems, Milwaukee, WI), a 1.5T Philips Intera, or a 3T Philips Achieva (Philips Medical Systems, Best, Netherlands), and as part of a multimodal MRI protocol, that consisted of at least pre- and postcontrast axial T1-weighted (TR¼[598 – 647] ms, TE¼[12 – 14] ms 0.45×0.45×4 mm3 voxel size), precontrast axial T2-weighted (TR¼[3000] ms, TE¼ [72–85] ms 0.45×0.45×4 mm3voxel size), and diffu-sion imaging. Diffudiffu-sion data were obtained with different sequences, ranging from diffusion-weighted imaging (DWI) to 15-direction diffusion-tensor imaging (DTI), using b¼0 s/mm2 and either bmax¼1000 s/mm2 or bmax¼800 s/mm2, TR¼[4883–5800] ms, TE¼ [59–89] ms, and voxel size of either 12 mm3 (2×2× 3) or14.4 mm3(1.9×1.9×4).
Additional volunteer data were acquired for each dif-fusion sequence and used to determine specific fDM thresholds for each combination of pre-post treatment scan protocol.
MRI Protocol Comparison
The effect of using different pre- and posttreatment imaging protocols on diffusion metrics was investigated for 6 of the cases, in which 2 distinct ADC imaging pro-tocols were available for one time point by comparing the respective diffusion distributions in both tumor and white matter (WM) ROIs.
Manual Tracing of Tumor
Pre- and posttreatment whole-tumor ROIs were manually drawn on measurable tumors (ie,.1 cm) by an enced neuro-radiologist (R.A.D.) and a second experi-enced researcher (M.M.) using NeuROI (The University of Nottingham, UK; http://www.nottingham.ac.uk/
at University of Nottingham on November 22, 2016
http://neuro-oncology.oxfordjournals.org/
scs/divisions/clinicalneurology/software/neuroi.aspx). Previous studies have used either contrast-enhancing tissue or abnormal FLAIR areas to define the ROIs, but it is unclear which is a better predictor of OS.16,19 In this study, tumor tissue was defined on the contrast-enhanced T1w images as areas of abnormal en-hancement, but also using the coregistered precontrast T2w images to identify and exclude blood vessels adja-cent to enhancing tumor and to include low-contrast tumor or necrotic tissue adjacent to edema. This allowed comparing tumor volumes, including enhancing and nonenhancing tumor parts, by multiplying the areas from these ROIs with inter-slice distances.
Regional ADC Change Metrics
[image:3.594.61.536.73.517.2]ADC change was calculated from the ROIs generated for fDM analysis (see below). Change was expressed as the post- / pre ratio of mean tumor ADC (ADCr) computed for each lesion. WM-normalized ratios (nADCr) were computed using a small reference region in normal-appearing WM. The advantage of using normalized ADC is to remove some of the heterogeneity that the use of different scanners and protocols introduces. The disadvantages of this normalization are introducing an unwanted age dependence in the very young patients and potential bias from disease and treatment effect on
Table 1. Patient demographic characteristics, histopathological tumor diagnosis, and treatment details
Age (years)
Gender Tumor type Grade Type of surgery
Treatment (within scan window)
Scan interval (weeks)1
Volume change (at 6 months)
New lesions (at 6 months)
RANO response (at 6 months)
Clinical course after end of therapy
10.7 F Secr. Germ Cell Tumor
none Chemotherapy/ RT
2.4 decrease N PR No Relapse
2.7 F PNET IV biopsied Chemotherapy (COG 921)
15.1 no change
N PD Death
11.7 M Pineoblastoma IV biopsied Chemotherapy (PNET3)
4.0 decrease N PR No Relapse
8 M Pineal PNET III biopsied Chemotherapy (PNET3)
6.9 decrease N PR No Relapse
15 M Germinoma III biopsied Radiotherapy 6.4 decrease N CR No Relapse 15.8 F Glioneuronal
tumour
IV debulking Chemotherapy (Milan)
9.7 decrease N SD Residual Thalamic tumour 4.6 F DIPG(GBM) IV biopsied Chemotherapy/
RT (TMZ)
10.0 no change
N PD Death
7.8 F DIPG(GBM) IV biopsied Chemotherapy/ RT (TMZ)
16.7 increase N PD Death
3.5 F MB IV debulking Chemotherapy (Milan)
4.3 decrease N CR Leptomeningeal spread
1.9 M MB IV biopsied Chemotherapy
(PNET3)
4.1 decrease N PR Death
6.2 M DIPG
(Glioblastoma)
III biopsied Chemotherapy/ RT (TMZ)
13.1 increase N PD Death
4.7 M MB IV debulking Chemotherapy/ RT (POG 9031)
3.4 decrease Y PR Supra tentorial recurrent tumour 9.2 M MB IV debulking Chemotherapy
(Milan)
1.9 decrease N CR No Relapse
12.3 M Germinoma III biopsied Chemotherapy 2.1 decrease N PR No Relapse 12.4 M GBM IV debulking Chemotherapy/
RT (TMZ)
16.9 decrease N PR Death
6.8 M MB IV biopsied Chemotherapy/
RT (POG 9031)
10.0 decrease N PR No Relapse
20.6 M Glioblastoma(GBM) IV biopsied Chemotherapy (TMZ)
12.6 decrease N SD No Relapse
12.8 F MB IV debulking Chemotherapy (Milan)
11.3 decrease N PR No Relapse
11.2 F Pineoblastoma IV biopsied Chemotherapy (PNET3)
8.9 decrease N PR No Relapse
Abbreviations: COG, Children’s Oncology Group; CR, complete response; DIPG, diffuse intrinsic pontine glioma; GBM, glioblastoma multiforme; MB, medulloblastoma; PD, progressive; PNET, primitive neuroectodermal tumor; POG, Pediatric Oncology Group; PR, partial response; RANO, Response Assessment in Neuro-Oncology; RT, radiotherapy; SD, stable disease; TMZ, tomozolomide.
at University of Nottingham on November 22, 2016
http://neuro-oncology.oxfordjournals.org/
WM that cannot be avoided by choosing normal-appearing WM (2 of the 18 cases were in recurrent pa-tients). To better interpret fDM, we also derived peak height decrease (PkDec) as a heterogeneity measure from normalized tumor histograms.
Generating Functional Diffusion Maps
The process of generating a fDM involves a series of sequential processing steps. First, data registration is per-formed; all pre- and postcontrast data are registered to a common baseline image (typically anatomic, such as FLAIR, T2w, or contrast-enhanced T1w). This step may include linear or nonlinear registration processes. Second, tumor ROIs are defined; these are delineated on the basis of the anatomical images and applicable to the registered diffusion data. Third, the fDM is calcu-lated using a predefined threshold that determines a suit-able change in ADC values; pixel-by-pixel change is classified as increase, no change, or decreased ADC. Finally, fDM metrics, such as overall volumes of decrease or increase in ADC, are calculated.
All aforementioned steps contain operator dependen-cies that may affect the final fDM metrics. Different tests and processes to assess and minimize the effect of these are presented below.
fDM Preprocessing: Registration and ROI Definition
All images (both pre- and posttreatment) were spatially coregistered to the pretreatment T2w images with use of a mutual information-based affine registration using FSL’s linear registration tool (FLIRT; FMRIB, Oxford, UK; http://www.fmrib.ox.ac.uk/fsl/).
Using the same ROIs according to the regional ADC analysis, 2 types of ROI combinations and registration were compared for the fDM approach: (1) a combined ROI from those pixels only included in both pre- and posttreatment-ROIs and (2) pretreatment ROI only— in this case, the affine registration was followed by an ad-ditional nonlinear registration step of the posttreatment diffusion data, also using FSL. The standard settings of FSL’s nonlinear registration tool (FNIRT) were used for comparability with previous studies.19
fDM Metrics
fDMs were computed using in-house software developed in MATLAB R2010a (The MathWorks Inc., Natick, MA, 2010). The fraction of decreased (fdADC) and the fraction of increased (fiADC) ADC were determined in accordance with methods in previous studies.4,15,18
In addition to fiADC and fdADC, we used their ratio fDMratio¼fiADC/(0.01+fdADC), with the 0.01 factor introduced to avoid division by zero in those cases in which there were no decreased diffusion voxels. All the aforementioned metrics were also com-puted for normalized ADC, as described above, to produce corresponding normalized versions: nfiADC, nfdADC, and nfDMratio.
fDM Thresholds
Although ADC thresholds ranging from 0.25 to 0.75× 1023mm2/s have been investigated, previous studies have mostly used 0.5 or 0.4×1023mm2/s4,7,15,18,19,21,22 to define the no-change ADC level. In addition to these 2 standard thresholds and to assess the effect of hetero-geneous imaging protocols that contained different scan-ners, resolution, slice thickness, or diffusion gradient directions, individual fDM thresholds were computed for each possible protocol combination, based on the minimum detectable ADC changes of healthy volunteer data. This allowed us to determine protocol-pair specific thresholds that showed no ADC change for 90%, 95%, and 98% of pixels in a skull-stripped whole-brain ROI. The range and mean values for these thresholds were 0.2 –0.5/0.4×1023mm2/s (90%), 0.3 – 0.8/0.6× 1023mm2/s (95%), and 0.5 –0.9/0.8×1023mm2/s (98%). For same-protocol combinations, the minimum detectable thresholds were similar to the literature,23 and they increased for mixed-protocols. For the normal-ized version of the fDM metrics, all above threshold values were normalized using the same method as for the data itself.
A further modification of the fDM approach, the graded fDM proposed by Ellingson,16 was also tested. In graded fDMs, both decreasing and increasing diffu-sion volumes are subclassified into 3 bins: [0.25 to 0.4, 0.4 to 0.75, above 0.75]×1023mm2/s for increased diffusion and [20.25 to 20.4, 20.4 to 20.75, below 20.75]×1023mm2/s for decreased diffusion.
Nonthresholded Functional Diffusion Maps
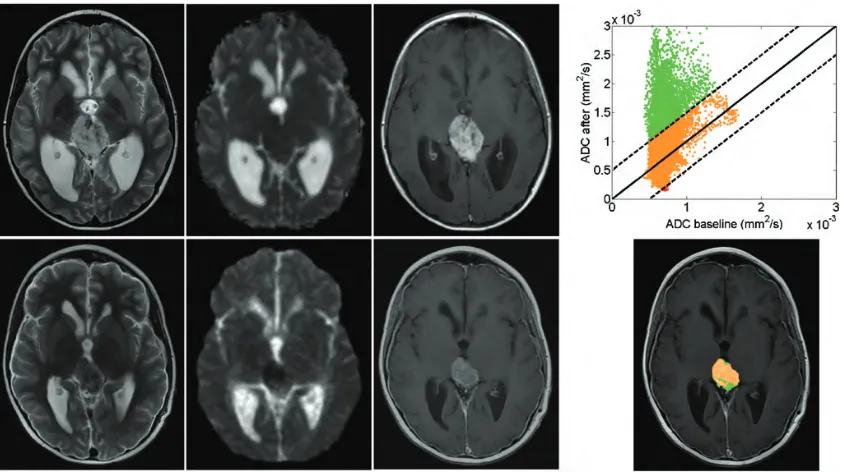
To avoid the problem of empirical fDM threshold se-lection, we analyzed the pre- and posttreatment ADC scatter plot (Fig. 1). This scatter plot has been used previously to show the concept of fDMs, but we are the first to analyze it quantitatively. The 2D distribu-tion of this scatter plot holds informadistribu-tion on tumor heterogeneity and its change, and the direction of largest variance can be computed by PCA. PCA defines orthogonal linear combinations of variables, principal components (PC), which describe the largest amount of variability in the data. In the case of change in pre- and posttreatment ADC values, the first principal component can be used to determine whether the largest variability in ADC values occurs before or after treatment. If the direction of the first principal component describes the same variability before and after treatment (ie, a line y¼mx with a slope m of 1, or an angle of 458), it indicates no change in heterogeneity of ADC values (ie, the spread of ADC values would have been unaffected by treat-ment). A higher slope for the first PC indicates an in-crease in heterogeneity, and a lower slope indicates a decrease in heterogeneity. Therefore, we used the angle of the slope of the first PC on a pre- and post-treatment ADC change scatter plot to calculate the change in tumor ADC heterogeneity (Fig. 2).
at University of Nottingham on November 22, 2016
http://neuro-oncology.oxfordjournals.org/
Statistical Analysis
Statistical analysis was performed using PASW Statistics 18, release version 18.0.0 (SPSS, Inc.). Pairedttests were used to compare differences between both tumor and WM. ADC values calculated using the same imaging protocol differed with those calculated using different pre- and posttreatment protocols. Candidate marker dis-tributions were tested for normality and homogeneity of variance with use of Shapiro-Wilk and Levene’s test. Nonnormally distributed fDM candidate response markers were transformed to normal distributions with use of log transformation (YT¼log10 [Y+1]). Analysis of covariance was used to test for differences in candidate biomarkers between responders and nonre-sponders, using age as covariate. The significance level
was defined as P,.05. Effect sizes were calculated as partial-eta squared (h2). ROC curves were used to deter-mine the best threshold for separating responders and nonresponders for the slope method.
Results
Quality Control
[image:5.594.87.509.57.293.2]Differences between fDM analysis for both observers (M.M. and R.D.) were small, with single-measure intraclass correlation coefficient for either fiADC or fdADC.0.97 on any of the threshold levels. Similarly, the intraclass correlation coefficient for ADCr was 0.94.
Fig. 1. Serial MRI in a patient with pineoblastoma showing partial response to chemotherapy. Top row corresponds to pretreatment and bottom row to posttreatment (1 month) scan data. Left 3 columns: T2, diffusion-weighted and contrast-enhanced T1 images. Right column: fDM scatter plot for each voxel in the ROI (top) and fDM map (bottom); green voxels indicate an increase in diffusion, red voxels indicate a decrease in diffusion, and orange voxels indicate no change.
Fig. 2. fDM scatter plots with direction of first principal component (solid line). Left: fDM for a responding MB, showing a first principal component with high slope, compared with the diagonal (dotted line). Middle: fDM for a responding GBM, showing a first principal component with high slope, and conventional fDM analysis shows a substantial volume of decreased diffusion (dark grey pixels). Right: fDM for a nonresponding PNET, showing a first principal component with low slope. Light gray voxels indicate an increase in diffusion, dark gray voxels indicate a decrease in diffusion, and medium gray voxels indicate no change.
at University of Nottingham on November 22, 2016
http://neuro-oncology.oxfordjournals.org/
[image:5.594.128.468.362.468.2]Regional ADC measures derived from different pro-tocols acquired during the same scan (6 pairs) did not differ significantly (mean difference [range] for tumor: 0.02×1023mm2/s [0.005 – 0.34]×1023and for WM 0.01×1023mm2/s [0.002 – 0.23]×1023).
Treatment Effect
Tumor volumes significantly decreased by a mean of 30% from baseline (mean [range] 26.0 cm3 [3.5 – 60.1]) to the posttreatment scan (17.6 cm3, range [1.8 –49.8]; pairedttestP,.05). There was an overall increase in diffusion due to treatment, with an ADCr increase (mean+SD) of 24%+25% and an nADCr increase of 26%+20%.
Response Prediction
At 6 months after treatment, 12 patients were classed as responders (complete or partial response) and 6 as non-responders (stable or progressive disease) (Table1). At this time, the observed tumor volume decrease was not significantly different (Mann-Whitney, P..05) between responders and nonresponders (Table 2). Baseline ADC measures (mean ADC and normalized mean ADC) were not significantly different between re-sponders and nonrere-sponders (P..05).
Both ADCr and nADCr were higher in responders than in nonresponders. This increase was significant
in nADCr (P¼.03) and not significant in ADCr (Table2).
Conventional fDMs
The best fDMratio to differentiate between responders and nonresponders (P¼.01) was found using the fixed threshold of 0.4×1023mm2/s, affine registration, a combined pre-/post-treatment ROI, and normalized ADC (Table3). fDMratio proved to be robust against use of different threshold levels (using either the variable 98% or 0.4 or 0.5×1023mm2/s), registration method, and ADC normalisation (Table 4). ROC analysis sug-gested an optimum threshold,2.0 for identifying nonre-sponse to treatment using fDMratio (sensitivity¼78%, specificity¼83%). The best fiADC (P¼.02) was also obtained using the 0.4×1023mm2/s threshold, normal-ized ADC, but nonlinear registration. fiADC results were more dependent on image processing than fDMratios (Table4).
fdADC was mostly unable to significantly differenti-ate between responders and nonresponders, as were the candidate biomarkers calculated using the variable 90% and 95% thresholds (Table4).
Similarly, none of the 6 metrics based on volumes of diffusion change (3 decreasing and 3 increasing sub-volumes) for the graded fDM approach significantly differentiated between responders and nonresponders (P..05).
Slope of Nonthresholded fDMs
[image:6.594.59.534.84.195.2]The angle of the slope of the first principal component was higher in responders than in nonresponders (Table 3). This difference using normalized ADC was significant (P¼.01), and the separation between them was clearer than in the thresholded fDM methods (h2¼0.76). ROC analysis suggested an optimum threshold,588for identifying nonresponse to treatment yielding the best accuracy because of slightly better sen-sitivity than fDMratio (sensen-sitivity¼83%, specificity¼ 83%). The slope method using nonnormalised ADC per-formed similarly (P¼.01,h2¼0.68).
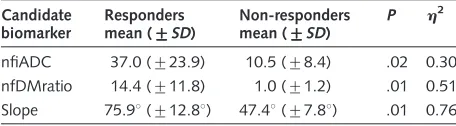
Table 3. Bestperforming fDM-based candidate biomarkers (with nfiADC and nfDMratio calculated using a 0.4×1023mm2/s threshold [normalized], affine registration and pre- and posttreatment ROIs).
Candidate biomarker
Responders mean (+++++SD)
Non-responders mean (+++++SD)
P h2
nfiADC 37.0 (+23.9) 10.5 (+8.4) .02 0.30 nfDMratio 14.4 (+11.8) 1.0 (+1.2) .01 0.51 Slope 75.98(+12.88) 47.48(+7.88) .01 0.76
[image:6.594.60.288.287.350.2]Slope method was calculated using normalized ADC. Abbreviations:h2, partial eta squared; nfDMratio, normalized fDMratio; nfiADC, fraction of increased normalized ADC.
Table 2. Differences between responders and nonresponders in patient demographic characteristics and regional diffusion candidate biomarkers.
Variable Responders mean+++++SD,
or mean [range]
non-responders mean+++++SD, or mean [range]
P h2
Age (years) 9.1 (+4.1) 9.6 (+7.0) NS –
Scan time (weeks after treatment) 6.4 [1.0–16.2] 6.9 [2.4– 12.3] NS –
Volume decrease (%) 33 (+35) 25 (+21) NS –
Baseline ADC (×1023
mm2/s) 1.0 (+0.2) 1.1 (+0.2) NS –
Baseline nADC 1.2 (+0.2) 1.5 (+0.2) NS –
ADCr (% increase) 30 (+27) 2 (+19) 0.08 –
nADCr (% increase) 35 (+23) 3 (+16) 0.03 0.38
Significance and effect size (for significant candidate biomarkers only). Abbreviations: ADCr, ADC ratio;h2, partial eta squared if significant; nADC, normalized ADC; nADCr, normalized ADC ratio; NS, not significant.
at University of Nottingham on November 22, 2016
http://neuro-oncology.oxfordjournals.org/
Discussion
We investigated the suitability of various serial diffusion metrics to predict treatment response in children with high-grade brain tumors who had undergone heteroge-neous clinical diffusion protocols. Separation of treat-ment responders and nonresponders was feasible at 8-week intervals with most diffusion metrics, with best results (83% accuracy) achieved for a novel slope of the first principal component followed by the ratio of voxels with increased over decreased diffusion. This suggests that increase in diffusion heterogeneity and preferential increase in diffusivity are associated with treatment response. These results are in line with the scarce previous work in the pediatric literature.13,24
As expected, fDM metrics yielded higher effect sizes than regional ADC changes. Regional ADC changes were only significantly higher in responders than in non-responders when normalized to white matter. This nor-malization step was not necessary for significance in the fDM metrics, thus avoiding the introduction of age dependence because of white matter maturation or a nonspecific treatment effect on white matter diffusivity.
fDM Metrics
We found that fDMratio, which combines information from both fdADC and fiADC, produced the best results, compared with previously proposed functional diffusion metrics. fdADC and fiADC results have been published on high-grade tumor gliomas, with changes in fdADC (but not fiADC) indicative of overall survival in patients after cytotoxic or anti-angiogenic treat-ment.15,17 In contrast, fiADC (but not fdADC) has been shown to predict overall survival in the same type of tumor after similar imaging protocols except radio-therapy.18,25 One might speculate that a combined
marker such as fDMratio might prove to be more robust to treatment type. We confirmed that registra-tion19 and ROI selection16,19 and choice of threshold values14 can affect the performance of response
prediction. The diagnostic accuracy of the best discrimi-nating metric, fDMratio, was largely unaffected by the different applied methodologies, such as the use of differ-ent threshold levels, ROI selection, registration method, or ADC normalization (Table4).
fDM Thresholds
Both fixed thresholds of 0.5 and 0.4×1023mm2/s and the variable 98% threshold were sensitive to detecting the clinical response status, and lower variable thresh-olds (90% and 95%) were not. For the imaging protocol combinations tested here, the 98% threshold reflects in-dividual threshold values of 0.2 –0.5×1023mm2/s. The graded fDM approach suggests that intermediate diffusion decreases at 0.25 – 0.4×1023mm2/s would be more sensitive to relevant biological change in tumor cellularity, as opposed to change in nonspecific edema.16 This could not be replicated in this study (neither for decreased nor increased diffusion subvo-lumes), perhaps because of a more heterogeneous dataset.
Slope of Nonthresholded fDM
[image:7.594.58.535.84.222.2]To quantify the information of the fDM scatter plots without using empirical thresholds, we investigated the diagnostic value of the slope of the first principal compo-nent. This way, we determined the change in largest data variability, which proved to be the best indicator of treatment response among all the fDM-based methods. The slope of the first PC afforded clinically useful dis-crimination of 83% with use of an angle of 588 as cutoff. Of importance, prediction of tumor response to treatment with use of nonthresholded fDMs eliminates the need to define a diffusion change threshold, which is dependent on a number of factors that cannot always be controlled and is difficult to generalize. For example, one of the problems with nonrigid registration fDMs is that the literature standard thresholds calculat-ed on nondeformcalculat-ed data14should be recalculated using
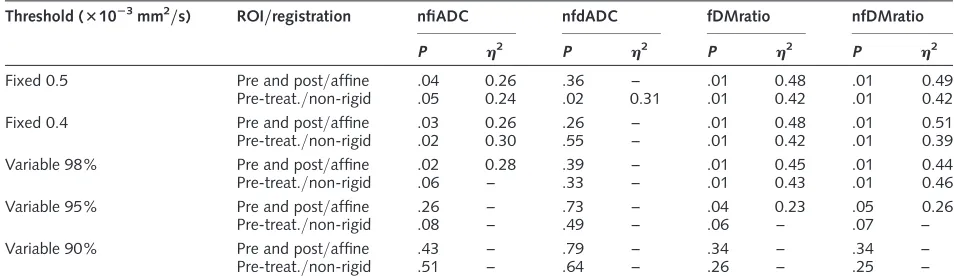
Table 4. Functional diffusion mapping for predicting response in pediatric high-grade tumors: effects of different metrics and postprocessing steps.
Threshold (31023mm2/s) ROI/registration nfiADC nfdADC fDMratio nfDMratio
P h2 P h2 P h2 P h2
Fixed 0.5 Pre and post/affine .04 0.26 .36 – .01 0.48 .01 0.49
Pre-treat./non-rigid .05 0.24 .02 0.31 .01 0.42 .01 0.42
Fixed 0.4 Pre and post/affine .03 0.26 .26 – .01 0.48 .01 0.51
Pre-treat./non-rigid .02 0.30 .55 – .01 0.42 .01 0.39
Variable 98% Pre and post/affine .02 0.28 .39 – .01 0.45 .01 0.44
Pre-treat./non-rigid .06 – .33 – .01 0.43 .01 0.46
Variable 95% Pre and post/affine .26 – .73 – .04 0.23 .05 0.26
Pre-treat./non-rigid .08 – .49 – .06 – .07 –
Variable 90% Pre and post/affine .43 – .79 – .34 – .34 –
Pre-treat./non-rigid .51 – .64 – .26 – .25 –
Significance and effect size (for significant metrics only). Abbreviations: fDMratio, fiADC to fdADC ratio;h2, partial eta squared; nfdADC, fraction of decreased normalized ADC; nfDMratio, normalized fDMratio; nfiADC, fraction of increased normalized.
at University of Nottingham on November 22, 2016
http://neuro-oncology.oxfordjournals.org/
the nonrigid registration method, because their suitabil-ity largely depends on the extent of the deformation that is applied. These thresholds would need to be recalculat-ed for any changes on the deformation parameters or al-gorithm. The new approach of determining the slope of nonthresholded fDMs eliminates this problem.
Limitations
There are several limitations of the current study. We only studied a small and heterogeneous sample size, a common problem in single-center pediatric studies that reflects the relative low incidence of pediatric brain tumors (3 per 100 000 children per year).26 This problem is aggravated by heterogeneous tumor types, presence of postsurgical residue, treatment protocols, and follow-up intervals. Thus, our presented findings have to be considered as preliminary but are likely to be more representative of clinical settings and may even address some multi-center scanner and protocol variability. Nevertheless, despite these limitations, we were able to clearly separate responders from nonre-sponders with a range of serial diffusion metrics. One may speculate that, with more homogeneous image ac-quisition and tumor type sample, it may be possible to further stratify responders into complete and partial re-sponse and nonresponders into stable and progressive disease with use of fDM biomarkers, which was not pos-sible in this dataset.
Moreover, we included datasets relatively long after treatment initiation (median, 9 weeks; range, 1–16 weeks), in contrast to fDM adult studies assessed at 318 or 6 weeks.16 At longer intervals, fDM analysis becomes less relevant as volume reduction in responders becomes visible in conventional MR. Although our study cannot be extrapolated to earlier time points, a pre-vious pediatric study suggested that changes in ADC can predict radiotherapy response as early as one week.10
An important question for our heterogeneous clinical dataset was to assess and, if need be, control for the effect of using a mix of ADC maps from 15-direction DTI to single-direction DWI. For those patients in whom both different and same pre- and posttreatment protocols were available, the differences in fDM bio-markers were found to be not significant. Because this was only a limited small subgroup of the data, the effect was further investigated by using normalized ADC values and by using fDM thresholds specific to
each pre- and posttreatment protocol. Although stand-ardization of protocols is clearly preferable, our study provides some evidence that mixing of protocols is feasi-ble and did not mask differential treatment effects in re-lation to clinical response.
There is increasing evidence that diffusion metrics may contribute to differentiate true progression from pseudo-progression. In this study, there were 3 patients with increased enhancing tumor volume who were later classified as responders. Two of these were correct-ly classed as responders with use of fDM metrics. However, these are only small numbers with variable time intervals and variable treatments, factors that will affect the prevalence and detection of pseudo-progression.
Conclusion
To the best of our knowledge, this is the first study that investigated the use of fDM-based biomarkers of treat-ment response in pediatric high-grade brain tumors. Even in the presence of clinical and technical heterogene-ity, our results suggest that fDM techniques are superior to regional ADC change assessment and provide suitable imaging biomarkers to predict tumor response. A new fDM analysis technique based on the slope of the first principal component yielded the best results with an overall diagnostic accuracy of 83% to separate respond-ers from nonrespondrespond-ers.
Acknowledgments
We thank Rose English, for data collection; James Lowe and Keith Robson, for histopathological analysis; and Gill Glen, for data management.
Funding
This work was supported by the Cancer Research-UK and Engineering and Physical Sciences Research Council Cancer Imaging Programme at the Children’s Cancer and Leukaemia Group (CCLG), England (C7809/A10342 and C7809/A10342[in association with the MRC and England Department of Health]).
Conflict of interest statement. None declared.
References
1. Therasse P, Arbuck SG, Eisenhauer EA, et al. New guidelines to evaluate the response to treatment in solid tumors. European
Organization for Research and Treatment of Cancer, National Cancer Institute of the United States, National Cancer
Institute of Canada. J Natl Cancer Inst. 2000;92(3): 205 – 216.
2. Macdonald DR, Cascino TL, Schold SC, Jr., Cairncross JG. Response criteria for phase II studies of supratentorial malignant glioma.J Clin
Oncol. 1990;8(7):1277 – 1280.
3. Wahl RL, Jacene H, Kasamon Y, Lodge MA. From RECIST to PERCIST: Evolving Considerations for PET response criteria in solid tumors.J Nucl
Med. 2009;50(Suppl 1):122S – 150S.
at University of Nottingham on November 22, 2016
http://neuro-oncology.oxfordjournals.org/
4. Moffat BA, Chenevert TL, Lawrence TS, et al. Functional diffusion
map: a noninvasive MRI biomarker for early stratification of clinical brain tumor response. Proc Natl Acad Sci USA. 2005;102(15):
5524 – 5529.
5. Tsien C, Galban CJ, Chenevert TL, et al. Parametric response map as an imaging biomarker to distinguish progression from pseudoprogression
in high-grade glioma.J Clin Oncol. 2010;28(13):2293 – 2299.
6. Vaidya SJ, Payne GS, Leach MO, Pinkerton CR. Potential role of magnetic resonance spectroscopy in assessment of tumour response
in childhood cancer. European Journal of Cancer. 2003;39(6): 728 – 735.
7. Hamstra DA, Chenevert TL, Moffat BA, et al. Evaluation of the
func-tional diffusion map as an early biomarker of time-to-progression and overall survival in high-grade glioma. Proc Natl Acad Sci USA.
2005;102(46):16759 – 16764.
8. Huang CF, Chiou SY, Wu MF, Tu HT, Liu WS, Chuang JC. Apparent diffu-sion coefficients for evaluation of the response of brain tumors treated by
Gamma Knife surgery.J Neurosurg. 2010;113(Suppl):97–104.
9. Li Y, Lupo JM, Polley M-Y, et al. Serial analysis of imaging parameters in patients with newly diagnosed glioblastoma multiforme.Neuro Oncol.
2011;13(5):546 – 557.
10. Mardor Y, Pfeffer R, Spiegelmann R, et al. Early Detection of Response to Radiation Therapy in Patients With Brain Malignancies Using
Conventional and High b-Value Diffusion-Weighted Magnetic Resonance Imaging.Journal of Clinical Oncology. 2003;21(6):1094–1100.
11. Prabhu SP, Ng S, Vajapeyam S, et al. DTI assessment of the brainstem
white matter tracts in pediatric BSG before and after therapy: a report from the Pediatric Brain Tumor Consortium. Childs Nerv Syst.
2011;27(1):11 – 18.
12. Chen HJ, Panigrahy A, Dhall G, Finlay JL, Nelson MD, Jr., Bluml S. Apparent diffusion and fractional anisotropy of diffuse intrinsic brain
stem gliomas.AJNR Am J Neuroradiol. 2010;31(10):1879– 1885.
13. Schubert MI, Wilke M, Muller-Weihrich S, Auer DP. Diffusion-weighted magnetic resonance imaging of treatment-associated changes in
recur-rent and residual medulloblastoma: preliminary observations in three children.Acta Radiol. 2006;47(10):1100 – 1104.
14. Ellingson BM, Malkin MG, Rand SD, et al. Validation of functional
dif-fusion maps (fDMs) as a biomarker for human glioma cellularity.
Journal of Magnetic Resonance Imaging. 2010;31(3):538 – 548.
15. Ellingson BM, Malkin MG, Rand SD, et al. Volumetric analysis of
func-tional diffusion maps is a predictive imaging biomarker for cytotoxic and anti-angiogenic treatments in malignant gliomas. J Neurooncol.
2011;102(1):95 – 103.
16. Ellingson BM, Cloughesy TF, Lai A, et al. Graded functional diffusion
map-defined characteristics of apparent diffusion coefficients predict overall survival in recurrent glioblastoma treated with bevacizumab.
Neuro Oncol. 2011;13(10):1151 – 1161.
17. Ellingson BM, Cloughesy TF, Zaw T, et al. Functional diffusion maps (fDMs) evaluated before and after radiochemotherapy predict
progression-free and overall survival in newly diagnosed glioblastoma.
Neuro Oncol. 2012;14(3):333 – 343.
18. Hamstra DA, Galban CJ, Meyer CR, et al. Functional diffusion map as
an early imaging biomarker for high-grade glioma: correlation with con-ventional radiologic response and overall survival. J Clin Oncol.
2008;26(20):3387 – 3394.
19. Ellingson BM, Cloughesy TF, Lai A, Nghiemphu PL, Pope WB. Nonlinear registration of diffusion-weighted images improves clinical
sensitivity of functional diffusion maps in recurrent glioblastoma treated with bevacizumab. Magnetic Resonance in Medicine.
2012;67(1):237 – 245.
20. Wen PY, Macdonald DR, Reardon DA, et al. Updated response assess-ment criteria for high-grade gliomas: response assessassess-ment in
neuro-oncology working group.Journal of Clinical Oncology. 2010;28(11): 1963 – 1972.
21. Lee KC, Bradley DA, Hussain M, et al. A feasibility study evaluating the
functional diffusion map as a predictive imaging biomarker for detec-tion of treatment response in a patient with metastatic prostate
cancer to the bone.Neoplasia. 2007;9(12):1003 – 1011.
22. Moffat BA, Chenevert TL, Meyer CR, et al. The functional diffusion map: an imaging biomarker for the early prediction of cancer treatment
outcome.Neoplasia.2006;8(4):259– 267.
23. Harris AD, Govindaraj M, Frayne R. Minimum detectable difference of MR diffusion maps in acute ischemic stroke. Journal of Magnetic
Resonance Imaging.2008;27(3):629 – 633.
24. Chenevert TL, Stegman LD, Taylor JMG, et al. Diffusion magnetic res-onance imaging: an early surrogate marker of therapeutic efficacy in
brain tumors. Journal of the National Cancer Institute. 2000;92(24):2029 – 2036.
25. Galban CJ, Chenevert TL, Meyer CR, et al. Prospective analysis of
parametric response map-derived MRI biomarkers: identification of early and distinct glioma response patterns not predicted by
standard radiographic assessment. Clin Cancer Res. 2011;17(14): 4751 – 4760.
26. Arora RS, Alston RD, Eden TO, Estlin EJ, Moran A, Birch JM.
Age-incidence patterns of primary CNS tumors in children, adolescents, and adults in England.Neuro Oncol. 2009;11(4):403 – 413.
at University of Nottingham on November 22, 2016
http://neuro-oncology.oxfordjournals.org/