Bicycle infrastructure preferences – A case study of Dublin
Elaine Brick AECOM Grand Canal House Upper Grand Canal Street
Dublin 4 Ireland
Tel: +353 1 238 3100 Fax: +353 1 238 3199 Email: [email protected]
Orla Thérèse McCarthy
Department of Civil, Structural and Environmental Engineering Trinity College Dublin
Dublin 2 Ireland Tel: +353 1 8962537 Fax: +353 1 6773072 Email: [email protected]
Brian Caulfield*
Department of Civil, Structural and Environmental Engineering Trinity College Dublin
Dublin 2 Ireland Tel: +353 1 8962534 Fax: +353 1 6773072 Email: [email protected]
*Corresponding Author
Submitted: 14th November 2011
ABSTRACT
This paper examines infrastructure preferences for cyclists. While the culture of cycling in the UK and Ireland has experienced some growth over the past decade, particularly in the urban areas, much debate exists as to the most favourable infrastructure types to promote cycling. In Ireland, the Irish National Cycle Policy Framework acknowledges that investment in cycling infrastructure type and quality has been ‘in many cases, inadequate’ and has, generally, not led to an overall increase in cycling numbers. Therefore, in order to ensure future investment is targeted where it is likely to be most effective in achieving adopted mode share targets for cycling, the following research has been undertaken to determine the factors which most influence cycling route choice. In particular, the research aims to determine the factors, which have greatest influence on cycle route infrastructure preference the correlation between the level of cycling confidence and preferred types of infrastructure and route characteristics.
A stated preference survey, undertaken by almost 2,000 cyclists and non-cyclists, was used to gauge preferences for a range of infrastructure types and route characteristics. Results from the survey were compared against individual characteristics, such as age, gender and level of cycling confidence. This comparison provides the authors with a robust data set to determine infrastructure types, which are most likely to influence a mode shift to cycling.
Results from the survey supports similar research undertaken internationally, travel time is the most critical factor in determining route choice. The second most critical factor was infrastructure type. Facilities which were segregated from traffic were the most preferred form of cycling infrastructure, regardless of cycling confidence. Interestingly, routes through residential streets and parks were the second most favoured, where no specific infrastructure is provided with the exception of improvements in way-finding. Routes which offered no facilities were least favoured and least likely to support a shift to cycling. Combined bus/cycle lanes were also negatively viewed, again regardless of cycling confidence. Unsurprisingly, the research demonstrates that cyclists and non-cyclists are most likely to choose routes with the least amount of junctions. This is also demonstrated regardless of the level of cycling confidence. The research is the first to look at the relationship between route preference and cyclist volumes and concludes that cyclists with little confidence in cycling are most likely to choose routes with a higher volume of cyclists while confident cyclists, whose value of time is high, are likely to choose routes which present minimal delay and therefore fewer cyclists.
INTRODUCTION AND BACKGROUND
Transport policy across Europe in the past ten years has made a significant shift to sustainable transport objectives and targets which are clearly linked to environmental and economic objectives. In Ireland, Smarter Travel, the National Sustainable Transport Policy marks a significant departure from previous national policies for transport. This plan has a greater focus to strengthening Ireland’s road and public transport networks (1). The strategy highlights the implications of future growth projections on the Irish transport network: increasing car ownership and annual vehicle kilometres travelled, declining average speeds in commuting periods and increasing congestion amidst a decline in walking and cycling modal share. In light of these forecasts, the strategy sets out bold travel targets supported by a 48 actions for implementation, ranging from infrastructure to policy and education measures. The overall target is to reduce work related commuting by car from a current modal share of 65% to 45%. In addition, it is envisaged that total vehicle kilometres travelled by car will not increase substantially from a 2009 baseline (1).
These targets are challenging and highlight the need for a robust response in terms of policy and investment. The Strategy therefore sets out separate objectives and targets for walking, cycling and public transport. In relation to cycling, the Strategy aims to secure a ‘strong culture of cycling in Ireland and ensure that all cities, towns, villages and rural areas will be cycle-friendly’ (1). The strategy envisages that by 2020, 10% of all our trips will be by bike. In relation to commuting, the Strategy envisages that by 2020 cycle trips to work will have increased to 160,000 from a 2006 baseline of 35,000.
To encourage delivery of the Smarter Travel vision, the National Cycle Policy Framework was adopted in 2009 (2). The Framework is clear on the challenges, which lie ahead by acknowledging that investment in cycling infrastructure has been inadequate and has not led to an overall increase in cycling. The Framework presents a robust package of measures classified into the following categories: Planning, Infrastructure, Communication and Education.
With regards infrastructure design, the National Cycle Policy Framework also reiterates the need for transportation infrastructure design to be ‘cycle friendly’. ‘Cycle friendly’ routes are defined as those that are deemed to be: safe, direct, coherent, attractive and comfortable. These five criteria frequently form the basis of cycling infrastructure policies internationally and are also identified in the National Cycle Manual (3) as being the five ‘basic needs’ of cyclists which should be understood by designers if ‘cycle friendly’ environments are to be created (3).
A parallel decision to be made in the planning and design process is whether cycling facilities should be integrated with vehicular traffic or mixed. This decision is one which critically shapes our cycle network and, arguably, divides opinions about the most appropriate form of infrastructure among cyclists as well as non-cyclists.
While the guidelines provide a guide to practioners, it is apparent that preference for type of cycling facility can vary widely depending on age, gender and cycling confidence among other factors. The perceptions of cyclists and non-cyclists about the interpretation of ‘cycle friendly’ seems to vary considerably. Even among cyclists, there is little consistency with regards a ‘preferred’ infrastructure type (4). Providing cycling infrastructure to attract a maximum amount of existing and new users therefore becomes much more challenging than initially perceived. This challenge is one, which requires further investigation to ensure that current and future investment in cycling infrastructure will effectively contribute to the creation of ‘cycle-friendly’ urban areas and targets for cycling mode share can be met.
In recognition of the challenges identified in planning and designing infrastructure for cyclists, the following research aims to establish the factors, which influence cycle route choice and how these factors vary between individuals. The research will conclude on how the identified route choice preferences could impact on cycle route infrastructure design and in turn, a modal shift to cycling.
LITERATURE REVIEW
Cycle route preference studies completed to date have included a range of factors including: degree of segregation from traffic, the volume of traffic, vehicle speed, on street parking and surface quality. These route factors are analysed in relation to individual characteristics such as age, gender and income.
Stinson and Bhat (6) investigated the impact of 11 different route choice determinants and concluded that lower travel times, lower traffic volumes and the degree of segregation from vehicular traffic are the three most important factors in determining route choice. Similarly, analysis undertaken by Hunt and Abraham (5) concluded that:
• Sensitivity to cycle trip time varies substantially depending on the type of cycling facility, and
• Sensitivity to cycle times on different types of infrastructure varies with level of cycling experience and comfort in mixed traffic.
These findings confirm that in order for investment in cycling infrastructure to return positive benefits, it has to consider the needs of ultimate end users in order to further promote cycling.
Garrard et al (8) carried out a survey of cyclists at 15 locations, which showed nearly 80% of cyclists observed were male. Males were in the majority at each location observed and females preferred segregated cycle facilities. The authors concluded that the provision of facilities, which offer a good degree of separation from motorised traffic, was likely to be an important factor in increasing the number of women who choose to commute by bicycle.
roads are main roads, then the same speed limit must apply but the layout of the street must be altered to improve safety for cyclists.
The report ‘London Greenways Monitoring Report 2009 – Shared-use route usage and trends’ (15) documents the results of monitoring carried out on specific greenways in London. The purpose is to identify the extent to which greenways in London have benefited their users. Among the results documented are the reasons for the trips, as well as the reason for the users’ choice of route. The monitoring was carried in 2009, using “route user surveys” on Greenways in London. The report reveals that 91% of people cycling on monitored greenways in London were influenced in their choice by the “quality” of the surroundings. However, the same percentage of respondents felt safe on the greenways. On the monitored greenways, 9% of cyclists were under the age of 16 and 42% of trips were made by women. One of the major advantages of the Greenways scheme is the fact that they are, for the most part, traffic free, (15, 16) as motorised traffic can be off-putting for cyclists (17, 14).
A review of recent route choice analysis research therefore provides useful guidance on cycle network planning and design. However, in terms of influencing mode shift, the research provides little guidance on the types of infrastructure which are likely to increase the number of new cyclists while also satisfying the needs of existing cyclists. Indeed, previous research has not clarified whether there is a conflict between these two objectives. The current research therefore aims to provide more detail on the relationship between cycle route preference and cycling confidence. In addition, the paper investigates the relationship between cyclist volumes and route choice which has not been looked at in this context previously.
METHODOLOGY
Stated Preference Model
As highlighted in the previous section, a considerable amount of research has been completed to determine the factors most likely to impact on cycle route preference. These studies have been undertaken in two broad categories: (a) Aggregate level research which considers the overall impact of cycle route type on cyclist behaviour, for example, the increase in cycle volumes post project implementation, and (b), Disaggregate level research which is undertaken at the individual level and allows the researcher to analyse in more detail, the relationship between cycle route preference and supporting determinants. The current study takes the form of the latter with stated preference chosen as the most effective way of completing the research (5, 6, 7).
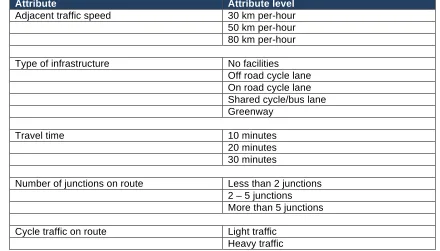
TABLE 1 Attributes and attribute levels examined through the route choice model
Attribute Attribute level
Adjacent traffic speed 30 km per-hour
50 km per-hour 80 km per-hour
Type of infrastructure No facilities
Off road cycle lane On road cycle lane Shared cycle/bus lane Greenway
Travel time 10 minutes
20 minutes 30 minutes
Number of junctions on route Less than 2 junctions
2 – 5 junctions More than 5 junctions
Cycle traffic on route Light traffic
Heavy traffic
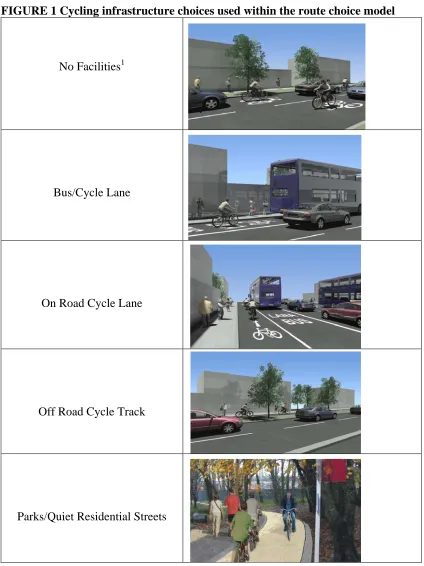
FIGURE 1 Cycling infrastructure choices used within the route choice model
No Facilities1
Bus/Cycle Lane
On Road Cycle Lane
Off Road Cycle Track
Parks/Quiet Residential Streets
A fractional factorial was designed which included two routes each which had the same attributes but differed on the attribute levels. A fractional factorial was designed using the method described in Hensher et al (18). The fractional factorial design produced 64 scenarios to be evaluated. These scenarios were randomly distributed to 11 versions of the survey, with 10 versions of the survey containing 6 scenarios to evaluate and 1 with 4 scenarios.
1
As the respondents may not be familiar with the variants of cycle lane presented in the scenarios, it was decided to make these scenarios as visual as possible. An example of one of the scenarios is shown in Figure 2. The following text was used to set up the scenarios presented to the respondents.
“You have started a new job, which is located close to your home. Cycling to work has now become a possibility. Whether you currently cycle to work or not, please consider the following route choices for your trip to work and choose the most preferable route for your journey to work in each instance”.
FIGURE 2 Cycle route options as presented to survey respondents
A multinomial logit model was used to estimate the impact of each of the attributes presented in Table 1. The model takes the following functional form:
(1)
where n represents the route choice option and i represents the individual. Xin
represents the set of explanatory variables specific to route option n and by individual i. Uin is the utility obtained by individual i and εin is a random error term, which is
assumed to be identically and independently distributed using the Gumbel distribution method (19).
The probability that individual i chooses route n can be expressed as follows:
Prob (Uin>Ujn)=
e!Xin
(e!Xin+e!Xjn )
The above equation states that the individual will choose route n over the other route (j) providing the utility that’s derived from this route is greater than the alternative route. The models estimated using a maximum likelihood estimation approach (see 18, 19 or 20 for more details on this approach). Several models are presented in the next section, some of the models have been segmented by various attributes such as gender, age etc. The models were segmented to provide an indication as to how various characteristics of the respondents’ impact upon their route choice selection.
Data collection
The survey was undertaken by 1,941 people employed in businesses participating in the Smarter Travel Workplaces initiative, currently being managed by the Irish National Transport Authority. The businesses are all located within an 8km (5 miles) radius of the city centre.
RESULTS
Descriptive results
Table 2 presents descriptive results of the sample collected. The gender balance of respondents was relatively balanced, 51.8% male and 48.2% female. 45.7% of respondents were in the 25-34 age group and 26.1% in the 35-44 age group. 51.8% of the sample was shown to have one car and 31.2% had two cars in their household. The results for mode of transport used to travel to work showed that just under 30% of the sample drove alone on a regular basis to work. 14.9% indicated they walked and 18.1% said they cycled to work on a regular basis. The final result presented in Table 2 details the distance travelled to work. 9% travelled less that 2km (1.2 miles) and 21.8% travelled 3-5km (1.8-3.1miles).
TABLE 2 Descriptive results
Gender N %
Male 1006 51.8
Female 935 48.2
Total 1941 100
Age
18-24 203 10.5
25-34 888 45.7
35-44 507 26.1
45-54 252 13.0
55-64 87 4.5
65+ 4 .2
Total 1941 100.0
Number of cars per household
No car available 244 12.6
1 1006 51.8
2 605 31.2
2+ 86 4.4
Total 1941 100.0
Mode of transport used to travel to work
Walk 289 14.9
Cycle 351 18.1
Bus 265 13.7
Rail 358 18.4
Car - driver 569 29.3
Car - passenger 74 3.8
Motorcycle 33 1.7
Work from home 2 .1
Total 1941 100.0
Distance travelled to work
0-2km (0 – 1.2 miles) 175 9.0
3-5km (1.8-3.1 miles) 423 21.8
6-9km (3.7 – 5.6 miles) 462 23.8
10-15km (6.2 – 9.3 miles) 444 22.9
16km+ (10 miles +) 437 22.5
Total 1941 100.0
TABLE 3 Which of the following measures would encourage you to begin cycling or to cycle more?
Yes No
More dedicated, off road cycle tracks (for example, through parks or beside main roads)
1439 (74.1%) 502 (25.9%)
More connected on-road cycle lanes 1094 (56.4%) 847 (43.6%)
Better facilities at work (lockers and showers for example) 812 (41.8%) 1129 (58.2%)
Better signage 122 (6.3%) 1819 (93.7%)
Increased and secure bike parking 757 (39%) 1184 (61%)
Better information about local cycling routes 438 (22.6%) 1503 (77.4%)
Less traffic 600 (30.9%) 1341 (69.1%)
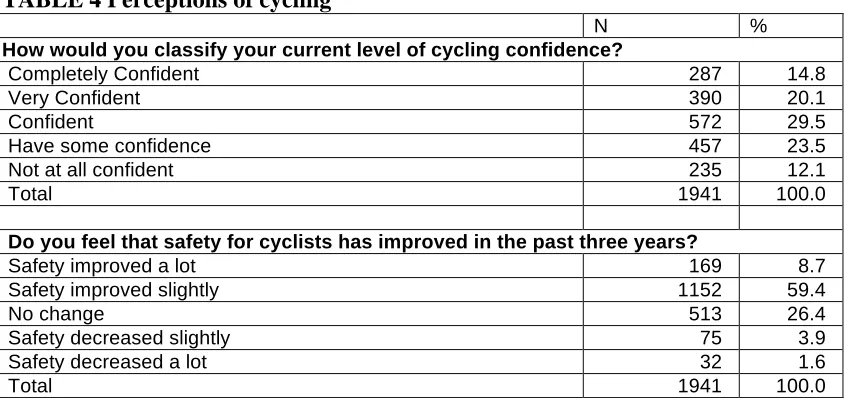
In the survey respondents were asked how confident they were cycling in Dublin. The results show that 14.8% indicated that they were completely confident and 20.1% said they were very confident (see Table 4). The respondents were also asked had cycle safety changed in Dublin in the past three years. 8.7% said safety had improved a lot and 59.4% said that it has improved slightly.
TABLE 4 Perceptions of cycling
N %
How would you classify your current level of cycling confidence?
Completely Confident 287 14.8
Very Confident 390 20.1
Confident 572 29.5
Have some confidence 457 23.5
Not at all confident 235 12.1
Total 1941 100.0
Do you feel that safety for cyclists has improved in the past three years?
Safety improved a lot 169 8.7
Safety improved slightly 1152 59.4
No change 513 26.4
Safety decreased slightly 75 3.9
Safety decreased a lot 32 1.6
Total 1941 100.0
Route choice models
This section of the paper presents the results from the route choice models. The first model presented in Table 5 contains the results of the base model, which includes all of the respondents in the sample. The first set of coefficients examines the impact adjacent traffic speed has upon route choice. The findings show that respondents had a greater preference for lower adjacent traffic speeds as the 30KM per-hour (19 miles per-hour) coefficient has the highest positive value. The second set of coefficients measure the impact that the cycle route type has upon route choice. The results show that both the ‘cycle/bus lane’ and the ‘no-lane’ options both had significant negative coefficients indicating that respondents are unlikely to select a route option if it has this type of route infrastructure. The ‘off road cycle lane’ option was found to have the highest positive coefficient followed by the ‘greenway’ option, this result indicates that respondents are more likely to choose a route that has one of these infrastructures.
[image:11.595.89.512.312.511.2]of junctions that the respondent would encounter while cycling along the route was examined to determine if this would significantly impact upon respondents’ utility. The findings show that respondents are more likely to choose a route that has fewer junctions with the ‘less than 2 junctions’ coefficient having the highest positive value. The final set of coefficients presented in Table 5 relates the amount of cycle traffic along the route. The findings show that respondents have a slight preference for light traffic while cycling along the route.
Segmented Route Choice Results
TABLE 5 Base model and results segmented by gender
Base model Male Female
Intercept -1.388** -1.260** -1.549**
Adjacent Traffic Speed
30KM per-hour (19 miles per-hour) .788** .635** .921**
50KM per-hour (31 miles per-hour) .535** .436* .611**
80KM per-hour (49 miles per-hour) Ref Ref Ref
Cycle Route Type
Cycle/bus lane -.792** -.844** -.736*
Greenway .202* .146* .346**
No – lane -1.116** -1.060** -1.167**
Off road cycle lane .449** .340** .597**
On-road cycle lane Ref Ref Ref
Travel Time
10 minutes 1.353** .923** 1.150**
20 minutes .240* .306** .230**
30 minutes Ref Ref Ref
Number of Junctions
Less than 2 junctions 1.050** .923** 1.150**
2 to 5 junctions .419** .306** .230**
More than 5 junctions Ref Ref Ref
Cycle Route Traffic
Light traffic .083** .149** .044**
Heavy traffic Ref Ref Ref
Number of cases 11,692 5742 5298
R-squared .262 .270 .262
Log likelihood 983.34 786.43 456.09
** Significant at 1%, * Significant at 5%
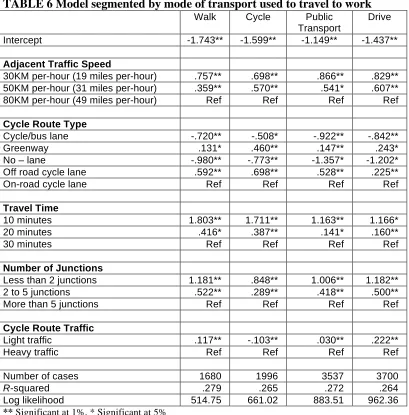
Table 6 presents four route choice models which have been segmented by the mode of transport the respondent indicated that the currently use to travel to work. The modes of transport used are grouped into four categories, with the public transport category including all those that take bus or rail, and drive including those that drive alone and those that are passengers. The ‘adjacent traffic speed’ variables show that cyclist have the lowest preference for a 30KM per-hour (19 miles per-hour) speed limit and that those who currently drive or take public transport have the greatest preference for a lower speed limit. The results for the type of cycle route present some interesting findings. The findings are consistent with those presented in the base model in Table 5. However, it is worth noting that of the route types shown to have an associated negative utility, cyclists were shown to have the lowest negative utility. This indicates that cyclists are more willing to accept these route types relative to the other commuter groups.
counterparts. This finding may relate to the experience this user group would have in manoeuvring junctions on a bicycle. The final set of variables examined in Table 9 relates to the relative the user groups’ preferences for traffic volumes on the cycle routes. As with the results in the base model in Table 5 most of the user groups had a slight preference for light traffic on the route, with walkers having a strong preference for light traffic. Interestingly the model estimated for cyclists demonstrates that this user group has a preference for heavy traffic on the cycle route. One possible explanation for this result may be that cyclists may have a higher preference for heavy traffic as cyclist may feel that there is safety in numbers.
TABLE 6 Model segmented by mode of transport used to travel to work
Walk Cycle Public
Transport
Drive
Intercept -1.743** -1.599** -1.149** -1.437**
Adjacent Traffic Speed
30KM per-hour (19 miles per-hour) .757** .698** .866** .829**
50KM per-hour (31 miles per-hour) .359** .570** .541* .607**
80KM per-hour (49 miles per-hour) Ref Ref Ref Ref
Cycle Route Type
Cycle/bus lane -.720** -.508* -.922** -.842**
Greenway .131* .460** .147** .243*
No – lane -.980** -.773** -1.357* -1.202*
Off road cycle lane .592** .698** .528** .225**
On-road cycle lane Ref Ref Ref Ref
Travel Time
10 minutes 1.803** 1.711** 1.163** 1.166*
20 minutes .416* .387** .141* .160**
30 minutes Ref Ref Ref Ref
Number of Junctions
Less than 2 junctions 1.181** .848** 1.006** 1.182**
2 to 5 junctions .522** .289** .418** .500**
More than 5 junctions Ref Ref Ref Ref
Cycle Route Traffic
Light traffic .117** -.103** .030** .222**
Heavy traffic Ref Ref Ref Ref
Number of cases 1680 1996 3537 3700
R-squared .279 .265 .272 .264
Log likelihood 514.75 661.02 883.51 962.36
** Significant at 1%, * Significant at 5%
‘greenways’ and ‘off road cycle lanes’.
[image:15.595.82.519.225.680.2]The findings for the travel time showed that there was very little difference between the user groups, but that all respondents had a desire for lower travel times. The findings for the number of junctions encountered along the route showed that those respondents that were ‘not at all confident’ cyclists were shown to have the greatest preference for lower numbers of junctions along the route. The final set of results presented in Table 7 estimate the impact that the volume of cycling traffic has along the route. The findings suggest that those respondents with lower levels of cycling had a greater preference for lower traffic volumes along the route.
TABLE 7 Model segmented by cycling ability
Completely confident
Very confident
Confident Have
some confidence
Not at all confident
Intercept -1.821** -1.398** -1.255** -1.289** -1.519**
Adjacent Traffic Speed
30KM hour (19 miles per-hour)
.801** .536** .923** .728** 1.023**
50KM hour (31 miles per-hour)
.712** .395** .599** .393** .570**
80KM hour (49 miles per-hour)
Ref Ref Ref Ref Ref
Cycle Route Type
Cycle/bus lane -.610** -.875** -.774** -.828** -.768**
Greenway .327** .073** .146* .295** .756**
No – lane -.888** -1.022** -1.269** -1.147**
-1.269**
Off road cycle lane .423** .353** .363** .683* .566*
On-road cycle lane Ref Ref Ref Ref Ref
Travel Time
10 minutes 1.794** 1.817** 1.102** 1.128** 1.197**
20 minutes .455** .410** .312** .249** .250**
30 minutes Ref Ref Ref Ref Ref
Number of Junctions
Less than 2 junctions 1.099** .917** 1.109** 1.051** 1.136**
2 to 5 junctions .476* .302** .533** .402** .442**
More than 5 junctions Ref Ref Ref Ref Ref
Cycle Route Traffic
Light traffic .065** .026** .089** .126** .107**
Heavy traffic Ref Ref Ref Ref Ref
Number of cases 1640 2244 3315 2575 1349
R-squared .288 .279 .272 .246 .279
Log likelihood 490.57 626.81 828.38 794.77 530.97
SUMMARY OF FINDINGS
As outlined at the outset of the current study, the purpose of this research was to add further clarity in relation to individual preference regarding infrastructure and the measures which are most likely to achieve modal shift. In this regard, findings from the current study provide an interesting insight to the variations, and similarities, in preferences among existing cyclists and non cyclists.
A summary of the findings is as follows:
• Improvements in infrastructure for cyclists is the most important measure in encouraging a growth in cycling. This is followed by the need for increased bike parking and better facilities for cyclists such as showers and lockers at work;
• Direct routes with short journey times are the most important variable for existing cyclists and non-cyclists in determining route choice. This is followed by infrastructure type, the number of junctions along the route, traffic speed and cyclist volumes;
• In terms if infrastructure, regardless of the level of cycling confidence, routes which have ‘no facilities’ or ‘bus/cycle lanes’ are the least favoured cycle route types;
• There appears to be no direct correlation between cycling confidence and route choice preference with confident cyclists demonstrating a similar preference for the presented infrastructure types as respondents with no cycling confidence;
• There is, however, a small proportion of very confident cyclists who place high importance on short journey times and direct facilities with low cyclist volumes. For these cyclists, type of infrastructure and traffic speeds are of less relevance;
• Respondents who currently drive or use public transport to travel to work have a poor perception of cycling and demonstrate a greater need for segregation and lower vehicular speeds;
• Regardless of cycling confidence, there is a similar preference for fewer junctions along cycle routes;
• Respondents who walk/cycle to work have the greatest value of time for the journey to work; and
• Cyclists with little or no experience have a greater preference for routes with a high volume of cyclists, and
• The perception of conflict between cyclist and pedestrian shared space is evident with respondents who currently walk to work expressed low favourability for off road cycling facilities and routes through ‘parks/residential areas’.
RECOMMENDATIONS
• There is a need to prioritise investment in cycling infrastructure. In terms of the type of infrastructure, high quality segregated facilities are likely to be most favoured by existing cyclists and encourage a shift to cycling. The second preference is for routes through ‘Parks/quiet residential areas’, which could easily be encouraged with minor investment in signage and infrastructure improvements, assuming the routes provide a direct alternative;
• Improvement in safety for cyclists at junctions needs to form an integrated element in the provision of any cycling infrastructure;
• There is a need to reconsider design approach to ‘bus/cycle lanes’ which are negatively viewed by confident and inexperienced cyclists;
• Investment in infrastructure needs to be supported by improvements in bike parking and facilities in the workplace;
• There is a strong role for cycle training to bridge the narrow, but consequential gap, between perceptions of cycling safety among existing cyclists and non-cyclists, particularly among commuters who currently travel by public transport users and by car, and
• To encourage an increase in female cyclists, the results indicate a greater need to invest in segregated infrastructure and introduce lower speed limits. However, it is apparent that there is also a strong role for cycle training, improving facilities in the workplace and improving awareness of local cycle routes.
ACKNOWLEDGEMENTS
The authors wish to thank the National Transport Authority and Dublin City Council for their assistance in undertaking this research.
REFERENCES
1. Department of Transport, Smarter Travel: A New Transport Policy for Ireland 2009-2020, Dublin, Ireland, 2009
2. Department of Transport, Ireland’s First National Cycle Policy Framework, Dublin, Ireland, 2009
3. National Transport Authority, National Cycle Manual, Dublin, Ireland, 2011
4. Axhausen KW, Smith RL. Bicyclist link evaluation: a stated preference approach. In Transportation Research Record: Journal of the Transportation Research Board, No. 1085, Transportation Research Board of the National Academies, Washington, D.C., 1986, pp. 7–15.
5. Hunt JD, Abraham JE. Influences on bicycle use. Transportation, Vol 34 (4), 2006, pp453-470.
6. Stinson, M and Bhat, C, Commuter Bicyclist Route Choice: Analysis using a Stated Preference Survey. In Transportation Research Record: Journal of the Transportation Research Board, No. 1828, Transportation Research Board of the National Academies, Washington, D.C., 2003, pp. 107–115.
8. Garrard, J., Rose, G. and Lo, S.K. Promoting transportation cycling for women: The role of bicycle infrastructure, Preventive Medicine, Vol 46(1), 2008, pp 55-59. 9. Parkin, J., Wardman, M. and Page, M, Models of perceived cycling risk and route acceptability' Accident Analysis & Prevention, Vol 39 (2), 2003, pp364-371
10. Van der Waerden, P., Borgers, A. and Timmermans, H. User evaluation of pedestrian infrastructure: functional or by design. 84th Annual Meeting of the Transportation Research Board. Washington D.C., 2005.
11. Abraham, J.E., McMillan, S., Brownlee, A.T. and Hunt, JD. Investigation of cycling sensitivities. 81st Annual Meeting of the Transportation Research Board. Washington D.C, 2002.
12. Sener, I.N., Eluru, N. and Bhat, C. An analysis of bicycle route choice preferences in Texas, U.S. 89th Annual Meeting of the Transportation Research Board. Washington D.C., 2009.
13. CROW. Record 25: Design Manual for Bicycle Traffic. Ede: Crow. The Netherlands, 2007.
14. Transport for London,
http://www.tfl.gov.uk/businessandpartners/publications/2766.aspx Accessed 11 October 2011.
15. Transport for London, London Greenways Monitoring Report 2009 – Shared-use route usage and trends. London, 2001.
16. Patterson, S. Cycling and walking on the towpaths of the Lagan and Newry canals’. Towpaths for the future: seminar, pp25-27, 2007.
17. Transport Research Laboratory, Achieving the aims of the NCS – A summary of TRL research, Cycling into The Millennium: Selected TRL Research and Guidance. Crowthorne: Transport Research Laboratory. pp.115-153, 1999.
18. Hensher, D. A., Rose, J.M. and Greene, W.H. Applied Choice: A Primer. Cambridge University Press, New York, 2005.
19. Train. K. Discrete Choice Methods wit Simulation, Cambridge University Press, New York, 2003