A Time Series Classification Method for
Behaviour-Based Dropout Prediction
Haiyang Liu, Zhihai Wang
School of Computer and Information Technology Beijing Jiaotong University
Beijing, China
{haiyangliu, zhhwang}@bjtu.edu.cn
Phillip Benachour, Philip Tubman
School of Computing and CommunicationsLancaster University Lancaster, UK
{p.benachour, p.tubman}@lancaster.ac.uk
Abstract— Students’ dropout rate is a key metric in online distance learning courses such as MOOCs. We propose a time-series classification method to construct data based on students’ behavior and activities on a number of online distance learning modules. Further, we propose a dropout prediction model based on the time series forest (TSF) classification algorithm. The proposed predictive model is based on interaction data and is independent of learning objectives and subject domains. The model enables prediction of dropout rates without the requirement for pedagogical experts. Results show that the prediction accuracy on two selected datasets increases as the portion of data used in the model grows. However, a reasonable prediction accuracy of 0.84 is possible with only 5% of the dataset processed. As a result, early prediction can help instructors design interventions to encourage course completion before a student falls too far behind.
Keywords: online distance learning; MOOCS; dropout prediction; time series; student interaction and behavior.
I. INTRODUCTION
The rapid emergence of Massive Online Open Courses (MOOCs) have demonstrated a significant impact on open education and enabled higher education institutions and organisations to develop different models of course dissemination and learner participation. Further, MOOCs have generated interests from researchers in data analytics and the education research fields to name a few. Over 100 higher ranked academic institutions partner with MOOC platforms to provide free education [1]. Nowadays, MOOCs have become involved with big data as the number of MOOC students increase. A course that has the potential to generate user data on a daily basis can reach millions of records in a few months [2]. Many of the higher education institutions and organisations make use of data analytics to provide indicators for policy makers, practitioners as well as valuable insights to teachers.
Researchers from emerging educational fields such as learning analytics and educational data mining, attempt to make sense of the huge datasets from MOOC provider’s e, g., Coursera, Edx, FutureLearn. These large datasets provide an
opportunity to detect differences in user behaviour which can be correlated with students’ performance.
We notice that there are two main differences between MOOCs and traditional courses. First, unlike traditional courses students enrolled on MOOCs often show a much wider range of goals and engagement styles such that many lack the motivation to complete the course. Consequently, MOOCs tend to show a very high dropout rate [3]. This in turn can motivate researchers to try and understand the reasons for the high dropout rates; hence retention prediction can be an important aspect in a MOOC environment. Early prediction can help instructors design interventions to encourage course completion before a student falls too far behind [4]. A second difference is that universities disseminating MOOC courses are less likely to collect detailed information about their students e. g., demographics, residency, and previous academic achievements. As a result, students’ interaction behaviour with the learning platform is the only source of data that is available from which to form a predictive model until course examinations have been completed [5].
Any form of sequential data in daily life can be thought of as time series data. Time series data can be found in a wide variety of scenarios like finance, medicine, agriculture, as well as MOOC platforms. As interaction data (e.g. clickstream data) between learners and resources provided by MOOCs, collected over time, it can be seen as time series data, making it possible to utilize time series data mining techniques to deal with data analysis in MOOCs. Time series classification (TSC) problems are differentiated from traditional classification problems because the attributes are ordered. The important characteristic is that there may be discriminatory features dependent on the ordering [6]. In this way, time series classification algorithms can work as powerful tools to reveal the learners’ interaction patterns that correlate with the probability of dropout.
MOOCs and it may cause ethical and privacy problems as well. The proposed predictive model is based on interaction data and is independent of learning objectives and subject domains. The model enables prediction on dropout rates without the requirement for pedagogical experts. The achieved results however can be used in the future to provide useful feedback for pedagogical experts and platform designers. It may for instance help them build an automated early-warning system, or may be used by as a reflection on how learner-environment interactions relate to student success.
This research provides the following contributions:
The construction of time series data using student behaviour and activities.
The proposal and simulation of a dropout prediction model based on the time series forest (TSF) classification algorithm.
The rest of the paper is organized as follows: The related literature is reviewed in Section 2. Section 3 provides the dataset we collected and the time series classification algorithm we designed. Experimental results are given in Section 4. We conclude with a discussion of future work in Section 5.
II. RELATED WORK
In this section, we briefly review related literature in areas of dropout prediction and time series data analysis, respectively.
A. Dropout Prediction in MOOCs
Students’ dropout rate is one of the key metrics analysed in MOOCs. Researchers are trying to find ways to make dropout prediction due to the high attrition rate commonly found on many MOOC platforms. Kuzilek et al attempted to provide weekly prediction of “at-risk” students based on both their demographic data and their interaction with virtual learning environment. K-nearest neighbour algorithm, classification and regression tree and probabilistic naïve Bayes are used as predictive models. The final decision is then achieved by voting [7]. In [8], Fei et al built a temporal model and utilised a recurrent neural network (RNN) with long short-term memory (LSTM) cells to solve this problem. Instead of dropout prediction, Mohamad et. al. attempted to predict students’ retention through data pre-processing techniques [9].
B. Time Series Data Mining
Time series data is widely present in MOOC platforms. Researches based on TSC techniques in order to solve practical problems in VLEs are conducted through the last decade.
In [10], Yang et al presented a novel technique to predict evolution of a student’s grade in MOOCs via time series networks. The technique used here incorporated student-lecture video-watching clickstream data into their machine-learning feature set enabling the training of a time series
neural network. Arabshahi et. al propose a method to track the learning of students and find similar groups of students that behave similarly in terms of learning using multivariate high-dimensional time series data of students’ problem solving outcomes [11]. This technique uses data pre-processing prior to analysis and investigates the problems that can arise. Subsequently they identified the significant factors involved to implement the prediction task. Finally Brooks et al presented a method for converting educational log data into time series data suitable for building predictive models of student success [12]. Brooks et al argue that the interaction based predictive models require no input from instructional experts and can be used on different modules and online learning environments.
III. METHODOLOGY
Students’ dropout rate is one of the key metrics analysed in MOOCs. By dropout we mean the student withdrew from the course. In this section, we introduce our method to predict the students’ dropout possibility based on their behaviour data within MOOCs collected over time.
A. Time Series Data Construction
The original dataset collected by the authors are from the Open University (OU)1. The OU is one of the largest distance learning universities worldwide. At present, around 170,000 students are registered in different programmes. Teaching materials and other content are delivered to students online. Students’ interactions with the educational materials are recorded and stored in university data warehouse. The dataset contains information about 22 courses delivered by the OU, 32,593 students, their assessment results, and logs of their interactions online is represented by daily summaries of student clicks (10,655,280 entries) [13].
At the OU, each course is called a module. Modules can be presented multiple times during one or two years. To distinguish between different presentations of a module, each presentation is named by the year and month it starts. For example, “2013J” means that the presentation started in October 2013; “2014B” means the presentation started in February 2014 and so on. The authors selected 15 presentations in total from 7 modules from the year 2013 and 2014. The domain information and the statistics about these 15 presentations are presented in Table 1.
From Table 1 below, it can be seen that all the modules come from two main disciplines: Social sciences and Science, Technology, Engineering and Mathematics (STEM). The durations of most presentations are around 280 days. The number of students engaged in these presentations ranges from three hundreds to over two thousands, producing a number of dropout rates ranging from less than 10 percent to more than 40 percent.
TABLE I. DOMAIN INFORMATION AND STATISTICS ABOUT
PRESENTATIONS FROM DIFFERENT MODULES
Module Domain Presenta
tion Students Days
Dropout rate
AAA Social Science
2013J 383 279 15.67% 2014J 365 294 18.08% BBB Social
Science
2013J 2237 246 28.79% 2013B 1767 250 28.58% 2014J 2292 272 32.68% CCC STEM 2014J 2498 288 43.11% DDD STEM 2013J 1938 280 35.14% 2014J 1803 288 35.88% EEE STEM 2013J 1052 280 23.10% 2014J 1188 288 25.76% FFF STEM
2013J 2283 287 29.57% 2013B 1614 259 25.46% 2014J 2365 288 36.15% GGG Social
Science
2013J 952 278 6.93% 2014J 749 286 16.82%
Among all the information collected, the student demographic information was omitted to avoid ethical and privacy issues. The authors’ aims are to analyse student behaviour, represented by their actions, using clickstream data of students’ interactions in the MOOCs. To make this more focussed, three kinds of educational material dataset types are collected and analysed: forum, OUcontent and resource. OUcontent and resource refer to a lecture video and a segment of text the student is supposed to watch or read, forum points to the forum space of the course. To achieve the goal of dropout prediction, the authors rearranged the original interaction dataset and transformed it into several time series datasets using the following steps.
Extract the numbers of clicks the students make on the three types of material and group them by 15 presentations of different modules.
Sum up the numbers of clicks each student makes on each type of material from each presentation on each day.
Align each student’s total clicks on each type of material by days. (condition attributes)
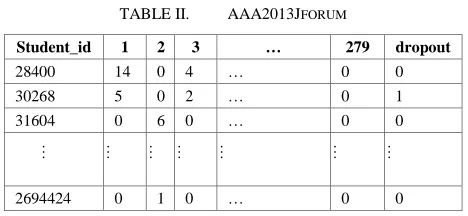
Add the dropout label, withdrawn as 1, otherwise as 0 to the end of each student instance. (class labels) Thus, a three time series datasets is constructed for each of the 15 presentations of modules. One example indicating the interaction between students and forums provided by the presentation “2013J” of module “AAA” is shown in Table II below:
TABLE II. AAA2013JFORUM
Student_id 1 2 3 … 279 dropout
28400 14 0 4 … 0 0 30268 5 0 2 … 0 1 31604 0 6 0 … 0 0
… … … …
2694424 0 1 0 … 0 0
B. Dropout Classification
Based on the above work, we successfully reify the dropout prediction problem into a time series classification problem in which students’ behaviour data is used as condition attributes and dropout as objective class label. Given sets of students’ behaviour time series with a label for each set, our next task consists in training a classifier and labelling new students.
The main reason we utilize time series data mining methods dealing with dropout prediction problem is that time series classifiers are good at visualizing the shape of data and classifying data based on similarities between patterns on various time scales. In the case of dropout prediction in MOOCs, we first try to learn what are the distinctive series of behaviours distinguishing dropout from retention. Then, when an unlabelled student is entered into the classifier, it can automatically determine if the student will become a dropout or not.
Time series forest (TSF) is one of the most efficient time series classification algorithms at the present. TSF employs a combination of entropy gain and a distance measure, referred to as the entrance (entropy and distance) gain, for evaluating the splits [14]. Besides its high prediction accuracy and its linear computational complexity with the length of time series, the most important reason we choose it as our predicting model is that TSF can capture the important temporal characteristics useful for classification through building temporal importance curves. This feature makes it possible for us not only to predict the dropout possibility of students, but also to reveal which period contributes the most in students’ learning progress.
IV. EXPERIEMNT
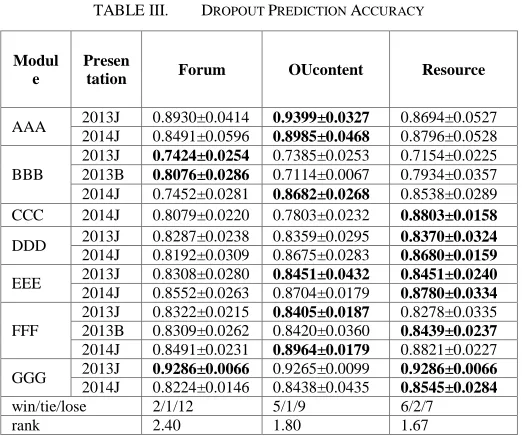
each of the 10 subsamples used exactly once as the validation data. The mean values with the standard deviations of every 10 experimental results are shown in Table Ⅲ.
TABLE III. DROPOUT PREDICTION ACCURACY Modul
e
Presen
tation Forum OUcontent Resource
AAA 2013J 0.8930±0.0414 0.9399±0.0327 0.8694±0.0527 2014J 0.8491±0.0596 0.8985±0.0468 0.8796±0.0528 BBB
2013J 0.7424±0.0254 0.7385±0.0253 0.7154±0.0225 2013B 0.8076±0.0286 0.7114±0.0067 0.7934±0.0357 2014J 0.7452±0.0281 0.8682±0.0268 0.8538±0.0289 CCC 2014J 0.8079±0.0220 0.7803±0.0232 0.8803±0.0158
DDD 2013J 0.8287±0.0238 0.8359±0.0295 0.8370±0.0324 2014J 0.8192±0.0309 0.8675±0.0283 0.8680±0.0159
EEE 2013J 0.8308±0.0280 0.8451±0.0432 0.8451±0.0240 2014J 0.8552±0.0263 0.8704±0.0179 0.8780±0.0334
FFF
2013J 0.8322±0.0215 0.8405±0.0187 0.8278±0.0335 2013B 0.8309±0.0262 0.8420±0.0360 0.8439±0.0237
2014J 0.8491±0.0231 0.8964±0.0179 0.8821±0.0227 GGG 2013J 0.9286±0.0066 0.9265±0.0099 0.9286±0.0066 2014J 0.8224±0.0146 0.8438±0.0435 0.8545±0.0284
win/tie/lose 2/1/12 5/1/9 6/2/7 rank 2.40 1.80 1.67
From these experimental results we find out the overall prediction accuracy is surprisingly good. 14 out of 15 module presentations reach an accuracy more than 80%, 2 of them reach an accuracy more than 90%. It means our methodology of data construction and time series classification model can work together as an effective tool for predicting the possibility of students’ dropout. Another conclusion can be drawn from this TABLE Ⅲ is that for different presentations of different modules, different behaviour types contribute differently to dropout prediction. It seems that students’ interaction data with forums contributes less with an average rank of 2.4. While interaction data with video and text material turns out to be more relevant with dropout prediction for most of the presentations. Choosing the most correlative type of data is the key to a more accurate prediction.
In MOOC platforms, the earlier we can predict students who are at the risk of dropout, the more actions we can take to prevent these students from withdrawing from courses. In the second part of our experiments, we try to test if we can make dropout prediction only with the first certain portion of data. To accomplish this goal, we choose “OUcontent” type of behaviour data from presentation “2013J”, module “AAA” and “resource” type of behaviour data from presentation “2014J”, module “AAA”, denoted as
“AAA2013JOUcontent” and “CCC2014Jresource”
respectively. These two datasets are representative in two different aspects. “AAA2013JOUcontent” produces the highest accuracy among all 45 datasets, while “CCC2014J” is the presentation of the highest dropout rate. For each
[image:4.612.46.307.139.357.2]dataset, at the beginning we only use the first 5 percent of the data to make prediction. Then each time we sequentially add 5 percent of the data to see how the prediction accuracy changes. Related experimental results are shown in Figures 1 and 2.
[image:4.612.333.559.144.301.2]Figure 1. Early Prediction Accuracy on AAA2013JOUcontent
Figure 2. Early Prediction Accuracy on CCC2014Jresource
[image:4.612.327.561.387.554.2]contains noisy or redundant information which is harmful to the prediction progress. So it is not always true that more data produces more accurate result. Prediction accuracy changes more evidently in Fig. 2. We can only get an accuracy of 0.55 at the beginning of the experiment, which is an invalid result for dropout prediction. However, when the portion of data comes to 50%, the accuracy reaches more than 0.8. It means for module presentation “CCC2014J”, we can warn the students at the risk of dropout on half way of the module.
V. COUNCLUSION AND FUTURE WORK
Students’ dropout rate is one of the key metrics analysed in online learning environments. This paper described a time series based approach for dropout prediction and illustrated the potential of the method by applying the methodology to the Open University learning analytics dataset. We transformed students’ behaviour data to several time series datasets and treated the dropout prediction problem as an time series classification task. Then time series forest classifier was used as the predictor. Experimental results showed that our methodology produced reasonable prediction accuracy and could still work well on early prediction of students’ dropout. While the results in this paper are promising and there are interesting, there are still some important future directions from an education research perspective. We want to explore which part of students’ behaviour during a module affects the most on their dropout. Also, we want to test if using different types of interaction data together as a multi-variate time series dataset can produce more accurate prediction.
ACKNOWLEDGMENT
The authors would like to thank Beijin Jiaotong University, China and Lancaster University, UK for their kind support, assistance to enable this research work to be carried out.
REFERENCES
[1] M. H. Baturay, “An overview of the world of MOOCs,” Procedia-Social and Behavioral Sciences, vol. 174, 2015, pp. 427-433. [2] S. Eichhorn and G. W. Matkin, “Massive open online courses, big
data, and education research,” New Directions for Institutional Research, vol. 167, no. 2015, 2016, pp. 27-40.
[3] J. He, J. Bailey, B. I. P. Rubinstein, et al, “Identifying at-risk students in massive open online courses,” Proc. Twenty-Ninth AAAI Conference on Artificial Intelligence, 2015, pp. 1749-1755.
[4] M. Fei, and D. Y. Yeung, “Temporal models for predicting student dropout in massive open online courses,” Data Mining Workshop (ICDMW), 2015 IEEE International Conference on. IEEE, 2015, pp. 256-263.
[5] C. Brooks, C. Thompson, and S. Teasley, “A time series interaction analysis method for building predictive models of learners using log data,” Proc. of the Fifth International Conference on Learning Analytics and Knowledge, ACM, 2015, pp. 126-135.
[6] A. Bagnall, J. Lines, A. Bostrom, L. James, and K. Eamonn, “The great time series classification bake off: a review and experimental evaluation of recent algorithmic advances,” Data Mining and Knowledge Discovery, vol. 3, no. 31, 2017, pp. 606-660.
[7] J. Kuzilek, M. Hlosta, and D. Herrmannova, “OU Analyse: analysing at-risk students at The Open University,” Learning Analytics Review, 2015, pp. 1-16.
[8] M. Fei, D. Y. Yeung, “Temporal models for predicting student dropout in massive open online courses,” Proc. 2015 IEEE International Conference on Data Mining Workshop (ICDMW), IEEE, 2015, pp. 256-263.
[9] N. Mohamad, N. B. Ahmad, S. Sulaiman, Datea pre-processing: a case study in predicting student’s retention in MOOC. Journal of Fundamental and Applied Sciences, vol. 9, no. 4S, 2017, pp. 598-613. [10] T. Y. Yang, C. G. Brinton, C. CJoe-Wong, and M. Chiang, “Behavior-Based Grade Prediction for MOOCs Via Time Series Neural Networks,” IEEE Journal of Selected Topics in Signal Processing, vol. 11, no. 5, 2017, pp. 716-728.
[11] F. Arabshahi, F. Huang, A. Anandkumar, C. T. Butts, and S. M. Fitshugh, “Are you going to the party: depends, who else is coming?-learning hidden group dynamics via conditional latent tree models,” Proc. 2015 IEEE International Conference on Data Mining (ICDM), IEEE, 2015, pp. 697-702.
[12] C. Brooks, C. Thompson, S. Teasley. “A time series interaction analysis method for building predictive models of learners using log data,” Proc. of the fifth international conference on learning analytics and knowledge, ACM, 2015, pp. 126-135.
[13] J. Kuzilek, M. Hlosta, and Z. Zdrahal. “Open university learning analytics datase,”. Scientific data, 2017, 4: 170171.