SELECTION TRIALS: COMPARING APPROACHES FOR CORRECTING SAMPLE SELECTION BIAS IN EVALUATING THE GENDER WAGE GAP
Geraint Johnes
Lancaster University Management School Lancaster LA1 4YX
United Kingdom
November 2019
ABSTRACT
Ordinary least squares (OLS) estimates of the impact of gender on earnings are potentially biased owing to non-randomness in sample selection. In this note, OLS estimates are compared with the results of two methods that have been proposed to allow for these selection effects – first Heckman’s method and secondly a novel approach based on quantile regression promulgated by D’Haultfoeuille et al. (2018). Estimates are provided for 18 countries over a recent three year period. Differences between the results obtained using the alternative methods are highlighted and explained, with lessons drawn for the application of these techniques in future exercises.
JEL Classification: C21, J16, J71
1. Introduction
In many microeconometric contexts, care must be taken to ensure that samples used in analysis are representative. Yet it is often the case that individuals appear in a sample precisely because they differ from other individuals. Hence finding that the happiness of a sample of individuals is enhanced by watching a TV documentary about a financial crash is understandable enough if the sample is comprised of economists – indeed those watching such a show are probably unusually likely to be economists – but the results are unlikely to generalise to the population as a whole.
Selection issues of this kind have long been known to be a potential source of bias in the estimation of key coefficients. In particular, evaluation of the factors influencing male and female earnings is complicated by differences across gender both in the propensity to participate in the labour market and in how this propensity responds to earnings opportunities.
Recent work by D’Haultfoeuille et al. (2018) provides a neat means of allowing for the effects of sample selection bias when estimating earnings equations where different demographic groups may select into labour market participation idiosyncratically. Their method was developed to counter the criticism of more conventional estimation strategies - such as that of Heckman (1979) or Lee (1983) - that the requirement that the instrument used in the participation equation should not itself affect earnings is often implausible. The new method obviates the need for such an instrument by drawing upon an assumption that the impact of the wage (outcome) variable on participation is greatest, and indeed dominates the impact of other cofactors, at the higher end of the wage distribution. The method thus exploits a series of quantile regressions in order to identify this effect and thus to provide correction for sample selection.
This innovation begs the question of when and why this novel means of correcting for sample selection bias dominates the more conventional method of modelling participation explicitly. While the approach of D’Haultfoeuille et al. is designed to address the shortcomings of instrument choice in the received methods, caveats must likewise attach to the use of estimates based on the extremes of the distribution. Our aim in the present note is to provide evidence on the circumstances in which each approach is appropriate by estimating a series of selection models, focusing on gender wage gaps, for a large number of countries around the world.
The remainder of this note is structured as follows. The next section discusses the source of the international comparative data used. This is followed by the main analytical section of the paper. The concluding section draws together the main findings.
2. Data
Social Survey Programme (ISSP, data available at http://www.issp.org). The basic estimating equation has, as dependent variable, the log of hourly wages1, and explanatory variables include years of education, linear and quadratic terms in the respondent’s age, a gender dummy, and year dummies. The ISSP is a remarkable data source in that it provides comparable survey information on individuals from many countries. Its focus varies from year to year, but each run of the survey includes a basic set of variables that allow analysis of labour market topics using microdata. The surveys take the form of repeated cross-sections, and in many cases the surveys piggy-back onto existing large scale government questionnaire surveys. While not all countries have participated in all years, a total of over 40 countries have been involved in the ISSP at some stage or another over a period of well over 30 years. These include the G8 countries (with the exception of Canada), the BRICS (with the exception of Brazil), and a wide variety of smaller countries.
3. Analysis
In the present note, previous analyses of the ISSP data are extended to explore the extent of gender differentials in pay within each of a number of countries. Table 1 reports the coefficient on the gender (male) dummy obtained, first using ordinary least squares (OLS) estimation, second using the D’Hautfoeuille et al. (2018) method (DMZ) to correct for the effects of sample selection, and third using the Heckman (1979) method in which selection and outcome equations are estimated by maximum likelihood with the gender, number of children, and the interaction of these as explanatory variables in the participation equation. We report the results for all countries for which data are available in the ISSP with at least 1500 observations across the 2012-14 period – in the case of several other countries with smaller samples (including India, the Philippines, and Turkey) initial experimentation showed the gender coefficient to be estimated only with low precision. Our samples within each country exclude outliers (with log wage more than two standard deviations from the mean), though the results are not qualitatively affected by this. In robustness checks, we have investigated the effects of varying the subsample size used for bootstrapping (from the program default to a fixed value of 250); these are not reported here since they do not produce results that qualitatively differ from those in the main analysis.
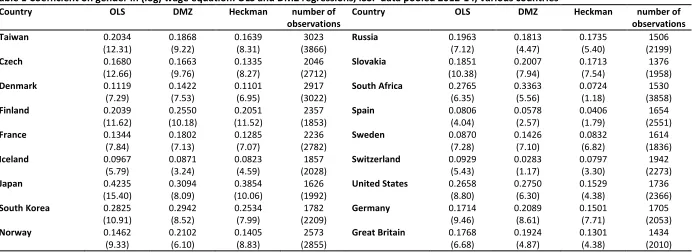
An unweighted average across the 18 countries of the gender gap evaluated by OLS amounts to around 20%. This is subject to considerable variation, though, with the smallest and largest gaps being observed in Spain and Japan respectively. These observations accord with findings of other studies, for example Estévez-Abe (2012). In most countries, the coefficients obtained using OLS, DMZ and Heckman methods are broadly similar to each other. In Finland, Norway and Sweden – all Nordic countries, all countries with a relatively equal distribution of income as measured by the Gini coefficient2, and all countries with a relatively high female
1 The earnings data in the ISSP are grouped, but converting these data into the wage paid per hour, given
considerable variation across workers in the hours normally worked, renders our dependent variable close to continuous.
participation rate3 - the DMZ estimate of the gender coefficient is markedly higher than the corresponding OLS and Heckman estimates. Recall that the purpose of the selectivity corrected estimates is to remove biases in the coefficient estimates that are due to the selection of a non-random sample in OLS; being female typically lowers expected remuneration and hence reduces participation, which in turn biases downward the OLS estimate of the impact of gender on the wage. The DMZ estimates – but not the Heckman estimates – suggest that this effect is particularly pronounced in economies that have a relatively flat earnings distribution. This is likely due to the weaker ability of the quantile method underpinning DMZ to identify non-participants when the distribution of earnings is flat. The opposite is the case in Japan, where Yokoyama and Kodana (2018) have observed nonlinearities in female labour supply that arise from discontinuities in tax treatment, notably the ‘1.03 million yen ceiling’ – a type of poverty trap effect. These nonlinearities may contribute to an explanation of how increases in the gender pay gap can have an apparently perverse impact on participation at certain quantiles.
In both South Africa and the United States, the estimated coefficient on gender in the Heckman equation is markedly lower than the OLS estimate. This is a counterintuitive finding, but these two countries are notable also for having the highest absolute value of the coefficient on the inverse Mills ratio, ; noting that this implies a high covariance between the wage and the decision to participate, this implies that the estimated impact of gender in the outcome equation is downwardly biased by multicollinearity. In such instances, the DMZ method likely offers a more reliable guide to the impact of sample selection.
4. Conclusion
In conclusion, sample selection models are designed to address non-randomness in outcome equations that is due to participation being endogenously determined. The classic example is that of an earnings gap between men and women that is likely to affect female participation in the labour market. Given the presence of both income and substitution effects, the direction of bias in the estimate of regression coefficient on gender is ambiguous. In only one of the 18 countries investigated here does the Heckman-corrected estimate of the gender wage gap exceed the OLS estimate, though in 11 cases the DMZ estimate does so.
The DMZ and Heckman approaches to correcting for selection biases rely on different mechanisms to compensate for non-randomness in the sample used to estimate the outcome equation. The former is based on quantile estimation at the extreme of the distribution of the outcome variable that is unlikely to be affected by non-participation, while the latter explicitly models the selection process and augments the outcome equation with the inverse Mills ratio as a means of controlling for the participation decision. Both methods have advantages and disadvantages – the former method places great emphasis on behaviour at the extremes, while the latter introduces identification variables that themselves may be endogenous. While the analysis reported here suggests that in most cases the results obtained using the two methods are broadly similar, caution should be exercised in the minority of cases where
3 See International Labour Organisation data at
this is not so. In particular, multicollinearity may result in biases in the traditional Heckman approach in circumstances where the wage distribution is flat.
Bargain, Olivier and Andreas Peichl (2016) Own-wage labor supply elasticities: variation across time and estimation methods, IZA Journal of Labor Economics, 5(10), 1-31.
D’Haultfoeuille, Xavier, Arnaud Maurel and Yichong Zhang (2018) Extremal quantile regressions for selection models and the black-white wage gap, Journal of Econometrics, 203(1), 129-142.
D’Haultfoeuille, Xavier, Arnaud Maurel, Xiaoyun Qiu and Yichong Zhang (2019) Estimating selection models without instrument in Stata, IZA Discussion Paper 12486, available at http://ftp.iza.org/dp12486.pdf, accessed 18 September 2019.
Estévez-Abe, Margarita (2012) An international comparison of institutional requisites for gender equality, Japanese Economy, 39(3), 77-98.
Heckman, James J. (1979) Sample selection bias as a specification error, Econometrica, 47(1), 153-161.
Johnes, Geraint, Jill Johnes and Laura López-Torres (2017) Human capital and returns to education, in Geraint Johnes, Jill Johnes, Tommaso Agasisti and Laura López-Torres (eds) Handbook of Contemporary Education Economics, Cheltenham: Edward Elgar, pp.1-20.
Lee, Lung-Fei (1983) Generalized econometric models with selectivity, Econometrica, 51(2), 507-512.
Mincer, Jacob (1974) Schooling, Experience and Earnings, New York: National Bureau of Economic Research.
Yokoyama, Izumi and Naomi Kodama (2018) Women’s labor supply and taxation: analysis of the current situation using data, Public Policy Review (Policy Research Institute, Ministry of Finance, Japan), 14(2), 267-300, available at
https://www.mof.go.jp/english/pri/publication/pp_review/fy2017/ppr14_02_03.pdf,
Table 1 Coefficient on gender in (log) wage equation: OLS and DMZ regressions, ISSP data pooled 2012-14, various countries Country OLS DMZ Heckman number of
observations
Country OLS DMZ Heckman number of observations Taiwan 0.2034 0.1868 0.1639 3023 Russia 0.1963 0.1813 0.1735 1506
(12.31) (9.22) (8.31) (3866) (7.12) (4.47) (5.40) (2199)
Czech 0.1680 0.1663 0.1335 2046 Slovakia 0.1851 0.2007 0.1713 1376
(12.66) (9.76) (8.27) (2712) (10.38) (7.94) (7.54) (1958)
Denmark 0.1119 0.1422 0.1101 2917 South Africa 0.2765 0.3363 0.0724 1530
(7.29) (7.53) (6.95) (3022) (6.35) (5.56) (1.18) (3858)
Finland 0.2039 0.2550 0.2051 2357 Spain 0.0806 0.0578 0.0406 1654
(11.62) (10.18) (11.52) (1853) (4.04) (2.57) (1.79) (2551)
France 0.1344 0.1802 0.1285 2236 Sweden 0.0870 0.1426 0.0832 1614
(7.84) (7.13) (7.07) (2782) (7.28) (7.10) (6.82) (1836)
Iceland 0.0967 0.0871 0.0823 1857 Switzerland 0.0929 0.0283 0.0797 1942
(5.79) (3.24) (4.59) (2028) (5.43) (1.17) (3.30) (2273)
Japan 0.4235 0.3094 0.3854 1626 United States 0.2658 0.2750 0.1529 1736
(15.40) (8.09) (10.06) (1992) (8.80) (6.30) (4.38) (2366)
South Korea 0.2825 0.2942 0.2534 1782 Germany 0.1714 0.2089 0.1501 1705
(10.91) (8.52) (7.99) (2209) (9.46) (8.61) (7.71) (2053)
Norway 0.1462 0.2102 0.1405 2573 Great Britain 0.1768 0.1924 0.1301 1434
(9.33) (6.10) (8.83) (2855) (6.68) (4.87) (4.38) (2010)