ISSN Online: 2161-7589 ISSN Print: 2161-7570
DOI: 10.4236/ojg.2018.86035 Jun. 21, 2018 606 Open Journal of Geology
Exploring Porphyry Copper Deposits in the
Central Iran Using Remote Sensing Techniques
Akram Mahan
*, Ramin Arfania
Isfahan (Khorasgan) Branch, Islamic Azad University, Isfahan, Iran
Abstract
This study used the ability of remote sensing technology to identify alteration zones in porphyry copper mining and Iron oxides of area in south Nain dis-trict in Iran by using Lands at-8 data source. The band ratio of 3/2 derived from image spectra was used to indicate the distribution of iron oxides and 6/3 for identifying gossan. Hydrothermal alteration mineral zones associated with porphyry copper mineralization identified and discriminated based on two algorithms of target detection, MTTCIMF and OSP. Those techniques identified porphyry copper mineralization in study area and six points were diagnosed as the best location for ore exploration. For more accurate study and recognition between mineralization and tectonic structure of district, the lineament map of area was produced by applying Gaussian high-pass filter on IRS data. The Spatial distribution of hydrothermal alteration zones has been verified by inspection in field works and Fuzzy logic. Results showed that im-age processing techniques have a great ability to obtain comprehensive infor-mation for reconnaissance stage of porphyry copper exploration in the case study and assist researcher to explore porphyry copper and iron oxides re-gions before time-consuming and costly ground investigation.
Keywords
Fuzzy Logic, OSP, MTTCIMF, Lands at-8, Gossan, Porphyry Copper Exploration
1. Introduction
Satellite Remote sensing is a useful tool for mapping lithology and surface mi-neralogy and exploring ore deposits [1] [2] [3] [4]. Multispectral remote sensing datasets which capture data in wide ranges of electromagnetic spectrum help re-searcher to identify minerals. Each mineral has specific chemical composition How to cite this paper: Mahan, A. and
Arfania, R. (2018) Exploring Porphyry Copper Deposits in the Central Iran Using Remote Sensing Techniques. Open Journal of Geology, 8, 606-622.
https://doi.org/10.4236/ojg.2018.86035
Received: May 23, 2018 Accepted: June 16, 2018 Published: June 21, 2018
Copyright © 2018 by authors and Scientific Research Publishing Inc. This work is licensed under the Creative Commons Attribution International License (CC BY 4.0).
DOI: 10.4236/ojg.2018.86035 607 Open Journal of Geology lite, sericite, smectite, chlorite and other hydroxyl minerals with diagnostic spectral absorption properties in the Visible, SWIR, NIR spectrum. The first clue for exploring ore deposits is studying the behavior of minerals assemblages of each alteration zone in. The second clue is Supergene alteration processes over porphyry copper bodies produce rust-colored and oxide and hydroxide minerals of iron and manganese which are termed Gossan [1] [8]. Gossan forms by the oxidation of the sulfide minerals in an ore deposit and they thus may be used as clues to the existence of subsurface ore deposit. The spectroscopy of minerals assemblage of each altered zone indicate that muscovite (sericite) show an in-tense Al-OH absorption feature centered at 2.20 µm and a less inin-tense absorp-tion feature at 2.35 µm that characterized as phyllic zone. The argillic zone is characterized by Kaolinite and alunite that have absorption features situated in the 2.165 µm and 2.2 µm. The propylitic zone including epidote, chlorite and calcite have absorption features at Fe, Mg-OH and CO3 in the 2.31 µm 2.33 µm Figure 1(a) shows the spectral library of minerals [2] [5] [9]-[15]. Iron oxide and hydroxide minerals such as limonite, jarosite and hematite tend to have
(a) (b)
[image:2.595.211.536.473.691.2]DOI: 10.4236/ojg.2018.86035 608 Open Journal of Geology spectral absorption features in the visible to middle infrared from 0.4 to 1.1 µm of the electromagnetic spectrum shows in Figure 1(b). The purpose of this pa-per is to utilize Lands at-8 data for mapping hydrothermal alteration mineral zones associated with porphyry copper mineralization and detect gossan and Iron oxides.
2. Materials and Methods
2.1. Geological Setting
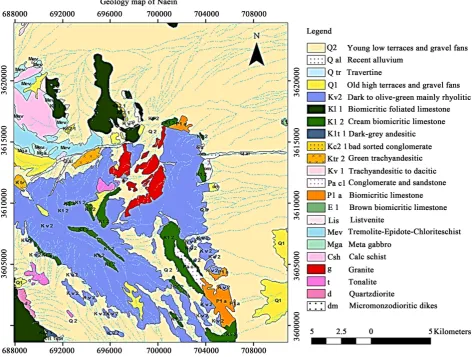
Iran is a semi-arid country. It has been divided into several units depends on a relatively unique record of stratigraphy, magmatic activities, metamorphism orogenic event, tectonics and overall geological style [17]. The ore deposit of Iran were developed in the middle part of Tethyan orogenic and metallogenic belt. The study of area is located in the west of central Iran unit on Uru-miyeh-Dokhtar Volcanic belt (U-DVB). This belt is the largest volcanic belt in central Iran. The belt by NW-SE trending is the most important volca-no-plutonic complex with economic potential for copper mineralization. Sub-duction of the Arabian plate beneath central Iran during Alpine-Himalayan orogenic formed Urumiyeh-Dokhtar volcanic belt. This study focuss on south of Naein city at (55˚45'E - 55˚ 45'E and 32˚15'N - 32˚25'N) Figure 2 shows the lo-cation of area. Rock units of area consist of three parts: 1) Paleozoic sedimentary rocks consist of dolomite and carbonate rocks. 2) Igneous rocks and volcan-ic-sedimentary rocks belong to cretaceous and clastic rocks and volcanic rocks belong to Oligocene. 3) Ophiolite complex inclusion serpentinite, peridotite, with harzburgite, diabase dike with low and medium grade metamorphism, ro-dingite dike, listvenite rocks and radiolarian cherts belongs to upper cretaceous Figure 3 [16].
[image:3.595.236.508.480.708.2]DOI: 10.4236/ojg.2018.86035 609 Open Journal of Geology Figure 3. Geology map of study, Naein (GSI, 2004).
Two main faults, Dehsheer-Baft from East and Qum-Zefreh from west have confined the district. The function of them produced transvers faults in area. Qum-Zefreh fault system reflects a dextral strike—slip displacement that have had an important role in generating igneous rocks in area. Deh-sheer fault is lat-eral strike-slip and colored melange complex can be seen in length of it in Naein area... Being ensnared between two faults allows lava to stay and alter the sur-rounding rocks. The result of this operation is alteration of dacite rocks which have lost their chemical structure and have changed to chlorite and Sericite. During this process minerals such as magnetite, Chalcopyrite, Chalcocite, Bor-nite were formed (GIS, 2004). The altered rocks in this area confirm the pres-ence of porphyry copper deposit.
2.2. Remote Sensing Data
2.2.1. Lands at 8 (OLI)
DOI: 10.4236/ojg.2018.86035 610 Open Journal of Geology Lands at 8 carries two instruments: The Operational Land Imager (OLI)1 sen-sor and Thermal Infrared Sensen-sor (TIRS)2 This satellite image has 11 bands: 5 in the visible and Near-infrared (VNIR), 2 in the thermal infrared (TIR) region of the electromagnetic spectrum, 2 in the SWIR region, new band (ultrablue) for coastal and aerosol studies and another new band for cirrus cloud detection and 1 panchromatic channel (band 8). Spatial resolution is 15 meters for the pan-chromatic band, 30 meters for VNIR and SWIR bands and 100 meters for the TIR bands. The images which has been used in this study was downloaded from US Geological Survey (USGS) website on July 25, 2013 consisted of cloud free level 1 Terrain corrected (L1T) scene of the study area in central Iran. The level 1T data product provides systematic radiometric accuracy, geometric accuracy by incorporating ground control points, while also employing a digital elevation model DEM for topographic accuracy
(https://landsat.usgs.gov/landsat-8-l8-data-users-handbook-section-4).
The images were pre-georeferenced to UTM zone 39 North projection with using the WGS-84datum. In addition Lands at8 L1T data converted to reflec-tance using the Internal Average Relative Reflection IAAR method. This dialog is used to convert raw DN values to relative reflectance and that is more useful for mineralogical mapping for this study. This algorithm is recommended for mineralogical mapping as a preferred calibration technique, which it dose not necessitate to have the prior knowledge of samples that collected from the field. This is particularly effective for reducing hyperspectral data to relative reflec-tance in an area where no ground measurements exist and little is known about the scene. For this case study just bands of OLI sensor consist of 2, 3, 4 in visible region, 5 in near infrared and 6, 7 that are posited in SWIR region, were processed and analyzed by ENVI (Environment For Visualizing Image) version 5.1.
2.2.2. IRS Data
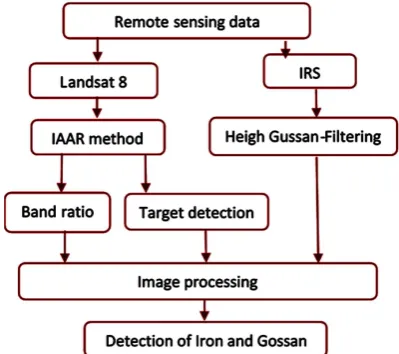
The Indian remote sensing satellite (IRS)3 was launched on December 17, 1988. In this study IRS satellite data obtained from geological survey of Iran on may20, 2015. In this case study just panchromatic band of IRS data were utilized because of its high spatial resolution. The image converted to universal Transverse Mer-cator zone 39 N from the WGS-84 datum. Figure 4 shows the Flow chart of re-search methodology in this study.
2.3. Band Ratio
Band ratio Images improve the contrast between features by dividing Digital number value of one band to the Digital number value of another band. Band ratios are very useful for highlighting certain feature or minerals that cannot be seen in the raw bands [21]. Band ratio transformation is useful for qualitative detection of hydrothermal alteration minerals, lithological units and lineaments of area [1] [22] [23] [24].
DOI: 10.4236/ojg.2018.86035 611 Open Journal of Geology Figure 4. Flow chart of area.
2.4. Target Detection
This study describes the utility of Lands at-8 OLI data for sub-pixel mineral in-vestigation using target detection algorithms for identification hydrothermal al-teration zones. Satellites acquire images of earth surface in many electromagnet-ic spectrums in such a way that a complete spectral pattern of each pixel can be derived for target detection, discrimination and classification. Most of the sur-face minerals show diagnostic spectral signature in VNIR and SWIR of electro-magnetic spectrum which enables their detection base on characteristics spectral signature. Minerals detected according to the similarity of the Image pixel with the reference spectra based on the threshold value derived from standard spec-trum database [9] [11] [25]. In previous studies application of algorithms such as Matched Filtering (MF) and MTMF4 for sub-pixel target detection were investi-gated [26] [27] [28]. However, still these algorithms are not effective in mini-mizing the effect of interferences on the spectral mapping. In this study MTTCIMF5 algorithm developed by Jin et al., 2009 and OSP algorithm were im-plemented for sub-pixel mineral investigation to detect target minerals correctly.
1) OSP
Orthogonal Subspace Projection (OSP)6 first designs to eliminate the response of non-targets, then applies matched filter (MF) to match the desired target from the data. The matched filter is the optimal linear filter for maximizing the signal to noise ratio (SNR) in the presence of additive stochastic noise [29]. OSP idea is based on two aspects: 1) how to best utilize the target knowledge provided a pri-ori and 2) how to effectively make use of available contiguous spectral bands [30]. OSP is efficient and effective when target signatures are distinct. When the spectral angle between the target signature and the non-target signature is small, the attenuation of the target signal is dramatic and the performance of OSP 4Mixture Tuned Matched Filtering.
DOI: 10.4236/ojg.2018.86035 612 Open Journal of Geology could be poor. This method is only available if you provided more than one tar-get spectra [31].
2) MTTCIMF
MTTCIMF developed by [32] which was implemented on processed Hyperion data for subpixel mineral investigation. The algorithm combines MTMF and TCIMF7 target detectors which offers opportunity to provide target as well as non-target information for improved sub-pixel target detection [33]. MTMF uses MNF transformed bands to perform MF and it add an infeasibility Image to reduce the number of false positives. TCIMF is constrained to eliminate the re-sponse of non-targets and minimization of interfering effects to improve the ef-ficiency of spectral mapping [34].
2.5. Filtering
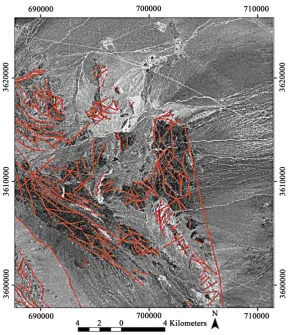
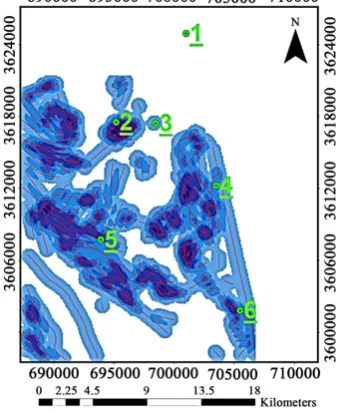
Lineaments are natural and man-made geomorphic features that have a surface expression, which could be fault, fracture, dykes, geological sharp boundaries or artificial road and canals Gaussian high-pass filter used to enhance the linea-ments from IRS satellite image. The experience has shown that the best inter-pretation is achieved with the use of the panchromatic band, which has high spatial resolution (5 m) that will increase the accuracy and precision of detecting lineaments. In order to obtain a better image for interpretation, processing with Gaussian high-pass filtering technique take place. The function of this technique is to enhance the high frequency components. The linear and edge in the origi-nal image become more obvious and sharper in the filtered image. The aim of detecting lineaments in this research is to clear relationship between lineament and mineralization in the case study. Lineaments have important role in initial mineral exploration. Mineralization is associated with Lineaments, vein and shear zone systems when those are active. The aim of detecting lineaments of this study is to clear relationship between lineaments of study area with por-phyry copper mineralization that will be find through image processing. The re-lationship between lineaments, structure, and mineralization was emphasized by [35]. Figure 5 shows lineaments of area.
3. Results and Discussion
DOI: 10.4236/ojg.2018.86035 613 Open Journal of Geology Figure 5. Lineaments of area detected by performing High Gaussian filter on panchromatic band of IRS data.
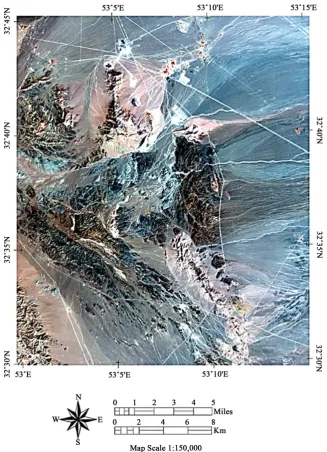
DOI: 10.4236/ojg.2018.86035 614 Open Journal of Geology Figure 6. RGB color combination image of bans 5, 3 and 2.
is a numerical indicator that use the visible and near-infrared bands of the elec-tromagnetic spectrum defined as (NIR − red)/(NIR + red), where NIR stand for the spectral reflectance measurement in near infrared, corresponds to Lands at-8 band 5, and red corresponds to Lands at-8 band 4.
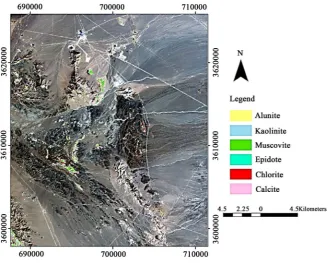
(yello-DOI: 10.4236/ojg.2018.86035 615 Open Journal of Geology teration zone by considering the reference spectral acquired from standard spec-trum data base of USGS. The output of MTTCIMF is set of images that give TCIMF and infeasibility scores with target images of each minerals and the out-put of OSP algorithm is target images and OSP images of selected minerals for each alteration. In this research alteration mineral assemblages are demonstrated with different colors, narrow argillic areas as blue color for kaolinite and yellow color as alunite, broad phyllic as green color for muscovite. propylitic zone as cyne color for epidote, red color for chlorite and pink color for calcite that has the most expanse in this area. Figure 8 shows alteration detected by MTTCIMF algorithm and Figure 9 Shows alteration detected by OSP algorithm. Results show that porpylitic alteration has the most expanse than other alteration. Argil-lic and phylArgil-lic alteration manifested just by a few pixels. Both OSP and MTTCIMF algorithm identified alteration but in MTTCIMF image it is more clear.
DOI: 10.4236/ojg.2018.86035 616 Open Journal of Geology Figure 8. Alteration detected by MTTCIMF technique.
Figure 9. Alteration detected by OSP technique.
Comparison with Ground Truth and Fuzzy Model
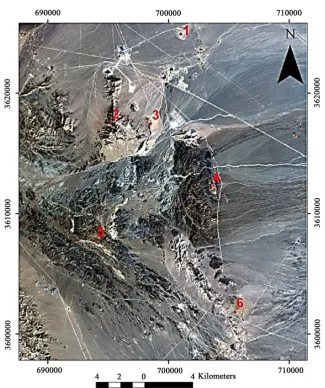
DOI: 10.4236/ojg.2018.86035 617 Open Journal of Geology Figure 10. Locations of six points as the best places for investigation.
comparison between image processing results and fieldwork. The latitude and longitude of six points were obtained and the equivalent of them on the ground by GPS survey were found. Rock sampling have been done to obtain compre-hensive information of the study area. Figure 11 shows the fieldwork result.
DOI: 10.4236/ojg.2018.86035 618 Open Journal of Geology Figure 11. Field photographs of the study area.
Figure 12. Result of fuzzy model base on relationship of lineaments and alteration.
Table 1. Weighting table modified for fuzzy logic model.
Distance of lineaments Weighting Selected mineralization points
0 - 100 3 6
100 - 200 5 5
200 - 300 2 4
300 - 400 6 3
400 - 500 4 2
[image:13.595.210.538.603.740.2]DOI: 10.4236/ojg.2018.86035 619 Open Journal of Geology MTTCIMF and OSP showed their capability in distinguishing of the argillic and phyllic and propylitic mineral assemblages based on their spectral properties. Lineaments of area were detected base on High Gussion filtering to make clear the relationship of them with mineralization of area. Results are proven to be ef-fective with results of field work and Fuzzy logic. The results were validated us-ing fuzzy logic and comparison between the image-based results and field sur-veying. To do this, we randomly selected six points over the study area for the field surveying process. In all six points we observed the correlation between Iron and Goassan and the existing faults of the area. This investigation shows that the integration of the image processing techniques and Lands at8 data have great ability to assist economic geologist for initial stages of mineral exploration, and can be extrapolated to intact area for exploring high potential copper mine-ralization zones.
Acknowledgements
This study was carried out as part of the first author’s Master of Science thesis at Isfahan (Khorasgan) Branch, Islamic Azad University, Isfahan, Iran.
References
[1] Sabins, F.F. (1999) Remote Sensing for Mineral Exploration. Ore Geology Reviews, 14, 157-183. https://doi.org/10.1016/S0169-1368(99)00007-4
[2] Mars, J.C. and Rowan, L.C. (2006) Regional Mapping of Phyllic- and Argil-lic-Altered Rock in the Zagros Magmatic Arc, Iran, Using Advanced Spaceborne Thermal Emission and Reflection Radiometer (ASTER) Data and Logical Operator Algorithms. Geosphere, 2, 161-186. https://doi.org/10.1130/GES00044.1
[3] Zhang, X., Pazner, M. and Duke, N. (2007) Lithologic and Mineral Information Ex-traction for Gold Exploration Using ASTER Data in the South Chocolate Moun-tains (California). ISPRS Journal of Photogrammetry and Remote Sensing, 62, 271-282. https://doi.org/10.1016/j.isprsjprs.2007.04.004
[4] Gabr, S., Ghulam, A. and Kusky, T. (2010) Detecting Areas of High-Potential Gold Mineralization Using ASTER Data. Ore Geology Reviews, 38, 59-69.
[5] Hunt, G.R. and Ashley, P. (1979) Spectra of Altered Rocks in the Visible and Near Infrared. Economic Geology, 74, 1613-1629.
DOI: 10.4236/ojg.2018.86035 620 Open Journal of Geology [6] Ferrier, G. and Wadeg, G. (1996) Application of Imaging Spectrometry Data to Mapping Alteration Zones Associated with Gold Mineralization in Southern Spain. International Journal of Remote Sensing, 17, 331-335.
[7] Ferrier, G., White, K., Griffiths, G., Bryant, R. and Stefouli, M. (2002) The Mapping of Hydrothermal Alteration Zones on the Island of Lesvos, Green, Using an Inte-grated Remote Sensing Data Set. International Journal of Remote Sensing, 23, 341-356. https://doi.org/10.1080/01431160010003857
[8] Abdelsalam, M. and Stern, R. (2000) Mapping Gossans in Arid Regions with Lands at TM and SIR-C Images, the Beddaho Alteration Zone in Northen Erittea. Journal of African Earth Sciences, 30, 903-916.
https://doi.org/10.1016/S0899-5362(00)00059-2
[9] Hunt, G.R. (1977) Spectral Signatures of Particulate Minerals in the Visible and near Infrared. Geophysics, 42, 501-513. https://doi.org/10.1190/1.1440721
[10] Crowley, J.K. and Vergo, N. (1988) Near-Infrared Reflectance Spectra of Mixtures of Kaolin Group Minerals: Use in Clay Mineral Studies. Clays Clay Minerals, 36, 310-316. https://doi.org/10.1346/CCMN.1988.0360404
[11] Clark, R.N., King, T.V.V., Klejwa, M. and Swayze, G.A. (1990) High Spectral Reso-lution Reflectance Spectroscopy of Minerals. Journal of Geophysical Research, 95, 12653-12680. https://doi.org/10.1029/JB095iB08p12653
[12] Dilles, J.H. and Einaudi, M.T. (1992) Wall-Rock Alteration and Hydrothermal Flow Paths about the Ann-Mason Porphyry Copper Deposit, Nevada-a 6-km Vertical Reconstruction. Economic Geology, 87, 1963-2001.
https://doi.org/10.2113/gsecongeo.87.8.1963
[13] Spatz, D.M., Wilson, R.T., Pierce, F.W. and Bolm, J.G. (1995) Remote Sensing Cha-racteristics of Porphyry Copper Systems, Western America Cordillera. Arizona Geological Society Digest, 20, 94-108
[14] Dalton, J.B., Bove, D.J., Mladinich, C.S. and Rockwell, B.W. (2004) Identification of Spectrally Similar Materials Using the USGS Tetracorder Algorithm: The Cal-cite-Epidot-Chlorite Problem. Remote Sensing of Environment, 89, 455-466. https://doi.org/10.1016/j.rse.2003.11.011
[15] Rowan, L.C., Schmidt, R.G. and Mars, J.C. (2006) Distribution of Hydrothermally Altered Rocks in the RekoDiq, Pakistan Mineralized Area Based on Spectral Analy-sis of ASTER Data. Remote Sensing of Environment, 104, 74-87.
https://doi.org/10.1016/j.rse.2006.05.014
[16] Hovis, W.A. (1965) Infrared Reflectivity of Iron Oxide Minerals. Icarus, 4, 425-430. https://doi.org/10.1016/0019-1035(65)90048-5
[17] Ghorbani, M. (2013) The Economic Geology of Iran: Mineral Deposits and Natural Resource.Springer, Netherlands.
[18] Hossein, S., Mokhtari, A. and Tehrani, E.N. (2014) Effects of Land Use/Land Cover Changes on Surface Runoff (A Case Study in Siahroud Watershed, Iran). Elixir Re-mote Sensing, 74, 26867-26870.
[19] Mohammadian, M., Arfania, R. and Sahour, H. (2017) Evaluation of SEBS Algo-rithm for Estimation of Daily Evapotranspiration Using Lands at-8 Dataset in a Semi-Arid Region of Central Iran. Open Journal of Geology, 7, 335-347.
[20] Hossein, S., Mokhtari, A. and Ghahfarokhi, S.S. (2016) Rainfall-Runoff Modeling Using Remotely Sensed Data and Hydrologic Modeling System. Ecology, Environ-ment and Conservation Paper, 22, 1725-1745.
DOI: 10.4236/ojg.2018.86035 621 Open Journal of Geology ta—Implications for Geologic Mapping and Mineral Resource Investigations in Well-Studied and Frontier Area. Geosphere, 4, 218-246.
[25] Gad, S. and Kusky, T. (2007) ASTER Spectral Ratioing for Lithological Mapping in the Arabian-Nubian Shield, the Neoproterozoic Wadi Kid Area, Sinai, Egypt. Gondwana Research, 11, 326-335. https://doi.org/10.1016/j.gr.2006.02.010
[26] Kruse, F.A., Perry, S.L. and Caballero, A. (2006) District Level Mineral Survey Using Airborne Hyperspectral Data, LosMenucos, Argentina. Annals of Geophysics, 49, 83-92.
[27] Magendran, T. and Sanjeevi, S. (2013) Hyperion Image Analysis in the Part of Noamundi, Eastern India. International Journal of Applied Earth Observation and Geoinformation, 26, 413-426. https://doi.org/10.1016/j.jag.2013.09.004
[28] Molan, Y.E., Refali, D., Tarashti, A.H. (2014) Mineral Mapping in the Maherabad Area, Eastern Iran, Using HyMap Remote Sensing Data. International Journal of Applied Earth Observation and Geoinformation, 27, 117-127.
https://doi.org/10.1016/j.jag.2013.09.014
[29] Zhang, X. and Li, P. (2014) Lithological Mapping from Hyperspectral Data by Im-proved Use of Spectral Angle Mapper. International Journal of Applied Earth Ob-servation and Geoinformation, 31, 95-109. https://doi.org/10.1016/j.jag.2014.03.007 [30] Rahimzadegan, M., Sadeghi, B., Masoumi, M. and Ghalehjoghi, S.T. (2014)
Appli-cation of Target Detection Algorithms to IdentifiAppli-cation of Iron Oxides Using Aster images: A Case Study in the North of Semnan Province, Iran. Arabian Journal of Geosciences, 8, 7321-7331. https://doi.org/10.1007/s12517-014-1757-4
[31] Jin, X., Paswaters, S. and Cline, H. (2009) A Comparative Study of Target Detection Algorithms for Hyperspectral Imagery. Proceedings Algorithm and Technologies for Multispectral, Hyperspectral and Ultraspectral Imagery XV. International So-ciety for Optics and Photonics, XV 73341W, Orlando, Florida, United States, 27 April 2009. https://doi.org/10.1117/12.818790
[32] Ren, H. and Chang, C. (2000) Target-Constrained Interference-Minimized Ap-proach to Subpixel Target Detection for Hyperspectral Images. Optical Engineering, 39, 3138-3145. https://doi.org/10.1117/1.1327499
[33] Di Tommaso, I.D. and Rubinstein, N. (2007) Hydrothermal Alteration Mapping Using ASTER Data in the Infiernillo Porphyry Deposit, Argentina. Ore Geology Reviews, 32, 275-290. https://doi.org/10.1016/j.oregeorev.2006.05.004
DOI: 10.4236/ojg.2018.86035 622 Open Journal of Geology [35] Dogan, H.M. (2008) Application of Remote Sensing and Geographic Information
System to Assess Ferrous Minerals and Iron Oxide of Tokat Province in Turkey. International Journal of Remote Sensing, 29, 221-233.
https://doi.org/10.1080/01431160701269010
![Figure 1(a) shows the spectral library of minerals [2] [5] [9]-[15]. Iron oxide](https://thumb-us.123doks.com/thumbv2/123dok_us/9285064.422877/2.595.211.536.473.691/figure-shows-spectral-library-minerals-iron-oxide.webp)
![Figure 3 [16].](https://thumb-us.123doks.com/thumbv2/123dok_us/9285064.422877/3.595.236.508.480.708/figure.webp)