www.msjonline.org pISSN 2320-6071 | eISSN 2320-6012
Review Article
Quantifying and visualizing the transcranial direct current stimulation
research indicators
Shahid Bashir
1*, Shafiq Ahmad
2, Moath Alatefi
2, Ali Hamza
1, Mohamed Sharaf
2INTRODUCTION
Noninvasive stimulation of the brain has become extensively applicator in the past two decades in research and it had shown its valuable potential therapeutic effect in cognitive neuroscience, neurophysiology, psychiatry, and neurology. There are two applications neuromodulation of this modality which are transcranial direct current stimulation (tDCS) and transcranial magnetic stimulation (TMS). TMS works on neuro-stimulation and neuro-modulation, while tDCS is a purely neuromodulator.1
tDCS is a safe non-invasive brain stimulation that consists of a current generator and two electrodes, an active electrode is placed on the target area of stimulation of the scalp and a reference electrode over the contralateral area which can deliver weak direct currents in brain.2 The low cost and simplicity in technique has
guided interest in potential basic and clinical applications which showed promising results in cognitive enhancement and physical performance.3 One of the
major areas of interest is the enhancement of memory function in healthy individuals.
ABSTRACT
The field of transcranial direct current stimulation (tDCS) has experienced significant growth in the past 15 years which is mainly devoted to determining the basic and clinical potential of tDCS in humans. The aim of this study is to quantitatively analyze the current worldwide progress on tDCS research as well as to highlight researchers, journals, institutions and countries which are contributing significantly in the past 18 years. We conducted a quantitative analysis of research articles regarding tDCS published from 1998 to 2016 and indexed in the web of science core collection database. Data was downloaded in October, 2016. In the past 18 years, there were 2457 studies on tDCS indexed by web of science database, including all documents type such as article, review, meeting abstract, proceedings paper, letters, and etc. This study is focusing on the main articles and reviews; therefore, the research production was reduced to 2000 publications. The analysis showed that most of the studies in the field were published by North American and European institutions with a reasonable proportion of the publications were also by Japanese institutions from Asia. From the perspective of research progress, we found that the number of published papers on tDCS has increased significantly in the past 10 years, between them a remarkable positive correlation exists.
Keywords: Bibliometric analysis, Bibliometric indicators, Rehabilitation, Reviews, TDCS, Treatment, Web of science
1Neuroscience Center, King Fahad Specialist Hospital Dammam, Dammam, Saudi Arabia 2Department of IE, King Saud University, College of Engineering, Riyadh, Saudi Arabia
Received: 25 September 2018
Accepted: 21 October 2018
*Correspondence:
Dr. Shahid Bashir,
E-mail: [email protected]
Copyright: © the author(s), publisher and licensee Medip Academy. This is an open-access article distributed under the terms of the Creative Commons Attribution Non-Commercial License, which permits unrestricted non-commercial use, distribution, and reproduction in any medium, provided the original work is properly cited.
tDCS delivers either cathodal or anodal current to the
brain cortex directly. Cathodal stimulation type is negatively-charged current which is proven in animal studies to decrease the stimulation and cause hyperpolarization, while anodal stimulation increase resting membrane to become more positive.4 In human,
these two different types of stimulation showed distinct effect. Anodal stimulation can increase blood-oxygen level-dependent (BOLD) signal in the fMRI where cathodal stimulation decreases it.5-7 These proprieties of
the tDCS can help us to understand the brain physiology and treating various conditions of brain’s diseases. The influence of the excitability can be altered depending on the level of intensity, the site of the stimulation, the performed task during stimulation and also there is a variability from session to session within the same individual.2,8-10
tDCS has provided a promising results in neurologic and psychiatric disorders.11,12 tDCS can be used for craving
reduction for substance-related and addictive disorders, alcohol.13-16 Also, tDCS has a lot of clinical applications,
for example, in tinnitus, major depression disorder, pain management.17-20 In smokers, tDCS showed to reduce the
daily cigarette consumption.21,22 Finally, tDCS has many
applications when it used with post-stroke patients, for example, it has analgesic effect for central post-stroke pain and it has a great role in motor recovery in rehabilitation.23,24
Bibliometrics is a research field that studies the bibliographic material in a quantitative way and assesses the impact of scientific contributions.25,26 It is very useful
in analyzing research area and identifies its leading trends. Bibliometric can be developed in a wide range of contexts including the analysis of a research topic, journals, institutions and countries.27-31 These
bibliometric research studies enable researchers and specialists to analyses a specific research field by highlighting influential articles, journals, authors, institutions and countries. This countenances researchers to have an understanding of the research field and think beyond existing contributions.
Motivated by this, the aim of this research study is to depict bibliometric view of the scientific research indicators on the tDCS between 1998 and 2016, which has indicated that tDCS research is attaining substantial attention recently from researchers, academicians and professionals. Furthermore; the main advantage of this study is that one can comprehend who is leading and contributing significantly in the tDCS research and what are the main trends emerging in recent years which have influenced even more? Bibliometric research study in this regard; analyses published articles, citations and their sources of information. Moreover, this study also utilizes the VOS viewer software to visualize relations between authors and organizations, such as co-authorship in the tDCS research through bibliographic couplings and co-citation analysis. There have been many studies published
recently concerning bibliometrics and networks mapping analyses, however, with the best of our knowledge no such study is found for the tDCS research area in the scientific research literature.32-35
The rest of the paper is structured as follows. Section 2 briefly reviews the bibliometric methods used in the analysis. Section 3 presents the publication and citation structure of the all tDCS results in the WOS. Section 4 develops a mapping and research networks analysis of the all tDCS articles in the WOS by using the VOS viewer software. Section 5 summarizes the main findings and conclusions of the paper.
REVIEW OF LITERARURE
Authors collected data from the web of science database on tDCS to provide an understanding of international research trends over the past 18 years using bibliometric indicators. Recent research indicators would be reflected in its publication outputs.25 It has also been pointed out
that citation rate is not only a direct measure of the impact or importance of a particular scholarly work, but also provides a marker of its recognition within the scientific community.36 A common research tool for this
analysis is the bibliometric method, which has already been widely applied in many disciplines of management, science and engineering areas.37 Using bibliometric
analysis such as citation rates of top-cited articles reveal useful and interesting information about scientific progress in a research field. Several recent studies have identified and analyzed citation classics and top-cited articles in various fields of science and engineering.
if a set of papers have an H-index of 20; this means 20 of the papers included in the set have received at least 20 citations each. Note that since its introduction, the H-index has been extended and generalized by many authors.39
As mentioned earlier; this research study analyzes the Web of Science (WOS) data which is currently owned by Clarivate analytics. there are many databases containing these informative data. This work considers only web of science core collection, which considers several sub databases, containing the conference proceedings citation index. Web of science core collection includes research mostly from all well-known fields, which currently includes databases of more than 15,000 journals and 60,000,000 papers. WOS provides categorization of the contents according to 251 subject categories and in 151 research areas. As mentioned earlier this research is depending only on the web of science, although there are other databases such as Scopus and Google Scholar which are not considered here in this study.
Defining an appropriate search scheme is an important step in any such study. In this research; “Transcrainal Magnetic Stimulation” has been used as keywords to develop the search process with option “Topic” in the search section. This search has collected all the articles belonging to “Transcrainal Magnetic Stimulation” field. However, this kind of search process will bring some articles which have used this keyword but it does not belong to the scope of this research study. After carefully reviewing, such articles have been omitted. Note that WOS only includes the journal since 1987
.
DISCUSSION
Publication and citation evolution of tDCS
tDCS methods started publishing papers in 1998. In the last few years it increased publication dramatically. According to WOS records; Figure 1 shows the evolution of the number of papers (Y-axis) published annually. As we can see, the number of papers starts increasing from 2008 onward with an exponential increase from 2011. One may visualize that this growth is due to the increased number of researchers worldwide as well as due to inclusion of the new journals in the WOS, the average citations received in each year is increasing throughout the selected time period of this research study.
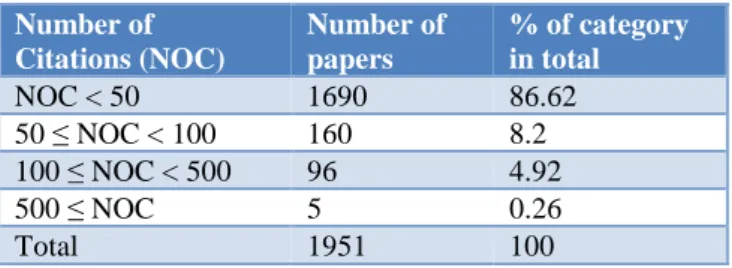
Table 1: General citation structure in tDCS research.
Number of Citations (NOC)
Number of papers
% of category in total
NOC < 50 1690 86.62
50 ≤ NOC < 100 160 8.2 100 ≤ NOC < 500 96 4.92
500 ≤ NOC 5 0.26
Total 1951 100
There are a number of abbreviations which are used by the WOS. Without having knowledge of them, it is difficult to follow-up the results and analysis of this research study. Table 1 presents all the abbreviations used in this research study.
Table 2 illustrates a broader picture of the citation status in the field of tDCS research. It depicts a general citation structure of all the papers, which categorizes the articles according to the times of citations they have received, with the percentage of every category.
Note that a bit more than 0.26% of the articles have received more than 500 citations, about 4.92% receive at least more than 100 citations and 8.2% of the articles received more than 50 citations; whereas more than 86% of all results have been cited less than 50 times.
Most influential and productive journals
tDCS research articles are being published in various and high number of journals listed in the WOS. Table 3 provides information regarding the influential journals. Top 30 influential journals are sorted in Table 3 by the number of research articles published in the field of tDCS. Brain Stimulation Journal is the top most productive and influential journal based on total number of publications (155), total number of citation (4658) as well as H-index criterion.34 Journal of Physiology
London although ranked 14 with H-index; however, it has obtained the 2nd highest number of citations (3117)
among the top 30 selected journals.15 To present the most
interested journals in tDCS; Table 3 also contains a column (%TP) showing the percentage of tDCS papers published in a journal with respect to total number of papers in the same journal. According to TP% indicator, Brain Stimulation journal again ranked top (17%) followed by Frontiers in Human Neuroscience (1.96%) and Neuro-rehabilitation and Neural Repair (1.75%) respectively.
Further; we consider the most productive and influential journals keeping in view BIs criterion of TP, H-index, TC, % TP and the number of articles with more than 50 citations throughout the selected time period. A list of the most productive and influential journals and their ranking with respect to each selected BIs is presented in Table 4. Ranking is based on tDCS research only.
Table 2: Most influential journals.
Rank Journal name
tDCS Research Impact
factor
All publications
H TP TC %TP >500 >100 >50 TP TC H
1 BS 34 155 4658 17 1 7 14 4.79 912 10881 43
2 FHN 16 78 775 1.96 0 0 1 3.63 3988 28924 51
3 PO 17 66 866 0.04 0 1 2 3.06 164623 1256490 190
4 NL 18 62 1032 0.19 0 1 5 2.11 32348 746568 199
5 NI 25 54 1907 0.37 0 1 14 5.46 14692 626975 268
6 CN 21 54 2361 0.92 1 3 9 3.43 5880 139941 134
7 NP 17 52 1215 0.62 0 4 5 2.99 8324 330602 198
8 JN 24 47 2624 0.14 0 9 15 5.92 34103 2511583 433
9 EJN 18 46 1548 0.26 0 4 6 2.98 17840 412825 181
10 EBR 18 45 1629 0.31 0 4 6 2.06 14680 501882 215
11 RNN 17 44 1075 3.62 0 3 3 2.66 1214 18992 58
12 JNP 17 27 952 0.14 0 1 3 2.65 19581 1044229 313
13 JCN 10 27 1187 0.34 0 4 4 3.56 7850 178302 181
14 NR 12 26 1001 0.22 0 3 2 1.34 11802 322218 170
15 BBR 7 24 328 0.22 0 0 2 3 10902 265864 159
16 JPL 15 20 3117 0.03 1 5 2 4.73 62649 1889456 391
17 NNR 13 20 595 1.75 0 2 2 4.04 1146 25268 68
18 CC 11 19 762 0.43 0 2 5 8.29 4432 245373 202
19 NS 7 19 178 0.09 0 0 1 3.23 22258 874971 267
20 IJN 10 18 668 0.19 0 3 0 4.33 9474 38056 76
21 C 9 18 204 0.47 0 0 0 4.31 3805 86200 103
22 JAD 9 16 362 0.18 0 0 2 3.57 9000 210199 144
23 FN 3 15 19 0.72 0 0 0 3.4 2071 11370 36
24 NH 5 14 81 0.87 0 0 0 1.45 1602 13067 43
25 JPT 4 14 54 0.51 0 0 0 0.39 2721 5246 13
26 T 3 14 14 0.47 0 0 0 1.86 2973 17519 41
27 JE 7 13 133 0.74 0 0 0 1.83 1764 11694 42
28 NM 6 13 138 0.85 0 0 0 2.41 1526 837 36
29 FP 4 13 111 0.18 0 0 0 2.46 7360 27212 47
30 FCN 3 13 45 0.79 0 0 0 4.61 1642 10724 36
Table 3: Selecting the most productive and influential journals.
Rank TP H-index TC %TP >50
1 BS BS BS BS JN
2 FHN NI JPL RNN BS
3 PO JN JN FHN NI
4 NL CN CN NNR CN
5 CN EBR NI CN EJN
6 NI EJN EBR NH EBR
7 NP NL EJN NM NL
8 JN NP NP FCN NP
9 EJN RNN JCN JE CC
10 EBR JNP RNN FN JCN
Another important and common BI measure to assess the quality of a journal is the impact factor. Impact factor (IF) basically is an indicator of the journal value, which is
calculated by dividing the number of citations received in the last two years (i.e. n-1 and n-2 which is “TC2” in
Table 4, Figure 1) from year n divided by the total number of papers published in the last two years (n-1 and n-2 which is “TP2”in Table 4).
Table 4: Impact factor in tDCS research.
Year TP TC TC2 TP2 IF
2006 21 3051 208 27 7.704
2007 27 3126 206 29 7.103
2008 54 4969 365 48 7.604
2009 60 3953 480 81 5.926
2010 72 3938 711 114 6.237
The red bars indicate the total number of TDCS papers published each year in the WoS and the green bars indicate the ratio (N-TDCS-P/TNP) × 1,000,000 where N-TDCS-P is the number of TDCS papers in year X and TNP is the total number of papers published in the WoS in year X.
Figure 1: Number of annual publications in TDCS research (articles + reviews) since 1988.
The IF measure is also presented for the analysis of BIs in the tDCS research study. WOS provides the IF information under the Journal Citation Reports (JCR) section and results are presented in Table 5.
The IF analysis for a period of ten years is conducted and results are consolidated and illustrated in Table 5. The impact factor (IF) for all of the tDCS published papers in each year is calculated with respect to the total number of publications. For instance; in 2006 and 2007, the impact factor was more than seven, whereas in the following years, it is slightly drifting down but maintaining with an average of 6.6 impact factor. Overall; it can be considered that there is a stable trend in the tDCS research in the last 10 years. Regarding yearly trend, as seen in Table 5, there is a progressive growth throughout in the number of publications and in the number of citations.
Furthermore; to determine whether the tDCS research is currently active and is progressing with the passage of time; a statistical analysis (t test) is conducted for the data retrieved from the WOS in regards to the total number of publications and the total number of citations on yearly basis. Analysis results indicate that there is a significant increase in the number of publications (P-value = 0.040) as well as in the number of citations (P-value = 0.001).
Figure 2 and Figure 3 represents tDCS research trend analysis for the selected period of ten years (2006 -2015). Results indicate that there is a strong interest by researchers and professionals in the research area and both total number of publications and the total number of citations received by the published articles are growing not only significantly but also upward trend is exponentially increasing. Publications and citations
exponential growth models with 𝑅2= 0.9902 and 𝑅2= 0.9848 in Figure 2 and 3 are illustrated in the following equations respectively.
Y (publications)=17.295e0.3563x (1)
Y(citations)=133.12e0.3267x (2)
Most influential articles
To focus on important and influential articles published in the tDCS research field, all the articles have been sorted according to the number of citations received. The more the citations received by an article the more important and influential it is in the respective field. The articles with new and innovative ideas always receive higher number of citations. Table 6 shows the 50 most cited articles of all time in tDCS research. Nitsche et al has the most cited paper (1430 citations) which was published in 2000 and analysed tDCS excitability changes induced in the human motor cortex by weak transcranial direct current stimulation (40). Second top cited (841 citations) article (which is one of the safety paper about tDCS) followed by the 3rd top cited article
(782 citations) belongs to Nitche et al as well. Fourth (549 citations) and fifth (536 citations) most cited papers are by authors Gandiga et al and by Hummel et al respectively.41,42
Figure 4 showed analysing the citations on yearly basis (C/Y); it is worth noting that Nitsche et al, has received the highest number of citations (98) in 2008 followed by Nitsche et al article; which has received 89 citations in 2000; whereas articles and by Stagg.; et al in 2011 and by Brunoni et al in 2012 have received 66 citations respectively.46,42,56,66
Most productive and influential authors
As mentioned earlier, tDCS research is very active in recent years and a number of authors and researchers are contributing significantly. In order to determine which authors have the highest influence and presence; Table 7 shows the 40 most active authors contributing to the field with having more than 15 research articles. The ranking (R) in Table 7 is done according to the number of total citations (TC) received by each article in the tDCS research, however; the criterion for the selection of influential authors is that only those authors which have published more than 15 articles are included in the list.
Nitsche MA is the most influential (14538 citations) author followed by Paulus W and Fregni F which have received the 2nd and 3rd positions by having number of
citations 13376 and 8529 respectively. However, it is worth noting that Fregni F is the most productive author among the selected list based on number of publications (TP = 169) published in the tDCS field.
Table 5: 50 most cited papers in TDCS research of all time.
R J TC Author/s Year C/Y
1 JPL 1,430 Nitsche et al 2000 89
2 N 841 Nitsche et al 2001 56
3 BS 782 Nitsche et al 2008 98
4 CN 549 Gandiga et al 2006 55
5 B 536 Hummel et al 2005 49
6 B 495 Liebetanz et al 2002 35
7 JPL 457 Nitsche et al 2003 35
8 PNA 435 Reis et al 2009 62
9 EBR 400 Fregni F et al 2005 36
10 JCN 375 Nitsche et al 2003 29
11 JN 373 Siebner et al 2004 31
12 NR 367 Fritsch et al 2010 61
13 BRB 363 Poreisz et al 2007 40
14 LN 334 Hummel et al 2006 33
15 NS 332 Stagg et al 2011 66
16 EJN 323 Lang N et al 2005 29
17 NCP 300 Fregni et al 2007 33
18 CN 298 Miranda et al 2006 30
19 JPL 290 Nitsche et al 2005 26
20 CN 286 Nitsche et al 2003 22
21 NR 283 Fregni F et al 2005 26
22 JN 280 Nitsche A et al 2007 31
23 P 278 Fregni F et al 2006 28
24 BS 275 Datta et al 2009 39
25 ARP 273 Wagner et al 2007 30
26 BS 263 Brunoni et al 2012 66
27 RNN 234 Boggio S et al 2007 26
28 JN 228 Stagg et al 2009 33
29 JNS 227 Boggio S et al 2006 23
30 BS 225 Ziemann et al 2008 28
31 NI 217 Wagner et al 2007 24
32 AR 207 Fregni et al 2006 21
33 EBR 204 Jacobson et al 2012 51
34 JN 202 Marshall et al 2004 17
35 S 194 Baker et al 2010 32
36 IJN 187 Boggio et al 2008 23
37 JN 187 Fecteau et al 2007 21
38 BP 182 Lang N et al 2004 15
39 N 181 Lindenberg et al 2010 30
40 JNN 177 Monti A et al 2008 22
41 JPL 175 Ardolino et al 2005 16
42 JCN 174 Antal et al 2004 15
43 IOV 174 Antal A, Nitsche et al 2004 15
44 IJN 173 Brunoni et al 2011 35
45 CC 167 Joseph M et al 2011 33
46 RNN 167 Nitsche et al 2011 33
47 JN 131 Fecteau et al 2007 15
48 NP 160 Kincses TZ et al 2004 13
49 PO 159 Zaehle et al 2010 27
50 JCN 157 Floeel et al 2008 20
It is also worth noting that even Pascual-Leone A and Boggio PS have published the same number of articles;
citations). It is worth noting too that the four most productive and highly cited authors (Nitchi MA, Paulus W, Fregni F and Pascual-Leone A) have more than 43000 citations in WOS which implies that they are very highly ranked in the tDCS research field worldwide. It is also noted that most of the influential and productive authors (62.5 %) are working in Germany, USA and Australia only.12,8,5
Figure 2: Publications trend analysis.
Figure 3: Citations trend analysis.
Figure 4: Authors published papers in transcrinal direct current stimulation field.
Figure 5: Authors published papers in transcrinal direct current stimulation field and link between
organizations.
Next, let us look into the productivity of the leading authors throughout the selected time period in the top most productive list of six (refer Table 4) journals. For doing so, Table 8 presents the evolution of the publications of the most productive authors in the tDCS appeared in the top selected journals. In Table 8, we have selected only those ten influential authors which have published ten or more than 10 articles in the selected list of eight influential journals. Figure 5 provides an overview of the authors which are focusing on specific journals to publish their research articles and those who tend to publish in various scientific journals.
Results reveal that the top three authors (Fregni F, Nitchi MA and Paulus W) maintain their leading publishing position in the tDCS research as well as have published in all six selected journals; however, their highest number of articles are published in the BS journal. Next to them is Bikson M, who holds the fourth position and also publish in all the selected journals with the highest number of articles published in the BS journal too.14 This has strong
evidence that most of the influential authors are publishing their work in the Brain Stimulation journal.
Most influential institutions in tDCS research
tDCS research is conducted by several leading institutions. Many of these institutions are productive and influential because the leading authors and researchers are working in these institutions. However, sometimes, there are some institutions which maintain a long list of productive and leading authors making them more influential.
these institutions. Figure 6 showed the last three columns
also provide other bibliometric information (TP, TC and
H-index) regarding all tDCS research articles published elsewhere in the WOS.
Table 6: Most influential authors in TDCS research.
R Name Country tDCS All
TP TC H-index TP10 TC10 T50 TP TC H
1 Nitsche MA Germany 147 14538 66 105 5968 17 232 16150 69
2 Paulus W Germany 130 13376 62 94 5608 4 1557 52383 106
3 Fregni F USA 169 8529 47 159 6613 7 414 15365 62
4 Pascual-Leone A USA 71 6663 39 63 4939 3 663 31649 97
5 Boggio PS Brazil 71 5281 33 63 3514 5 114 6717 39
6 Antal A Germany 66 4910 34 51 2947 4 296 7702 41
7 Cohen LG USA 31 4164 22 28 2745 4 515 33577 99
8 Liebetanz D Germany 29 3411 23 16 1079 1 77 4165 29
9 Tergau F Germany 16 3030 15 3 470 1 82 5591 35
10 Priori A Italy 49 2725 25 48 2550 0 277 8476 47
11 Rothwell JC England 30 2536 18 23 1040 0 875 50860 118
12 Bikson M USA 65 2003 23 65 2003 0 143 4498 35
13 Floel A Germany 33 1646 17 32 1110 0 159 5035 40
14 Ferrucci R Italy 30 1541 19 29 1314 1 70 1642 20
15 Brunoni AR Brazil 65 1366 20 65 1366 2 136 2187 22
16 Datta A USA 30 1360 19 30 1360 1 3534 52693 91
17 Kuo MF Germany 23 1292 16 22 1262 0 123 1938 24
18 Schlaug G USA 21 1155 16 19 1000 0 331 15282 70
19 Celnik P USA 15 1136 11 14 600 1 65 4960 27
20 Fecteau S USA 18 1069 11 18 1069 3 71 2638 26
21 Bolognini N Italy 21 773 11 21 773 1 200 2730 25
22 Vergari M Italy 16 732 11 16 732 0 57 972 16
23 Loo CK Australia 24 571 11 24 571 0 209 2445 26
24 Lavidor M Israel 23 563 11 23 563 0 101 1651 25
25 Fink GR Germany 17 517 8 17 517 0 893 67713 138
26 Miniussi C Italy 23 513 13 23 513 1 186 7261 48
27 Byblow WD New Zealand 15 501 10 15 501 0 129 3875 35
28 Alonzo A Australia 20 479 10 20 479 0 1161 2520 25
29 Bensenor IM Brazil 29 450 13 29 450 0 215 2586 22
30 Fitzgerald PB Australia 24 450 9 24 450 0 387 8531 46
31 Padberg F Germany 23 417 8 23 417 0 334 10012 48
32 Lang N Germany 26 413 22 14 1540 3 1666 59279 118
33 Lotufo PA Brazil 26 406 11 26 406 0 264 4918 27
34 Meinzer M Australia 17 366 9 17 366 0 66 1441 22
35 Palm U Germany 22 362 7 22 362 0 210 1297 19
36 Plewnia C Germany 16 355 8 16 355 0 92 1614 22
37 Lefaucheur JP France 19 342 9 19 342 0 292 8581 47
38 DE Ridder D Belgium 16 334 11 16 334 0 803 13992 57
39 Cotelli M Italy 16 247 8 16 247 0 125 1809 23
40 Jaberzadeh S Australia 16 173 7 16 173 0 43 411 12
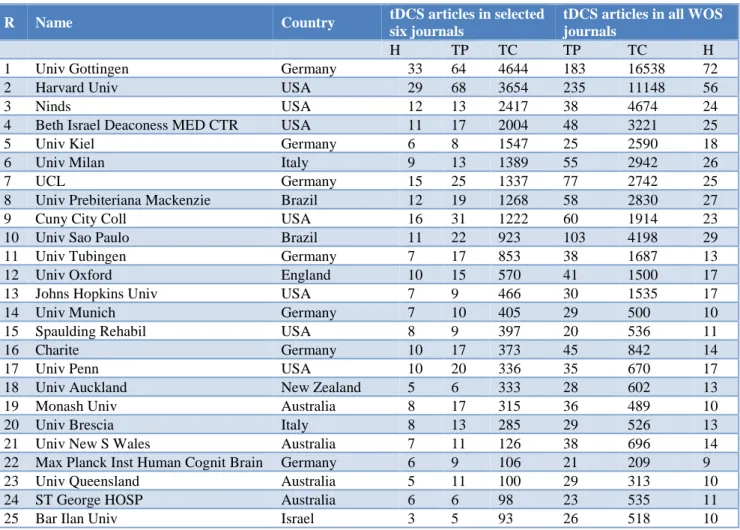
Results in Table 9 reveal that Gottingen University, Germany is highly influential in the tDCS research which has obtained the higher number of citations (4644 in selected journals whereas 16538 in all WOS journals). The Harvard University, USA has received the 2nd
position with higher number of citations (3654 in selected
Table 7: Total papers classified by selected journals.
Rank Author BS FHN PO NL CN JN Total
1 Fregni F 18 4 5 9 6 3 45
2 Nitsche MA 16 3 1 2 6 8 36
3 Paulus W 14 1 2 2 8 8 35
4 Bikson M 14 5 3 0 2 0 24
5 Boggio PS 5 2 4 6 1 1 19
6 Pascual-Leone A 9 0 2 1 1 2 15
7 Antal A 8 1 1 1 3 0 14
8 Brunoni AR 5 0 3 3 2 0 13
9 Priori A 6 1 1 2 2 0 12
10 Kuo MF 4 0 0 0 0 6 10
Table 8: The most influential institutions in TDCS research.
R Name Country tDCS articles in selected
six journals
tDCS articles in all WOS journals
H TP TC TP TC H
1 Univ Gottingen Germany 33 64 4644 183 16538 72
2 Harvard Univ USA 29 68 3654 235 11148 56
3 Ninds USA 12 13 2417 38 4674 24
4 Beth Israel Deaconess MED CTR USA 11 17 2004 48 3221 25
5 Univ Kiel Germany 6 8 1547 25 2590 18
6 Univ Milan Italy 9 13 1389 55 2942 26
7 UCL Germany 15 25 1337 77 2742 25
8 Univ Prebiteriana Mackenzie Brazil 12 19 1268 58 2830 27
9 Cuny City Coll USA 16 31 1222 60 1914 23
10 Univ Sao Paulo Brazil 11 22 923 103 4198 29
11 Univ Tubingen Germany 7 17 853 38 1687 13
12 Univ Oxford England 10 15 570 41 1500 17
13 Johns Hopkins Univ USA 7 9 466 30 1535 17
14 Univ Munich Germany 7 10 405 29 500 10
15 Spaulding Rehabil USA 8 9 397 20 536 11
16 Charite Germany 10 17 373 45 842 14
17 Univ Penn USA 10 20 336 35 670 17
18 Univ Auckland New Zealand 5 6 333 28 602 13
19 Monash Univ Australia 8 17 315 36 489 10
20 Univ Brescia Italy 8 13 285 29 526 13
21 Univ New S Wales Australia 7 11 126 38 696 14
22 Max Planck Inst Human Cognit Brain Germany 6 9 106 21 209 9
23 Univ Queensland Australia 5 11 100 29 313 10
24 ST George HOSP Australia 6 6 98 23 535 11
25 Bar Ilan Univ Israel 3 5 93 26 518 10
In general; out of twenty-five selected institutions; 18 institutions are Germany, American and Australian based institutions. Asian institutions are totally absent in the top 25 list.
Most influential countries in tDCS research
Figure 7 showed an interesting bibliometric indicator is to classify the authors and institutions by countries.
Table 9: The most influential countries in TDCS research.
Rank Name TP TC >500 >100 >50 TP10 TC10 H
1 Germany 492 25137 5 60 61 440 14012 84
2 USA 651 20535 3 40 64 634 16698 70
3 Italy 278 7271 1 14 20 273 6356 42
4 Brazil 201 7043 1 17 16 191 5117 39
5 England 226 6820 0 19 19 218 5254 42
6 Australia 185 2753 0 2 12 185 2753 28
7 Spain 61 2441 0 7 5 60 2160 26
8 France 75 1478 0 4 4 75 1478 20
9 South Korea 68 1191 0 1 6 68 1191 19
10 Canada 87 1163 0 2 4 5117 1142 18
11 Switzerland 48 981 0 2 5 47 917 16
12 Japan 76 946 0 1 5 75 854 17
13 Hungary 15 667 0 2 3 13 475 11
14 New Zealand 37 660 0 1 2 37 660 14
15 Israel 33 600 0 1 3 33 600 11
16 Portugal 18 600 0 1 3 17 301 9
17 Netherlands 62 443 0 0 1 62 443 11
18 Denmark 15 350 0 0 1 15 350 10
19 Taiwan 22 296 0 0 2 22 296 8
20 China 47 272 0 0 0 47 272 9
21 Austria 20 230 0 0 2 20 230 7
22 Russia 8 119 0 0 1 7 116 4
23 Belgium 81 114 0 0 5 81 114 20
24 Poland 13 92 0 0 0 13 92 6
25 Iran 14 80 0 0 0 14 80 4
26 Thailand 9 80 0 0 0 9 80 3
27 Turkey 10 76 0 0 1 10 76 3
28 India 15 69 0 0 0 15 69 5
29 Ireland 8 63 0 0 0 8 63 5
30 Wales 9 38 0 0 0 9 38 3
Figure 6: Authors published papers in transcrinal direct current stimulation (tDCS) field and
co-occurrence with key words of tDCS.
The countries are ranked by total number of citations received as well as by their research productivity; although some other bibliometric indicators are also considered including the total number of citations, H-index, the number of articles and citations received in last 10 (TP10 and TC10) as well as the number of articles which have received more than >500, >100 and >50 citations. Germany, USA and Italy are the leading countries in tDCS research. Note that England, Brazil, Australia and Canada are also obtaining promising results in regards to total number of citations. It is also noted that some Asian countries are also starts appearing in the selected list in recent years as well.
Bibliometric coupling and graphical analysis
The graphical representation of the tDCS research articles is conducted in this section. Figure 8 showed the graphs are giving a visualized picture of the common work and occurrence of authors, organizations, and documents. For doing so, we use the VOS viewer software that visualizes the bibliographic material through authorship, occurrence, citation, bibliographic coupling and co-citation analysis. Note that the graph visualizes those variables mostly meet the bibliographic parameters. In the bibliometric coupling graphs, circles are representing the set (authors, organizations, etc.), so the bigger the circle means that this corresponding set has a more link strength, Link strength represents the number of times a corresponding set has been repeated in the relevant field (co-authorship, co-occurrence, etc.). The lines between the authors, organizations, and so on, represent repetitions; thus, the thickest line provides the strongest relation.43
Co-authorship coupling analysis
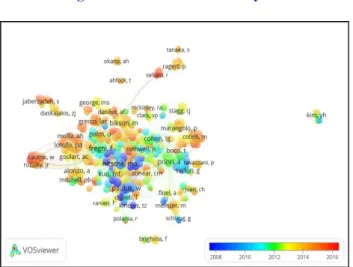
Co-authorship illustrates the volume of publications by authors, organizations, and countries and shows how they are connected. First, Co-authorship shows the volume of publications of a set of variables (authors, organizations, and countries) and how they are connected between them. Regarding the co-authorship between authors in tDCS, Figure 4 reveals that Fregni F has the greatest co-authorship among all other authors. Fregni F exits 539 times (total link strength according to VOS Viewer analysis) with other authors in all his 169 published articles, for example he published 54 articles with Pogo PS.
Note that the total link strength is represent the relation of co-authorship of a set with all other, and it doesn't equal to the number of publications, because the set may have more than one co-authorship in the same paper and then will be counted more than one. Then, Nitsche MA comes in the second position having greatest co-authorship with 479 total link strength, and the most partner for Nitshce MA is Paulus W who is also having the third strongest link strength. Nitshce and Paulus published 86 papers together in the tDCS field. Furthermore, most of the
papers by Nitsche and Paulus are published early in 2008, whereas most of papers published by Fregni are around 2014 as shown below in the color key in the right down of the figure. It is worth noting that all top authors in TDCS are mostly publishing as two more authors.
Co-authorship organizational analysis
Furthermore, inter-organization co-authorship is shown in Figure 5. Among all organizations publishing in tDCS, Harvard University has the strongest co-authorship with other organizations. It has 578 co-authorships with all other organizations, and the most partner was Sao Paulo University, which is also comes second with 321 total link strength.
Co-occurrence analysis
Co-occurrence measures the number of times that a keyword appears in the documents considered. Figure 4 presents the keywords mostly used in the tDCS field. Author keywords (the keywords that appear in the first page of many journals) are considered to visualize the existing of our related keywords and their common existing in the same paper.
Figure 6 shows that keyword "Transcranial direct current stimulation” and its abbreviation used in this research study are the strongest occurrence (existence in papers considered) and have the strongest link (common existing with other keywords), which are placed in the core of the graph. Transcranial direct current stimulation has 1707 common occurrences with other keywords, and the keyword “Transcranial magnetic stimulation" has the most common occurrence with it, which also comes in the third position. "Brain stimulation" also comes fourth with 1322 link strength.
Citation coupling analysis
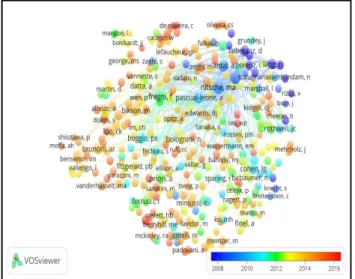
Citation between authors measures the direct citations between two authors in the set considered (documents, sources, authors, organizations, or countries). For example, with two authors, the connection represents the number of times author X has cited Y plus the number of times that author Y has cited X inside the set of documents considered. Note that here one visualizes the two documents that gives the citation but not the third document that receives the other two citations. Citations between authors are shown in Figure 7 which depict that Nitsche MA is the most authors received and cited others in his 148 papers appeared in this part of analysis. Nitsche received the most citations from Fregni F which is also comes in the third position after Paulus.
Bibliographic coupling analysis
that the two connected documents appear in the figure but
not the third one unless it also has a significant degree of bibliographic coupling through other documents. Figure 8 illustrates the bibliographic coupling between authors. The results again show that Nitsche MA has the most common reference with other authors having 1272472 link strength.
Figure 8: Bibliographic coupling of authors that publish papers in transcrinal direct current
stimulation field.
Note that link strength here means the times author number 1 and another author number 2 have cited a third author at the same time, and these number will be counted more than one in the same paper if it is repeated with other authors. For example, Nitsche MA has cited the same authors with Paulus W 79690 times, who come in the third position after Fregni.
CONCLUSION
This study has presented a quantitative analysis and visualization of bibliometric indicators in the field of tDCS research. Initially, analyzing the WOS data; results reveal that since 2011 there is a growing interest by researchers in the field. BI indicators such as total number of publications and citations are increasing exponentially with positive trend. Results also reveal that country wise, Germany is the most influential country with higher number of citations; whereas United States is the most productive country with higher number of publications. It is also observed that some developing countries are also appearing in the list including Brazil, South Korea, India, Iran, Thailand and Turkey. Currently, they do not have significant position; however, it is expected that their contributions will continue to grow significantly in future. Nitsche Ma and Paulus W from Germany appeared as the most active and influential authors followed by Fregni F from USA. Among institutions; University of Gottingen (Germany) holds the most influential institution position, however Harvard
University is the most productive institutions in tDCS research. Australia has many influential institutions and researchers, since there are four Australian institutions in the twenty-five most influential institution list, and the same thing occurred in the list of the most influential authors. Among 25 top institutions, western institutions are leading in the tDCS research. 56.0 % institutions belong to Germany and USA only followed by 16.0 % institutions belongs to Australia. Asian institutions are totally absent among the selected twenty-five most influential institution list. Study also reveals that Brain Stimulation journal is the top most productive and influential journal; which publishes 17 % tDCS research papers followed by Frontiers in Human Neuroscience (1.96%) and Neuro-rehabilitation and Neural Repair (1.75%) respectively.
Funding: King Saud University, Saudi Arabia Conflict of interest: None declared
Ethical approval: Not required
REFERENCES
1. Wagner T, Valero-Cabre A, Pascual-Leone A. Noninvasive human brain stimulation. Annu. Rev. Biomed. Eng. 2007 Aug 15;9527-65.
2. Filmer HL, Dux PE, Mattingley JB. Applications of transcranial direct current stimulation for understanding brain function. Trends in neurosciences. 2014;37(12)742-53.
3. Das S, Holland P, Frens MA, Donchin O. Impact of transcranial direct current stimulation (tDCS) on neuronal functions. Frontiers in neuroscience. 2016;10.
4. Bindman LJ, Lippold O, Redfearn J. The action of brief polarizing currents on the cerebral cortex of the rat (1) during current flow and (2) in the production of long‐lasting after‐effects. The Journal of physiology. 1964;172(3)369-82.
5. Jang SH, Ahn SH, Byun WM, Kim CS, Lee MY, Kwon YH. The effect of transcranial direct current stimulation on the cortical activation by motor task in the human brain an fMRI study. Neuroscience letters. 2009;460(2)117-20.
6. Kim CR, Kim DY, Kim LS, Chun MH, Kim SJ, Park CH. Modulation of cortical activity after anodal transcranial direct current stimulation of the lower limb motor cortex a functional MRI study. Brain stimulation. 2012;5(4)462-7.
7. Baudewig J, Nitsche MA, Paulus W, Frahm J. Regional modulation of BOLD MRI responses to human sensorimotor activation by transcranial direct current stimulation. Magnetic Resonance in Medicine. 2001;45(2)196-201.
9. Gonçalves EM. Stress prevention by modulation of autonomic nervous system (heart rate variability) A preliminary study using transcranial direct current stimulation. Open J Psychiatry. 2012;2(02)113. 10. Horvath JC, Carter O, Forte JD. Transcranial direct
current stimulation five important issues we aren't discussing (but probably should be). Frontiers in systems neuroscience. 2014;8.
11. Trojak B, Soudry-Faure A, Abello N, Carpentier M, Jonval L, Allard C, et al. Efficacy of transcranial direct current stimulation (tDCS) in reducing consumption in patients with alcohol use disorders study protocol for a randomized controlled trial. Trials. 2016;17(1)250.
12. Palm U, Reisinger E, Keeser D, Kuo MF, Pogarell O, Leicht G, et al. Evaluation of sham transcranial direct current stimulation for randomized, placebo-controlled clinical trials. Brain stimulation. 2013;6(4)690-5.
13. Boggio PS, Campanhã C, Valasek CA, Fecteau S, Pascual‐Leone A, Fregni F. Modulation of decision‐ making in a gambling task in older adults with transcranial direct current stimulation. Euro J Neurosci. 2010;31(3)593-7.
14. Shahbabaie A, Golesorkhi M, Zamanian B, Ebrahimpoor M, Keshvari F, Nejati V, et al. State dependent effect of transcranial direct current stimulation (tDCS) on methamphetamine craving. Inter J Neuropsychopharma. 2014;17(10)1591-8. 15. Batista EK, Klauss J, Fregni F, Nitsche MA,
Nakamura-Palacios EM. A randomized placebo-controlled trial of targeted prefrontal cortex modulation with bilateral tDCS in patients with crack-cocaine dependence. Inter J Neuropsychopharma. 2015;18(12).
16. Boggio PS, Sultani N, Fecteau S, Merabet L, Mecca T, Pascual-Leone A, et al. Prefrontal cortex modulation using transcranial DC stimulation reduces alcohol craving a double-blind, sham-controlled study. Drug and alcohol dependence. 2008;92(1)55-60.
17. Forogh B, Mirshaki Z, Raissi GR, Shirazi A, Mansoori K, Ahadi T. Repeated sessions of transcranial direct current stimulation for treatment of chronic subjective tinnitus a pilot randomized controlled trial. Neurological Sci. 2016;37(2)253-9. 18. Shekhawat GS, Sundram F, Bikson M, Truong D,
De Ridder D, Stinear CM, et al. Intensity, duration, and location of high-definition transcranial direct current stimulation for tinnitus relief. Neurorehabilitation Neural Repair. 2016;30(4)349-59.
19. Ho KA, Bai S, Martin D, Alonzo A, Dokos S, Loo CK. Clinical pilot study and computational modeling of bitemporal transcranial direct current stimulation, and safety of repeated courses of treatment, in major depression. J ECT. 2015;31(4)226-33.
20. Sakrajai P, Janyacharoen T, Jensen MP, Sawanyawisuth K, Auvichayapat N,
Tunkamnerdthai O, et al. Pain reduction in myofascial pain syndrome by anodal transcranial direct current stimulation combined with standard treatment a randomized controlled study. Clinical J Pain. 2014;30(12)1076.
21. Meng Z, Liu C, Yu C, Ma Y. Transcranial direct current stimulation of the frontal-parietal-temporal area attenuates smoking behavior. J Psychiatric Res. 2014;5419-25.
22. Fregni F, Liguori P, Fecteau S, Nitsche MA, Pascual-Leone A, Boggio PS. Cortical stimulation of the prefrontal cortex with transcranial direct current stimulation reduces cue-provoked smoking craving a randomized, sham-controlled study. J Clin Psychiatry. 2008;69(1)32-40.
23. Klomjai W, Lackmy-Vallee A, Roche N, Pradat-Diehl P, Marchand-Pauvert V, Katz R. Repetitive transcranial magnetic stimulation and transcranial direct current stimulation in motor rehabilitation after stroke An update. Annals Physical Rehabilitation Med. 2015;58(4)220-4.
24. Bae SH, Kim GD, Kim KY. Analgesic effect of transcranial direct current stimulation on central post-stroke pain. Tohoku J Experimental Med. 2014;234(3)189-95.
25. Merigó JM, Gil-Lafuente AM, Yager RR. An overview of fuzzy research with bibliometric indicators. Applied Soft Computing. 2015;27420-33.
26. Rosas SR, Kagan JM, Schouten JT, Slack PA, Trochim WM. Evaluating research and impact a bibliometric analysis of research by the NIH/NIAID HIV/AIDS clinical trials networks. PloS one. 2011;6(3)e17428.
27. Royle P, Waugh N. Macular disease research in the United Kingdom 2011-2014 a bibliometric analysis of outputs, performance and coverage. BMC Research Notes. 2015;8(1)833.
28. Chuang KY, Ho YS. A bibliometric analysis on top-cited articles in pain research. Pain Med. 2014;15(5)732-44.
29. Hendrix D. An analysis of bibliometric indicators, National Institutes of Health (NIH) Funding and Faculty Size at Association of American Medical Colleges (AAMC) Medical Schools, 1997-2007. 2008.
30. Gupta B, Dhawan S. Status of India in science and technology as reflected in its publication output in the Scopus international database, 1996-2006. Scientometrics. 2009;80(2)473-90.
31. Bornmann L. Is the promotion of research reflected in bibliometric data? A network analysis of highly cited papers on the Clusters of Excellence supported under the Excellence Initiative in Germany. Scientometrics. 2016;107(3)1041-61.
32. Hood W, Wilson C. The literature of bibliometrics, scientometrics, and informetrics. Scientometrics. 2001;52(2)291-314.
management A bibliometric analysis of the
determinants of university and author impact in the management literature in the past quarter century. J Management. 2008;34(4)641-720.
34. Leung XY, Sun J, Bai B. Bibliometrics of social media research A co-citation and co-word analysis. International J Hos Manag. 2017;6635-45.
35. Fernando J. Garrigos-Simon, Yeamduan Narangajavana-Kaosiri and Ismael Lengua-Lengua. Tourism and sustainability a bibliometric and visualization analysis. Sustainability. 2018;10(6)1976.
36. Cobo MJ, López-Herrera AG, Herrera-Viedma E, Herrera F. An approach for detecting, quantifying, and visualizing the evolution of a research field A practical application to the fuzzy sets theory field. J Informetrics. 2011;5(1)146-66.
37. Hirsch JE. An index to quantify an individual's scientific research output. Proceedings of the National academy of Sciences of the United States America. 2005;102(46)16569.
38. Győrffy B, Nagy AM, Herman P, Török Á. Factors influencing the scientific performance of Momentum grant holders an evaluation of the first 117 research groups. Scientometrics. 2018;117(1)409-426.
39. Alonso S, Cabrerizo FJ, Herrera-Viedma E, Herrera F. h-Index A review focused in its variants,
computation and standardization for different scientific fields. J Informetrics. 2009;3(4)273-89. 40. Nitsche MA, Paulus W. Excitability changes
induced in the human motor cortex by weak transcranial direct current stimulation. J Physiology. 2000;527(3)633-9.
41. Gandiga PC, Hummel FC, Cohen LG. Transcranial DC stimulation (tDCS) a tool for double-blind sham-controlled clinical studies in brain stimulation. Clinical neurophysiology. 2006;117(4)845-50. 42. Hummel F, Celnik P, Giraux P, Floel A, Wu W-H,
Gerloff C, et al. Effects of non-invasive cortical stimulation on skilled motor function in chronic stroke. Brain. 2005;128(3)490-9.
43. Merigó JM, Blanco‐Mesa F, Gil‐Lafuente AM, Yager RR. Thirty years of the International Journal of Intelligent Systems A bibliometric review. Inter J Intelligent Systems. 2017 May;32(5)526-54.