Anjali Maurya et al IJSRE Volume 05 Issue 03 March 2017 Page 6281 Volume||5||Issue||03||March-2017||Pages-6281-6286||ISSN(e):2321-7545 Website: http://ijsae.in Index Copernicus Value- 56.65 DOI: http://dx.doi.org/10.18535/ijsre/v5i03.06
Microwave Assisted Chemical Synthesis of Nickel Oxide
Authors
Anjali Maurya1, Dr.Nanda Bhatia2, Dr.Vijay Varma3
1
Dr.H.S Gour Central University, Sagar, India
2
B.L.P.Govt.P.G.College MHOW,D.A.V.V. Indore
3
Dr.H.S Gour Central University, Sagar, India
Email: [email protected], [email protected] [email protected] Corrosponding Author:
Dr. Nanda Bhatia
Email: [email protected]
ABSTRACT
Nickel Oxide (NiO) nanoparticles have been synthesized by Microwave assisted chemical synthesis method by using the precursors NiCl2 and NaHCO3. It is a simple, novel and cost effective method. The
structure, morphology and crystalline phase of the nickel oxide nanocrystals have been investigated by scanning electron microscopy (SEM), transmission electron microscopy (TEM), X-ray diffraction (XRD).Presence of functional groups and optical characters are analyzed by using FTIR and UV- visible techniques.
Keywords- Microwave, Crystalline, Nanoparticles, X Ray Diffraction.
1. INTRODUCTION
Nickel (II) oxide is the chemical compound with the formula NiO. Nickel oxide is a powdery green solid that becomes yellow on heating. It is readily soluble in acids but insoluble in hot and cold water. Its melting point is 1955 °C. The mineralogical form of NiO, bunsenite, is very rare. It is classified as a basic metal oxide. NiO belongs to NaCl structure, so-called rock salt structure. The space group of NaCl structured NiO is Fm3m with lattice parameters a = 4.1769 Å (JCPDS, 47-1049). ‘NiO’ is often non-stoichiometric. The nonstoichiometry is accompanied by a color change from green to black due to the existence of Ni
3+
resulting from Ni vacancies [1]. This leads to p-type conductivity.
Nickel oxide is a promising material for applications in fuel cells [2] and catalysis [3]. Non-stoichiometric nickel oxide, because of its defect structure is a p- type semiconductor and finds application as gas sensor for H2 [4]. As the Neel temperature of NiO is 523 K, it can be applied for room temperature spin valve
devices [5].
Anjali Maurya et al IJSRE Volume 05 Issue 03 March 2017 Page 6282
2. EXPERIMENTAL
Reagents are all of AR grade Nickel oxide was synthesized by dissolving 18.4g of NiCl2 in 80ml distilled
water and 12g of NaHCO3 was dissolved in 80ml of distilled water in a separate container. The nickel
chloride solution was stirred for 15 minutes at room temperature on a magnetic stirrer. Then the sodium bicarbonate solution was added to the nickel chloride solution drop by drop with constant stirring. After 15 minutes the precipitate was collected by decantation and filtered with the help of Watman filter paper and was washed thoroughly with distilled water. The collected product was exposed under microwave for 5minutes.Then the dried sample was further calcined in a tubular furnace at a temperature of 600oC for 2 hrs. Finally greyish black product was obtained which was grinded to make fine powder (as shown in figure 2) and was kept for characterization.
Figure 1 Synthesized nanocrystalline Nickel oxide (NiO)
2.1 Characterization Of Nanoparticles
UV–visible absorption spectrum was obtained from Vis-Cary 5E model spectrometer in the wavelength range 200 – 800 nm. FTIR spectra of nickel oxide was recorded in KBr pellets using Shimadzu (model 8400S) spectrophotometer from 4000 cm-1 to 400 cm-1. The phase and crystallinity were characterized by using a Bruker D8 Advance Cu Kα radiation (= 1.5406A˚, Rigaku Geiger Flex X-ray diffractometer).Surface morphology was studied by JSM-7600F scanning electron microscope. The transmission electron micrographs were taken with a Philips CM-200-Analytical transmission electron microscope working at 120Kv.
3. RESULTS AND DISCUSSION
The optical absorption spectrum of nickel oxide is shown in figure 2. It can be seen that the strongest absorption peak of the as-prepared sample appears at around 280 nm, which is fairly blue shifted from the absorption edge of bulk NiO nanoparticles. Here it is also observed that NiO nanoparticles are almost transparent in visible region.
U
Figure 2 V- VIS Spectrum of Nickel oxide
200 300 400 500 600 700 800 0.02
0.04 0.06 0.08 0.10 0.12 0.14 0.16 0.18 0.20 0.22
Ab
s
Wavelength(nm)
Anjali Maurya et al IJSRE Volume 05 Issue 03 March 2017 Page 6283 The formation of pure nickel oxide nanoparticles after heat treatment at 600oC was also identified by FT-IR spectral studies. Figure 3 shows the FTIR spectra of NiO nanoparticles, which showed several significant absorption peaks. The broad absorption band in the region of 403-472 cm−1 is assigned to Ni–O stretching vibration mode [13-14]. The broadness of the absorption band indicates that the NiO powders are nanocrystals. The size of samples used in this study was much less than the bulk form NiO, so that NiO nanoparticles had its FTIR peak of Ni–O stretching vibration shifted to blue side. Due to their quantum size effect and spherical nanostructures, the FTIR absorption of NiO nanoparticles is blue-shifted compared to that of the bulk form. Besides the Ni–O vibration, it could be seen from Figure 3 that the broad absorption Peaks at 3223,3408,3471,3518 cm-1 cm−1 are attributable to the band either O–H stretching vibration of precursor impurity or moisture adsorbed on the sample. The band near 1610 cm−1 is assigned to H–O–H bending vibration mode due to the adsorption of water in air when FTIR sample disks were prepared in open air. These observations provided the evidence of the effect of hydration on the sample. The broad absorption around 767cm−1 is assigned to the C=O deformation vibration. The absorption bands in the region of 1020, 1332, 1444, 1518 cm-1 are assigned to the symmetric and asymmetric stretching vibrations of carbonates.
Figure 3 IR spectrum of Nickel oxide
Anjali Maurya et al IJSRE Volume 05 Issue 03 March 2017 Page 6284
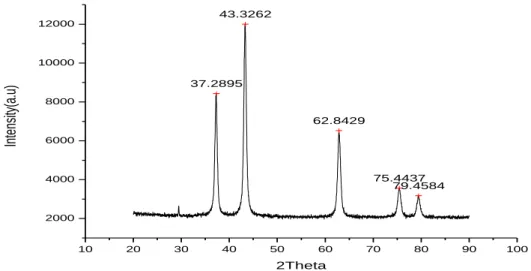
Figure 4 X- Ray Diffraction pattern of Nickel oxide
The surface morphological features of synthesized nanoparticles were studied by scanning electron microscope. Figure 5 shows the SEM image of NiO nanoparticles. The instrumental parameters, accelerating voltage, spot size, and magnification and working distances are indicated on SEM image. The results indicate that mono-dispersive and highly crystalline NiO nanoparticles are obtained. The particles are mostly irregular spherical shape. We can observe that the particles are highly agglomerated and they are essentially cluster of nanoparticles. The observation of some larger nanoparticles may be attributed to the fact that NiO nanoparticles have the tendency to agglomerate due to their high surface energy and high surface tension of the ultrafine nanoparticles. The fine particle size results in a large surface area that in turn, enhances the nanoparticles catalytic activity. So we can conclude that the prepared NiO particles are in nanometer range.
Figure 5 SEM micrograph for Nickel oxide
TEM imaging was carried out in a Philips CM-200-Analytical transmission electron microscope working at 120kV. The powder samples were supported on conventional carbon-coated film on copper grid.TEM imaging of the powder samples is the most direct and convenient method to see and analyze the structure of aggregates and to determine the size of particles. TEM images shown in figure 6A revealed the presence of a large number of NiO particles with hexagonal shape and uniform size around 16.5 nm. The electron diffraction pattern of the selected area of nanoparticles figure 6B.The appearance of strong diffraction spots rather than diffraction rings confirmed the formation of single crystalline cubic nickel oxide.
10 20 30 40 50 60 70 80 90 100
2000 4000 6000 8000 10000 12000
37.2895 43.3262
62.8429
75.4437 79.4584
In
te
nsi
ty
(a
.u
)
2Theta
Anjali Maurya et al IJSRE Volume 05 Issue 03 March 2017 Page 6285
Figure 6.A. TEM Images of Nickel oxide
Figure 6. B. TEM (Selected area electron diffraction pattern) of Nickel oxide
4. CONCLUSION
Nanoparticles of Nickel oxide (NiO) was synthesized by microwave assisted chemical synthesis method by using NiCl2 and NaHCo3 precursors. FTIR spectral studies confirm the formation of pure nickel oxide
nanoparticles. Purity and crystallinity of Nickel Oxide Nanoparticles was examined by powder x-ray diffraction. The surface Morphology of the synthesized NiO nanoparticles were studied by scanning electron Microscopy (SEM).TEM images confirms the formation of single crystalline cubic Nickel Oxide Nanoparticle.
REFERENCES
1. K.-S. Lee, H.-J. Koo, K.-H. Ham, W.-S. Ahn, Bull. Kor. Chem. Soc., 16 (1995) 164.
2. L. Daza, C.M. Rangel, J.Baranda, M.T. Casais, M.J. Martínez, J.A. Alonso., J. Power Sources. 86
(2000) 329-333
3. Y. Wang, J. Zhu, X. Yang, L. Lu, X. Wang., Thermo chem. Acta. 437 (2005) 106-109
4. M. Matsumiya, F. Qiu, W. Shin, N. Izu, N. Murayama, S. Kanzaki., Thin Solid Films. 419 (2002)
213
5. J. Nogues, I.K. Schuller., Exchange Bias., J. Magn. Mater. 192 (1999) 203
Anjali Maurya et al IJSRE Volume 05 Issue 03 March 2017 Page 6286 7. A. Agrawal, H. R. Habibi, R. K. Agrawal, J. P. Cronin, D. M. Roberts, R. Caron-Popowich and C.
M. Lampert Thin Solid Films, 221(1992 ) 239
8. D. Wruck and M. Rubin J. Electrochem. Soc. 140(1993)1097
9. K. Yoshimura, Miki Tand Tanemura S Japan J. Appl. Phys. 34, (1995) 2440 10.A. Surca, B. Orel, B. Pihlar and P. Bukovec J. Electro anal. Chem. 408(1996) 83 11.Mirosław Zawadzki, J. Allo. Com. 45 (2008) 297.
12.T. Krishnakumar, R. Jayaprakash, N. Pinna, V.N. Singh, B.R. Mehta and A.R. Phani, Materials Letters, 63 (2009) 242.