arXiv:1601.02385v1 [astro-ph.HE] 11 Jan 2016
January 12, 2016
Anatomy of the AGN in NGC 5548
VI. Long-term variability of the warm absorber
J. Ebrero
1, J. S. Kaastra
2,3, G. A. Kriss
4,5, L. Di Gesu
2, E. Costantini
2, M. Mehdipour
2, S. Bianchi
6, M. Cappi
7, R.
Boissay
8, G. Branduardi-Raymont
9, P.-O. Petrucci
10,11, G. Ponti
12, F. Pozo Núñez
13, H. Seta
14, K. C. Steenbrugge
15,
and M. Whewell
91 XMM-Newton Science Operations Centre, ESAC, Camino Bajo del Castillo s/n, Urb. Villafranca del Castillo, 28692 Villanueva de la Cañada, Madrid, Spain
e-mail:[email protected]
2 SRON Netherlands Institute for Space Research, Sorbonnelaan 2, 3584 CA, Utrecht, The Netherlands 3 Leiden Observatory, Leiden University, P.O. Box 9513, 2300 RA, Leiden, The Netherlands
4 Space Telescope Science Institute, 3700 San Martin Drive, Baltimore, MD 21218, USA
5 Department of Physics and Astronomy, The Johns Hopkins University, Baltimore, MD 21218, USA
6 Dipartimento di Matematica e Fisica, Università degli Studi Roma Tre, Via della Vasca Navale 84, 00146, Roma, Italy 7 INAF-IASF Bologna, Via Gobetti 101, 40129 Bologna, Italy
8 Department of Astronomy, University of Geneva, 16 Ch. d’Ecogia, 1290 Versoix, Switzerland
9 Mullard Space Science Laboratory, University College London, Holmbury St. Mary, Dorking, Surrey, RH5 6NT, UK 10 University Grenoble Alpes, IPAG, 38000 Grenoble, France
11 CNRS, IPAG, 38000 Grenoble, France
12 Max-Planck-Institut für Extraterretrische Physik, Giessenbachstrasse, 85748 Garching, Germany 13 Astronomisches Institut, Ruhr-Universität Bochum, Universitätstrasse 150, 44801 Bochum, Germany 14 Department of Physics, Tokyo Metropolitan University, 1-1 Minami-Osawa, Hachioji, Tokyo, Japan
15 Instituto de Astronomía, Universidad Católica del Norte, Avenida Angamos 0610, Casilla 1280, Antofagasta, Chile
Received<date>; accepted<date>
ABSTRACT
Context. We observed the archetypal Seyfert 1 galaxy NGC 5548 in 2013-2014 in the context of an extensive multiwavelength campaign involving several satellites, which revealed the source to be in an extraordinary state of persistent heavy obscuration. Aims.We re-analyzed the archival grating spectra obtained by XMM-Newton and Chandra between 1999 and 2007 in order to char-acterize the classic warm absorber (WA) using consistent models and up-to-date photoionization codes and atomic physics databases and to construct a baseline model that can be used as a template for the physical state of the WA in the 2013 observations.
Methods.We used the latest version of the photoionization code CLOUDY and the SPEX fitting package to model the X-ray grating spectra of the different archival observations of NGC 5548.
Results.We find that the WA in NGC 5548 is composed of six distinct ionization phases outflowing in four kinematic regimes. The components seem to be in the form of a stratified wind with several layers intersected by our line of sight. Assuming that the changes in the WA are solely due to ionization or recombination processes in response to variations in the ionizing flux among the different observations, we are able to estimate lower limits on the density of the absorbing gas, finding that the farthest components are less dense and have a lower ionization. These limits are used to put stringent upper limits on the distance of the WA components from the central ionizing source, with the lowest ionization phases at several pc distances (<50,<20, and<5 pc, respectively), while the intermediately ionized components lie at pc-scale distances from the center (<3.6 and<2.2 pc, respectively). The highest ionization component is located at∼0.6 pc or closer to the AGN central engine. The mass outflow rate summed over all WA components is ∼0.3 M⊙yr−1, about six times the nominal accretion rate of the source. The total kinetic luminosity injected into the surrounding medium is a small fraction (∼0.03%) of the bolometric luminosity of the source. After adding the contribution of the UV absorbers, this value augments to∼0.2% of the bolometric luminosity, well below the minimum amount of energy required by current feedback models to regulate galaxy evolution.
Key words. X-rays: galaxies – galaxies: active – galaxies: Seyfert – galaxies: individual: NGC 5548 – techniques: spectroscopic
1. Introduction
Active galactic nuclei (AGN) are powered by gravitational ac-cretion of matter on to the central supermassive black hole (SMBH) that resides in their center (Rees 1984), emitting vast amounts of energy across the spectrum. X-ray emission is a characteristic feature of AGN spectra and finds its origin in the inverse Compton scattering of lower energy photons in a hot
ionization phases with temperatures∼104−106K, column den-sities ranging from 1020−1024cm−2, and outflow velocities of a
few hundred to thousands of km s−1(e.g., Blustin et al. 2005). While their ubiquity suggests that WA are an important struc-tural feature in AGN, their contribution as sources of cosmic feedback (the relation between the SMBH growth and star for-mation in the host galaxy) has been a matter of debate for many years. Recent studies seem to indicate that the contribu-tion of WA with low-to-moderate velocities is negligible in terms of feedback, with the exception of the so-called ultra-fast out-flows (UFOs), which would be able to carry enough momen-tum to be a significant source of feedback (see Tombesi et al. 2013, and references therein). Current models show that ki-netic luminosities (kiki-netic energy carried by the outflow per unit time) ranging between 0.5% and 5% of the bolometric lumi-nosity (Di Matteo et al. 2005; Hopkins & Elvis 2010) must be fed back in order to significantly affect the interstellar medium
(ISM) of the galaxy and reproduce the observed M−σrelation
(Ferrarese & Merritt 2000; Gebhardt et al. 2000).
A key parameter for reliably estimating the mass outflow rate (hence the kinetic luminosity injected into the ISM) is the ac-tual location of the WA. Current scenarios for the origin of these ionized outflows are: (i) disk-driven winds, which are launched within hundreds of gravitational radii (Murray & Chiang 1995; Elvis 2000); and (ii) thermal winds evaporating from an irradi-ated dusty torus that surrounds the AGN engine, which lie at pc-scale distances (Krolik & Kriss 2001). Ideally, tight limits can be put on the distance by measuring variability on the ioniza-tion properties of the WA in response to changes in the incident ionizing flux (e.g., Detmers et al. 2008; Longinotti et al. 2010;
Kaastra et al. 2012). High-density gas will ionize/recombine
faster than low-density gas, allowing us to determine reliable lower limits to the density and hence strict upper limits on the distance where this gas crosses our line of sight. This is, how-ever, very challenging because the observations of a given ob-ject are often sparse, washing out the possible effects of variabil-ity, and lacking the signal-to-noise ratio required to significantly measure the expected changes.
NGC 5548 is an archetypal Seyfert-1 galaxy (MBH =
3.24×10⁷ M
⊙, Pancoast et al. 2014), the first in which
nar-row absorption lines in the X-rays were detected (Kaastra et al. 2000). Since then, its ionized outflow has been widely studied, both in the X-rays (Kaastra et al. 2002; Steenbrugge et al. 2003; Steenbrugge et al. 2005; Detmers et al. 2008; Detmers et al. 2009; Krongold et al. 2010; Andrade-Velázquez et al. 2010) and in the ultraviolet (Crenshaw & Kraemer 1999; Brotherton et al. 2002; Arav et al. 2002; Crenshaw et al. 2003; Crenshaw et al. 2009).
Following the success of the multiwavelength campaign on Mrk 509 (introduced in Kaastra et al. 2011), NGC 5548 was ob-served extensively in 2013-2014 in the context of a large
ded-icated multiwavelength campaign led by XMM-Newton,
com-prising also observations withChandra,NuSTAR, INTEGRAL,
HST-COS, and including Swift monitoring, with the
objec-tive of characterizing the properties of the WA with unprece-dented detail. An overview of the campaign can be found in Mehdipour et al. (2015a) (Paper I). Interestingly, the soft X-ray flux of NGC 5548 during the campaign was remarkably low, about 25 times lower than the median flux of the source in pre-vious observations. Our analysis suggests that this is caused by a long-lasting stream of obscuring material situated at light-day distances, partially covering the X-ray source and the broad line region (BLR), as reported in Kaastra et al. (2014).
−0.5 0 0.5 1 1.5 2
−3
−2
−1
0
1
log T (keV)
log (ξ/T) CLOUDY v.C13 (this work)
XSTAR v1 (Steenbrugge et al. 2005)
CLOUDY v.C98
XSTAR v2.2.1bk
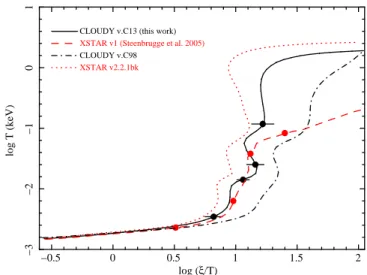
Fig. 1. Stability curves obtained with different versions of XSTAR and CLOUDY (black solid line, CLOUDY v13; black dot-dashed line, CLOUDY v98; red dashed line, XSTAR v1; red dotted line, XSTAR v2.2.1bk) for the same input spectral energy distribution. The solid dots represent the WA components of Steenbrugge et al. (2005).
This paper is organized as follows. In Sect. 2 we briefly sum-marize the motivation for the re-analysis of the grating X-ray spectra of NGC 5548, and the observations used in this paper. In Sect. 3 we describe the analysis of the data, while in Sect. 4 we discuss the results. Our conclusions are reported in Sect. 5. Throughout this paper we assume a cosmological framework
with H0 = 70 km s−1 Mpc−1,ΩM = 0.3, andΩΛ = 0.7. The
quoted errors refer to 68.3% confidence level (∆C = 1 for one
parameter of interest) unless otherwise stated.
2. NGC 5548 revisited
2.1. Motivation
The reasons to carry out a comprehensive re-analysis of the archival high-resolution grating spectra of NGC 5548 are two-fold. The main consequence of the extraordinary obscuration ob-served during the 2013 campaign (Kaastra et al. 2014) is the de-pression of the soft X-ray continuum, which makes the detection of WA features very challenging, although it gives us an excel-lent opportunity to study the X-ray emission of the narrow line region (NLR) of a Seyfert 1 galaxy with unprecedented detail (Whewell et al. 2015). The depressed X-ray flux is not intrin-sically low, since the hard X-ray continuum is comparable to the historical fluxes of NGC 5548 in that energy band, but it is caused by the presence of obscuring material crossing our line of
sight. Moreover, according toSwiftmonitoring, this obscuration
has lasted since at least February 2012 (Mehdipour et al. 2015b). An analysis of the data from our multiwavelength campaign re-veals that the obscurer, possibly in the form of a clumpy stream of gas, is located within a few light days of the central SMBH, extending to outside of the BLR but closer in than the expected location of the WA (Kaastra et al. 2014). The ionizing photons that reach the WA are therefore severely diminished.
(∼660 ks with XMM-NewtonRGS at the core of the campaign). Our strategy to model the WA during 2013 relied on the assump-tion that most of the parameters of the classic persistent WA out-flow will remain the same with respect to the archival observa-tions, at least the number of components, their outflow velocity, broadening of the lines and, possibly, their column density. If one gets an accurate characterization of the WA from past obser-vations, this baseline model can then be applied to the obscured spectrum of NGC 5548, dramatically decreasing that number of free parameters that would prevent a spectral analysis otherwise.
Our second motivation stems from the fact that different
atomic physics codes were used to derive the WA properties reported in the literature. The ionization state of the WA com-ponents is usually computed using a photoionization code that calculates the transmission through a slab of material where all ionic column densities are linked through a photoioniza-tion balance model. Previous modeling of the NGC 5548 WA
made use of XSTAR1 (Kallman & Krolik 1999) or CLOUDY2
(Ferland et al. 2013), which use slightly different atomic physics databases. Furthermore, since past observations of NGC 5548 span many years, the published WA parameters are computed using different versions of these codes, which evolve and are up-dated with time.
Differences between photoionization codes and versions of
codes are not negligible. To illustrate this, in Fig. 1 we show four stability curves obtained from the output ionization balance
provided by different versions of XSTAR and CLOUDY. In all
cases the input spectral energy distribution (SED) was that of NGC 5548 reported by Steenbrugge et al. (2005). While the four lines agree reasonably well at low ionization values, the diff er-ences between them are dramatic for higher values of the
ion-ization parameter ξ. In particular, the ionization balance used
by Steenbrugge et al. (2005), computed with XSTAR v1, lacks several unstable areas (the branches with negative slope) and the Compton shoulder at high temperatures. Even the more re-cent versions of CLOUDY and XSTAR (v13 and v2.2.1, respec-tively), although they reproduce the same overall shape reason-ably well, show strong deviations with respect to each other. The solid dots overplotted on top of the curves represent the posi-tions where the WA components detected by Steenbrugge et al. (2005) fall, showing that a fit to the same spectrum with such different ionization balances provide significantly different
ion-ization parameterξvalues.
Therefore, in order to obtain a comprehensive picture of the WA properties that can be used as a template for the 2013-2014 campaign as well as consistent parameter values, it is essential to re-analyze the archival grating spectra of NGC 5548 using the same, and most up-to-date, photoionization code for all of them.
2.2. Archival data
We used a total of 12 Chandra and XMM-Newton individual
archival observations in this paper. In some cases, the observa-tions were taken in consecutive orbits and with the same instru-mental configuration, allowing us to co-add the spectra in order to obtain a better signal-to-noise ratio. Below we briefly describe each of the observations. The observations log is shown in Ta-ble 1.
Prior to the 2013 campaign, NGC 5548 was observed three
times by XMM-Newton, once in 2000 (ObsID 0109960101)
for 26.1 ks, and twice in 2001 (ObsIDs 0089960301 and
1 http://heasarc.gsfc.nasa.gov/docs/software/xstar/xstar.html 2 http://www.nublado.org
0089960401) for ∼ 96 and 36 ks, respectively. In this
paper we used solely the Reflection Grating Spectrometer (RGS, den Herder et al. 2001) data, that were processed
us-ing the XMM-Newton Science Analysis System (SAS) v13.5
(Gabriel et al. 2004). The data were rebinned by a factor of 3 to avoid oversampling. In what follows, the RGS spectra will be identified in the paper as R00x, R01y, and R01z, respectively.
There are nine archival observations of NGC 5548 taken with
the gratings onboardChandra, seven with the Low Energy
Trans-mission Grating Spectrometer (LETGS, Brinkman et al. 2000) and two with the High Energy Grating Spectrometer (HETGS,
Canizares et al. 2005). The HETGS/ACIS-S spectra were
ex-tracted from the TGCat archive3. The data were binned by a
fac-tor of two, and the Gehrels-statistic used by default in HETGS data was replaced by the true Poissonian error. In order to ob-tain consistent results for the MEG and HEG gratings, the MEG fluxes were scaled by a factor of 0.954 relative to the HEG fluxes. The observations were performed in 2000, with an exposure of
82 ks, and in 2002 as part of an UV/X-ray campaign with an
exposure of 153 ks (Steenbrugge et al. 2005). Throughout this paper these observations will be identified as H00 and H02, re-spectively.
The LETGS/HRC-S spectra were reduced using the
Chan-dra Interactive Analysis of Observations software (CIAO,
Fruscione et al. 2006) v4.5, until the level 1.5 event files were created. The rest of the procedure, until the creation of the fi-nal level 2 event files, was performed following an independent method first reported in Kaastra et al. (2002). This results in an
improved wavelength accuracy determination and effective area
generation. NGC 5548 was observed withChandraLETGS once
in 1999 for 86 ks (labeled as L99 hereafter), and twice in 2002, 2005, and 2007. In the latter three cases the observations were taken in consecutive orbits, allowing us to co-add the two spectra to obtain a higher signal-to-noise. Therefore, we ended up with
a∼ 340 ks spectrum in 2002,∼141 ks in 2005, and∼138 ks
in 2007, that are labeled throughout the paper as L02, L05, and L07, respectively.
3. Data analysis
3.1. Strategy
The archival observations of NGC 5548 sum up to∼1.1 Ms of
exposure time of grating spectra, although with great disparity in data quality among the different datasets. A modeling strategy that makes the most of this large amount of data is therefore required in order to maximize the scientific return. On one hand, fits to the individual observations in which all the parameters are left free would lead to too large error bars for most of the
relevant parameters, or in those observations with a low S/N in
completely unconstrained values. On the other hand, a joint fit of all the spectra together (3 RGS, 2 HETGS, and 4 LETGS) is not feasible, as it requires a prohibitive amount of computing time due to the large number of data channels and models that need to be evaluated together.
We therefore adopted a mixed approach for modeling these data. Since the 2002 data constitute the bulk of the archival data
(∼ 500 ks taking the L02 and H02 observations together), and
they are dominant in terms of S/N contribution, we used them
to create a model template for the rest of the archival obser-vations. We first obtained a best-fit model for the 2002 data, including the continuum, broad and narrow emission lines, ra-diative recombination continua (RRCs), and absorption troughs
Table 1. NGC 5548 archival observations log.
Observatory Grating ID Start Time (UTC) Exp. Time Labela
(yyyy-mm-dd hh:mm:ss) (ks)
XMM-Newton RGS 0109960101 2000-12-24 22:12:11 26.1 R00x
XMM-Newton RGS 0089960301 2001-07-09 15:45:59 95.8 R01y
XMM-Newton RGS 0089960401 2001-07-12 07:34:56 39.1 R01z
Chandra LETG 330 1999-12-11 22:51:20 86.0 L99
Chandra HETG 837 2000-02-05 15:37:29 82.3 H00
Chandra HETG 3046 2002-01-16 06:12:34 153.4 H02
Chandra LETG 3045 2002-01-18 15:57:02 169.4 L02b
Chandra LETG 3383 2002-01-21 07:33:57 171.0 L02b
Chandra LETG 5598 2005-04-15 05:18:18 116.4 L05b
Chandra LETG 6268 2005-04-18 00:31:12 25.2 L05b
Chandra LETG 7722 2007-08-14 20:57:57 99.6 L07b
Chandra LETG 8600 2007-08-17 03:54:51 37.2 L07b
Notes.(a)Label used to identify the spectra throughout the paper; (b)Observations with the same label are co-added to produce a single spectrum for analysis.
produced by the WA (see the detailed modeling in Sect. 3.2). This best-fit model was then used as a starting point to ana-lyze the rest of the archival spectra, leaving as free parameters
only those of the continuum, the flux of the Oviiforbidden line,
and the ionization parameter logξof each WA component. The
Oviiforbidden line flux was set free since it is known to vary
(Detmers et al. 2009), whereas the rest of the lines are too weak to measure significant changes or are not even significantly de-tected (partially due to the wavenlength coverage, partially due to the lower S/N). Therefore, all other parameters describing the
emission lines as well as the absorption lines (NH, outflow
ve-locity, velocity broadening) are kept frozen.
With this strategy we aim at determining the most relevant parameters that are known to vary between observations, such as the spectral shape of the continuum and the WA ionization pa-rameter. The dynamics of the persistent outflows in NGC 5548 have barely changed over∼20 years, i.e. the different kinematic
components can be easily cross-identified between the different
observations, but their ionization state can be substantially diff er-ent. We therefore assume that the observed variations in the WA are mainly due to ionization changes rather than being caused by the dissapearance of any of these outflows, or the appearance of newer ones.
3.2. Modeling
The archival grating spectra of NGC 5548 were analyzed
using the SPEX fitting package4 version 2.05 (Kaastra et al.
1996). The fitting method was C-statistics (Cash 1979). The
adopted cosmological redshift for NGC 5548 was z =
0.017175 (de Vaucouleurs et al. 1991). The foreground Galactic
column density was set to NH=1.45×1020cm−2(Wakker et al.
2011) using the hot model in SPEX, with the temperature fixed to 0.5 eV to mimic a neutral gas. Throughout the analysis we assumed proto-Solar abundances of Lodders & Palme (2009).
4 http://www.sron.nl/spex
1013 1014 1015 1016 1017 1018 1019
10
−14
10
−13
10
−12
10
−11
ν
Fν
(erg s
−1
cm
−2
)
ν (Hz)
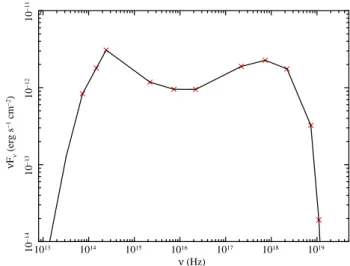
Fig. 2. Spectral energy distribution of NGC 5548. Data points are those
of Steenbrugge et al. (2005).
3.2.1. TheChandra2002 spectra
As mentioned in Sect. 3.1, we modeled the L02 and H02 datasets in order to obtain a baseline model template that could be used as a starting point to analyze the remaining archival spectra. The methodology reported below was firstly described in the supple-mentary material of Kaastra et al. (2014). The fits were carried
out in the 2−60 Å range for the LETGS spectrum, and in the
1.55−15.5 Å and 2.5−26 Å range for the HEG and MEG
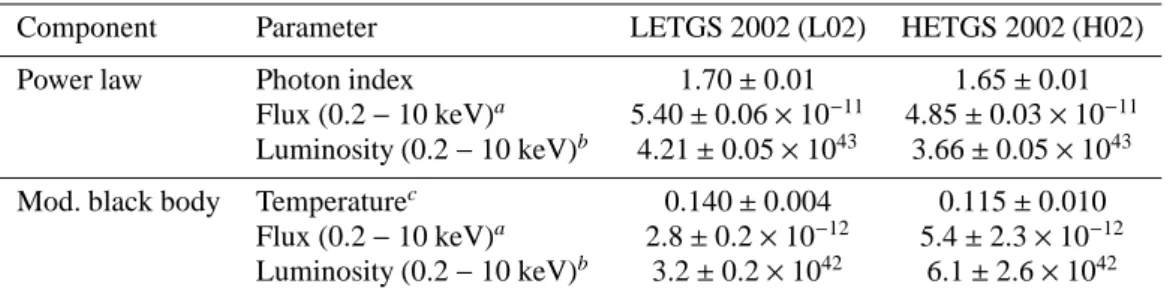
spec-tra, respectively. The continuum was modeled with a power law plus a modified black body (mbb model in SPEX), which con-siders modifications of a simple black body model by coherent Compton scattering based on the calculations of Kaastra & Barr (1989).
Superimposed to the continuum we added four broad
emis-sion lines, modeled with Gaussians, representing the 1s−2p and
1s−3p transitions of Ovii, and the 1s−2p transition of Oviiiand
Cvi. Their parameter values were taken from the previous
6 8 10 12 14
0
5
10
x10
−4 Counts cm
−2
s
−1 Å
−1
Observed wavelength (Å) L02
Ne VII
Ne VIII
Ne IX
Ne IX
Ne IX Ne X
Ne X
Mg IX
Mg XI
Mg XI Mg XII
Si XIII
16 18 20 22 24
0
5
10
x10
−4 Counts cm
−2
s
−1 Å
−1
Observed wavelength (Å) L02
N VII O VII O VI O V
O VII
O VII
O VII
O VII O VIII
O VIII
O VIII
O VIII
24 26 28 30 32
0
5
10
x10
−4 Counts cm
−2
s
−1 Å
−1
Observed wavelength (Å) L02
C VI
C VI N VI
N VI
N VII S XIII
34 36 38 40 42
0
5
10
x10
−4 Counts cm
−2
s
−1 Å
−1
Observed wavelength (Å) L02
C V
C V
C VI S XII Si XII
C V S X
42 44 46 48 50
0
5
10
x10
−4 Counts cm
−2
s
−1 Å
−1
Observed wavelength (Å) L02
Si XI
S X S XI Si X S VIII S VII S IX S IX Mg IX S IX Si VIII
52 54 56 58 60
0
5
10
x10
−4 Counts cm
−2
s
−1 Å
−1
Observed wavelength (Å) L02
Si X Si IX Mg VIII Ne VIII Si VIII
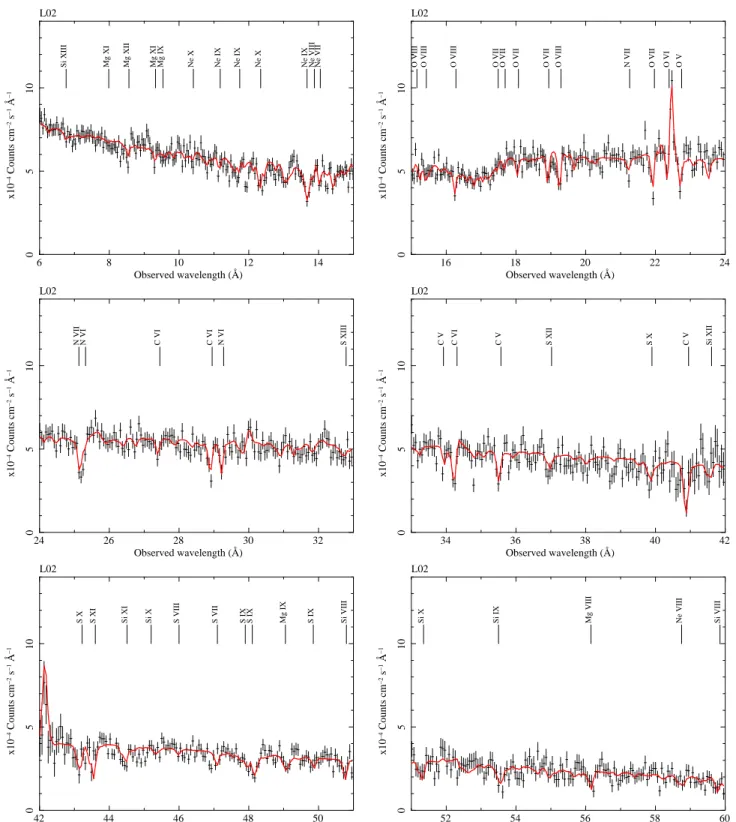
Fig. 3.Chandra LETGS spectrum of NGC 5548 in 2002 (L02). The solid red line represents our best-fit model. Some relevant WA absorption features have been labeled.
the He-like Cv, and the 1s−2p transitions of Nexand Nvii,
as well as radiative recombination continua (RRCs). With the exception of the forbidden lines of Oviiand Cv, these lines are
difficult to detect in the L02 and H02 spectra. Therefore we fixed their normalization to the values obtained in the 2013 campaign (Whewell et al. 2015), where the lines are clearly visible against the strongly obscured continuum. The narrow lines and RRCs
are convolved with a velocity dispersion ofσv = 463 km s−1
(see the supplementary material in Kaastra et al. 2014). For
fur-ther information we point the reader to Whewell et al. (2015), who present a detailed analysis of the narrow lines and RRCs in NGC 5548.
spec-Table 2. Continuum best-fit parameters of the 2002 observations.
Component Parameter LETGS 2002 (L02) HETGS 2002 (H02)
Power law Photon index 1.70±0.01 1.65±0.01
Flux (0.2−10 keV)a 5.40±0.06×10⁻¹¹ 4.85±0.03×10⁻¹¹
Luminosity (0.2−10 keV)b 4.21±0.05×1043 3.66±0.05×1043
Mod. black body Temperaturec 0.140±0.004 0.115±0.010
Flux (0.2−10 keV)a 2.8±0.2×10⁻¹² 5.4±2.3×10⁻¹²
Luminosity (0.2−10 keV)b 3.2±0.2×1042 6.1±2.6×1042
Notes.(a)In units of erg cm−2s−1; (b)in units of erg s−1; (c)in units of keV.
Table 3. Emission features best-fit parameters of the 2002 observations. Values without uncertainties are kept frozen.
Component Line Rest wavelengthb FWHMb Luminosityc
Broad emission Cvi1s−2p 33.74 0.90 1.9
linesa Ovii1s−2p 21.60 0.58 3.4
Ovii1s−3p 18.63 0.50 1.4
Oviii1s−2p 18.97 0.51 2.8
Component Line Rest wavelengthb σ
vd Luminosityc
Narrow emission Ovii f 22.101 382 4.7±0.4
lines Cv f 41.472 382 2.3±0.1
Component Line Rest wavelengthb σ
vd Luminosityc
Narrow emission Nex1s−2p 12.134 463 0.09
linese Neixr 13.447 ′′ 0.22
Neixi 13.553 ′′ 0.14
Neix f 13.699 ′′ 0.78
Oviii1s−3p 16.006 ′′ 0.27
Oviir 21.602 ′′ 1.09
Oviii 21.807 ′′ 1.07
Nvii1s−2p 24.781 ′′ 0.33
Nvir 28.787 ′′ 0.26
Nvii 29.084 ′′ 0.25
Nvi f 29.534 ′′ 0.60
Component Ion Emission measuref σvd Temperatureg
Radiative recombination Cvi 90 463 5.6
continua (RRC)e Cvii 61 ′′ ′′
Nvii 11 ′′ ′′
Oviii 29 ′′ ′′
Oix 7.3 ′′ ′′
Nex 4.3 ′′ ′′
Nexi 1.6 ′′ ′′
Notes.(a)Values from Steenbrugge et al. (2005); (b)in units of Å; (c)in units of 1040erg s−1; (d)convolved velocity dispersion, in units of km s−1; (e)values from Whewell et al. (2015); (f)in units of 1059cm−3; (g)in units of eV.
tral energy distribution (SED) of Steenbrugge et al. (2005) (see Fig. 2). The output photoionization balance was provided to SPEX to fit the absorption troughs caused by an intervening WA. Since Steenbrugge et al. (2005) used an older version of their photoionization code, we looked for further WA components that might have remained undetected in their analysis.
We started from the four WA components reported in Steenbrugge et al. (2005), and added additional xabs compo-nents on a one-by-one basis until the fit no longer improved.
The xabs free parameters were the ionization parameter logξ,
the hydrogen column density NH, the outflow velocity vout, and
the Gaussian turbulent velocityσv, while the covering factor was
fixed to unity. The ionization parameterξis a measure of the ion-ization state of the gas, and it is defined as
ξ=L/nR2, (1)
where L is the ionizing luminosity in the 1−1000 Ryd range, n
The L02 and H02 spectra were fit simultaneously, but we allowed the power law and modified black body parameters to be different for each dataset (to account for continuum variability),
as well as the ionization parameters logξof the WA (to account
for possible short-term variations, as the observations were taken 3.5 days apart). The rest of the parameters were coupled so that they had the same values for both datasets. We assumed that the WA components absorb the continuum and the broad emission lines, but not the narrow emission lines and RRCs.
We found that the WA in NGC 5548 is composed of six dis-tinct ionization phases, labeled from A to F in order of
increas-ing ionization. The final C-stat/d.o.f. was 2402/2090 for L02,
and 2890/2560 for H02. The best-fit values of the joint L02 and
H02 analysis are reported in Tables 2, 3, and 4. The logξvalues
of these observations presented here differ from those shown in
Table S2 in the supplementary material of Kaastra et al. 2014 by
∼0.25 dex due to a bug in CLOUDY, which caused the ionizing
flux to be calculated in the 1− ∞range instead of the
conven-tional range of 1−1000 Ryd. The L02 spectrum together with
the best-fit model are shown in Fig. 3.
3.2.2. The remaining archival spectra
After obtaining a best-fit model for the 2002Chandraspectra,
we used it as a template for modeling the remaining archival datasets. As we mentioned in Sect. 3.1, we left as free param-eters in the fits only the continuum paramparam-eters (power law and
modified black body emission), the flux of the narrow Ovii
for-bidden emission line, and the ionization parameter of each WA component. The remaining parameters were kept fixed to those obtained in the joint fit of the L02 and H02 datasets. In modeling the WA, the ionization balance used as input by xabs was based on the SED of Steenbrugge et al. (2005), because it is the one with a wider contemporaneous frequency coverage. We there-fore adopted it as a template SED for the rest of the archival ob-servations. We note that, although ideally one would need to de-rive a SED for each of the individual observations, the assump-tion of a template SED will not significantly affect the xabs pa-rameters determination. In the absence of huge spectral changes
(such as those originated by obscuration events), the different
SEDs may change their normalization due to the intrinsic vari-ability of the source but not their shape, which is the key factor in computing the xabs parameters. The best-fit results are shown in Table 5.
The ionization structure of the WA in NGC 5548 depicted in
the 2002Chandraobservations, showing six distinct ionization
components, is also seen in the rest of the archival datasets. In some cases, some of the components are either not detected or are blended with other components due to a poor signal-to-noise ratio of the spectrum. This is the case for R00x (very short
expo-sure,∼26 ks) or L07 (very low intrinsic flux). A more detailed
view of the parameter variability between the different archival
observations is discussed in Sect. 4.
4. Discussion
4.1. Spectral properties
The archival observations of NGC 5548 span almost 8 years,
with the bulk of the datasets taken in the period 1999−2002. In
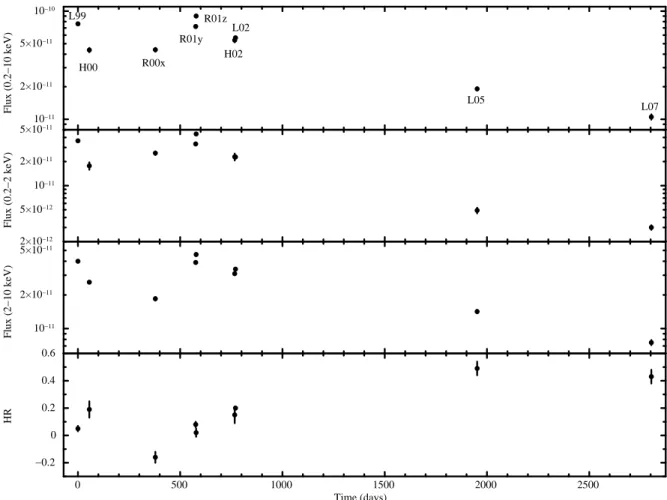
Fig. 4 we show the evolution in time of the overall 0.2−10 keV
flux of the source to provide a reference on the flux state of the source at the epoch of each observation, along with the soft (0.2−
2 keV) and hard (2−10 keV) fluxes, and their hardness ratios
(HR=(H−S )/(H+S )).
In the 1999−2002 period, NGC 5548 experienced a
max-imum flux variability of a factor of ∼ 2, with a median flux
of ∼ 5 ×10⁻¹¹ erg cm−2 s−1. In 2005, the overall flux
de-creased by almost a factor of 3 with respect to the L02 obser-vation, and even further in 2007 when it reached a minimum of
∼ 10−11 erg cm−2 s−1. The behavior of the soft (0.2−2 keV)
and hard (2−10 keV) X-ray fluxes is very similar, following
the same trends as the overall X-ray flux over the years. This suggests that the source variability is due to intrinsic changes rather than obscuration processes such as the one reported in Kaastra et al. (2014). During the obscuration event the hard X-ray flux stayed at the historical values while the soft X-X-ray flux decreased dramatically. Furthermore, this supports our approach of using the 2002 SED for the WA analysis of all the archival observations, as the variations only involved the normalization but did not significantly changed the shape of the SED. More detailed studies of the broadband continuum of NGC 5548 is reported in Mehdipour et al. (2015a) (Paper I) and Ursini et al. (2015) (Paper III). An in-depth discussion on the origin and vari-ability of the soft excess in NGC 5548 is also reported in Papers I and VI (Mehdipour et al. 2015a,b).
4.2. Thermal stability of the warm absorber
Some clues on the structure of the X-ray WA can be drawn from the thermal stability curves of the photoionized gas. These curves, also known as cooling curves, are determined by the ionizing SED that illuminates the gas. They are typically
rep-resented as plots of the pressure ionization parameter Ξ as a
function of the electron temperature T . The pressure ionization
parameterΞ(Krolik et al. 1981) is defined as
Ξ =L/4πr2cp=ξ/4πckT, (2)
whereξ is the ionization parameter defined in Eq. 1, c is the
speed of light, k is the constant of Boltzmann, and T is the
elec-tron temperature. The different values ofΞwere computed
us-ing CLOUDY version 13.01, which provided a grid of
ioniza-tion parametersξand their corresponding electron temperatures
T for a thin layer of gas irradiated by the ionizing continuum.
For consistency with the analysis we performed in Sect. 3.2, we used as input SED that of Steenbrugge et al. (2005) for all of the archival observations, and assumed the proto-Solar abundances of Lodders & Palme (2009).
The curve thus generated divides the Ξ−T plane in two
regions: below the curve heating dominates cooling, whereas above the curve cooling dominates heating. In the points on the curve, the heating rate equals the cooling rate so that the gas is in thermal equilibrium. The branches of the curve with negative
derivative dT/dΞ<0 (those where the curve turns backwards)
are unstable against isobaric thermal perturbations (e.g., vertical displacements from the curve). This means that for a photoion-ized gas in an unstable branch, if it is subject to a small positive temperature perturbation its temperature will keep increasing un-til it reaches a stable branch of the curve (those with positive
derivative dT/dΞ > 0). Conversely, a small negative
tempera-ture perturbation will cause the gas temperatempera-ture to decrease
un-til it falls in a stable region of theΞ−T plane. Moreover, gas
components sharing the sameΞvalue are nominally in pressure
Table 4. Warm absorber best-fit parameters of the 2002 observations.
Component logξa(L02) logξa(H02) NHb σ
vc voutc
A 0.51±0.08 0.60±0.16 2.0±0.6 210±40 −588±34
B 1.26±0.05 1.42±0.06 7.0±0.9 61±15 −547±31
C 1.90±0.03 2.18±0.10 15.3±3.3 19±6 −1148±20
D 2.10±0.03 2.26±0.05 10.7±1.6 68±14 −254±25
E 2.68±0.08 2.64±0.05 28.0±8.1 24±12 −792±25
F 2.87±0.05 3.10±0.04 57.1±17.0 34±13 −1221±25
Notes.(a)In units of erg cm s−1; (b)in units of 1020cm−2; (c)in units of km s−1.
Table 5. Best-fit parameters of the remaining archival observations.
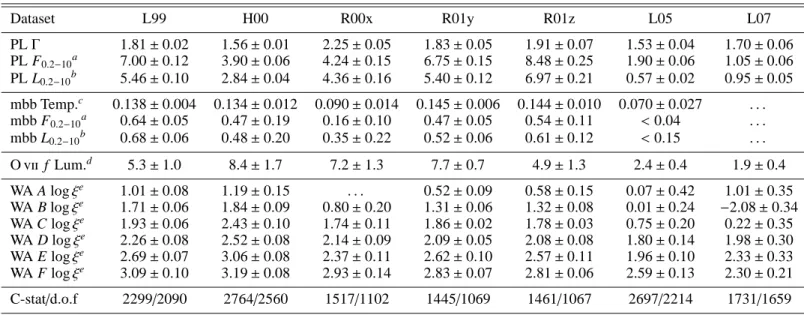
Dataset L99 H00 R00x R01y R01z L05 L07
PLΓ 1.81±0.02 1.56±0.01 2.25±0.05 1.83±0.05 1.91±0.07 1.53±0.04 1.70±0.06
PL F0.2−10a 7.00±0.12 3.90±0.06 4.24±0.15 6.75±0.15 8.48±0.25 1.90±0.06 1.05±0.06
PL L0.2−10b 5.46±0.10 2.84±0.04 4.36±0.16 5.40±0.12 6.97±0.21 0.57±0.02 0.95±0.05
mbb Temp.c 0.138±0.004 0.134±0.012 0.090±0.014 0.145±0.006 0.144±0.010 0.070±0.027 . . .
mbb F0.2−10a 0.64±0.05 0.47±0.19 0.16±0.10 0.47±0.05 0.54±0.11 <0.04 . . .
mbb L0.2−10b 0.68±0.06 0.48±0.20 0.35±0.22 0.52±0.06 0.61±0.12 <0.15 . . .
Oviif Lum.d 5.3±1.0 8.4±1.7 7.2±1.3 7.7±0.7 4.9±1.3 2.4±0.4 1.9±0.4
WA A logξe 1.01±0.08 1.19±0.15 . . . 0.52±0.09 0.58±0.15 0.07±0.42 1.01±0.35
WA B logξe 1.71±0.06 1.84±0.09 0.80±0.20 1.31±0.06 1.32±0.08 0.01±0.24 −2.08±0.34
WA C logξe 1.93±0.06 2.43±0.10 1.74±0.11 1.86±0.02 1.78±0.03 0.75±0.20 0.22±0.35
WA D logξe 2.26±0.08 2.52±0.08 2.14±0.09 2.09±0.05 2.08±0.08 1.80±0.14 1.98±0.30
WA E logξe 2.69±0.07 3.06±0.08 2.37±0.11 2.62±0.10 2.57±0.11 1.96±0.10 2.33±0.33
WA F logξe 3.09±0.10 3.19±0.08 2.93±0.14 2.83±0.07 2.81±0.06 2.59±0.13 2.30±0.21
C-stat/d.o.f 2299/2090 2764/2560 1517/1102 1445/1069 1461/1067 2697/2214 1731/1659
Notes.(a)Observed flux, in units of 10−11erg cm s−1; (b)in units of 1043erg s−1; (c)in units of keV; (d)in units of 1040erg s−1; (e)In units of erg cm s−1.
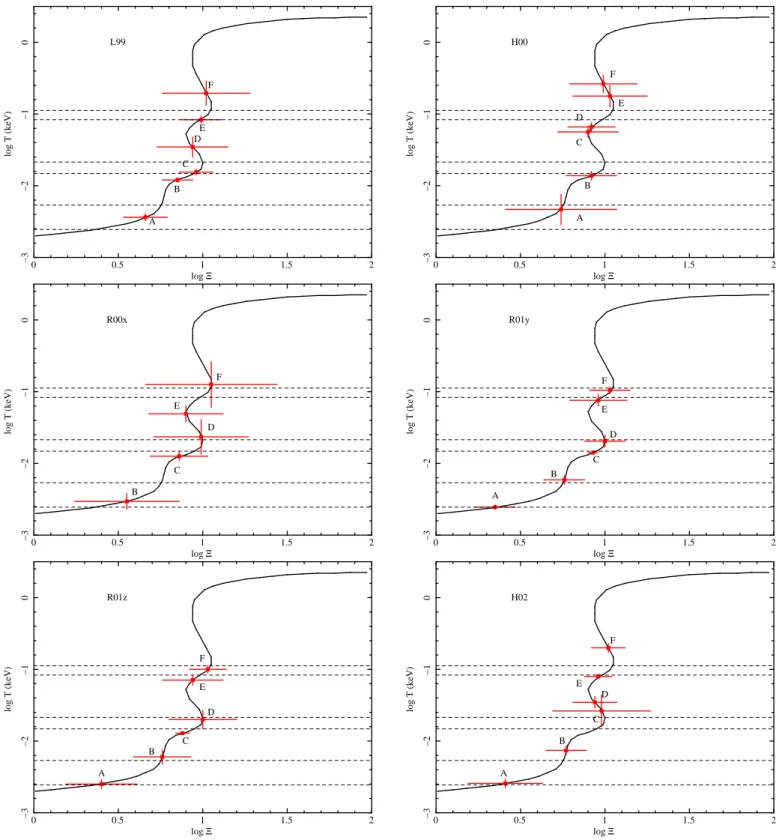
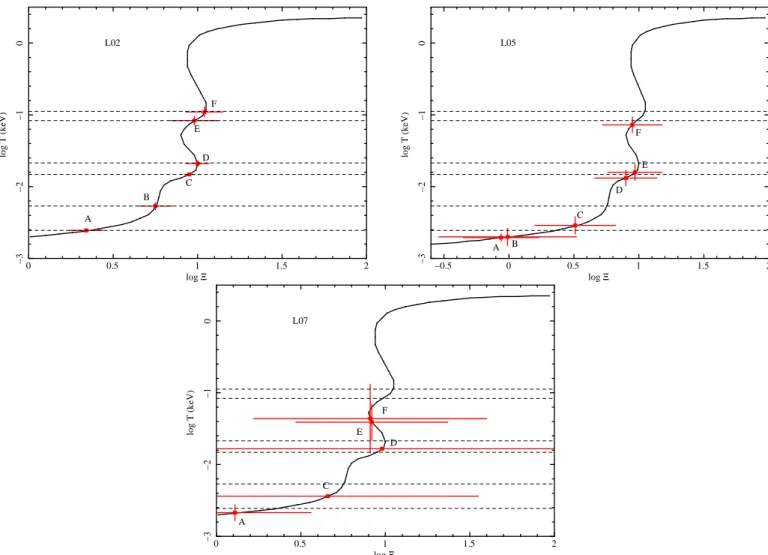
In Figs. 5 and 6 we show the thermal stability curves of the archival observations of NGC 5548 analyzed in this paper. The curves are the same in all of the observations since the same input SED was used to generate the curve. Overplotted
on the curves are the different WA components detected in each
archival observation. While in most of the cases the WA com-ponents B to F seem to be in pressure equilibrium, the extent of the uncertainties makes the opposite equally likely, and therefore there are no grounds to claim pressure equilibrium. The large er-ror bars associated with most of the observations are mainly due to the uncertainties in the determination ofξ. It is possible that some of the components might be truly in pressure equilibrium, but their different outflow velocities and turbulence suggest that they likely originate from different spatial regions.
On the other hand, we can examine the evolution of the WA
components as they move along the curve between the diff
er-ent epochs of the archival observations. Since the uncertainty of the WA components in the vertical axis is much smaller than in the horizontal axis, it is possible to examine vertical displace-ments along the curve. For this reason, for comparison among
the different datasets, we also show as horizontal dashed lines
in Figs. 5 and 6 the location of the WA components in obser-vation L02, the one with the best determined WA parameters. In the first grating observation (L99) the flux of the source was slightly higher than in L02. The WA components are higher on the curve than at the L02 epoch except for components C and E,
which were in a similar ionization state. In H00, an observation taken almost 2 months later, the overall flux decreased by a fac-tor of 2 but all the WA components were in a higher ionization state. Component C "jumped" the unstable branch that was just above its position in the L99 curve, almost blending with com-ponent D. Similar jumps happen for comcom-ponents E and F. In this case, the drop in flux between L99 and H00 could have hap-pened shortly before the observation, not giving the gas enough time to respond to this change. In support of this argument, R00x was observed almost 11 months after H00, maintaining a similar flux level, but with all components significantly less ionized. The uncertainties in this observation, however, are quite large due to
the short exposure (only 26 ks). R01y, observed∼200 days later,
has a flux higher by a factor of∼2 compared to R00x, and it has
10−11
10−10
2×10⁻¹¹
5×10−11
Flux (0.2−10 keV)
L99
H00 R00x R01y
R01z
H02 L02
L05
L07
10−11
2×10⁻¹²
5×10⁻¹²
2×10⁻¹¹
5×10−11
Flux (0.2−2 keV)
10−11
2×10⁻¹¹
5×10−11
Flux (2−10 keV)
0 500 1000 1500 2000 2500
−0.2 0 0.2 0.4 0.6
HR
Time (days)
Fig. 4. Fluxes in the 0.2−10 keV, 0.2−2 keV, and 2−10 keV bands, and hardness ratios (HR=(H−S )/(H+S )) as a function of time in days
since the first observation (L99) for all of the observations used in this paper.
L05 was observed∼ 3 years later when the source had a flux
level∼ 3 times lower than in the L02 epoch. Even though the
error bars are rather large, one can see a dramatic change in the location of the WA components on the curve, all of them mov-ing toward lower positions in the curve. The last observation in 2007 has the lowest overall flux, several times lower than that of L02, and the associated error bars are so large that no useful con-clusion can be extracted from it other than the WA components seem to be located at similar positions as in 2005.
It is worth noting again that each observation is just a snap-shot of a dynamical picture in which each gas component is re-acting differently to changes in the ionizing flux over the years, a picture that is incomplete since we do not have a continuous monitoring of the flux history of the source between observa-tions. However, this provides support for the fact that the
re-sponse to flux variations on different time scales is motivated
by the different densities of the absorbing gas components. If
their densities could be constrained through their variability, we would have a powerful tool to also constrain their location with respect to the central ionizing source.
4.3. Warm absorber variability
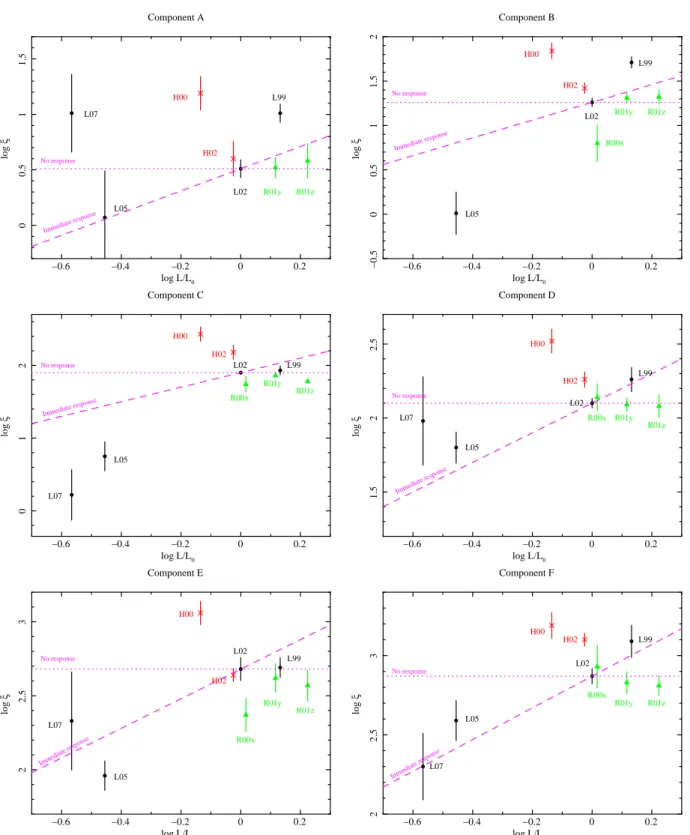
Motivated by the behavior of the WA components along the sta-bility curves shown in Sect. 4.2, we looked for additional signa-tures of variability that would help to constrain the typical time scales at which each component responds to flux changes. In
Fig. 7 we show the values of the ionization parameterξ
plot-ted against the ionizing luminosity L for each component and
archival observation using the L02 parameters as reference val-ues. We chose to use L02 for its quality and because the WA parameters were best determined for this observation. For each component the dotted horizontal line indicates that the WA did not respond to variations in flux with respect to that of L02 (i.e.
the ionization parameterξ is the same as that of L02 for each
component). A dashed diagonal line showsξproportional to L,
and marks the trend that the WA would follow if the material responds instantaneously to continuum changes.
The lowest flux observations, L05 and L07, have typically
large uncertainties in the ionization parameterξfor all the WA
components. Overall they seem to be consistent with an imme-diate response for components A to C, while components D to
F could be consistent with any trend at the 2σconfidence level.
All the WA components of H00 are systematically more ionized that those of L02, even though the ionizing luminosity at the
H00 epoch was ∼20% lower than that of L02. Similarly most
components are more highly ionized in H02, which has an ion-izing flux close to that of L02. The exceptions are components
A and E, which are inconsistent at only the 2σlevel. A similar
behavior is seen for the WA in R00x (ionizing flux comparable to L02) but with systematically lower ionized components, with the exception of components D and F. The observations with higher ionizing luminosity, the RGS observations in 2001 and
L99, show different trends. In general, both R01y and R01z are
closer to the no response trend (i.e. their WA components have a
ξvalue close to those of L02). However, for components A and
B the errors are large enough that they are within 2σalso
0 0.5 1 1.5 2
−3
−2
−1
0
log T (keV)
log Ξ A
B C
D E
F L99
0 0.5 1 1.5 2
−3
−2
−1
0
log T (keV)
log Ξ A
B C D
E F H00
0 0.5 1 1.5 2
−3
−2
−1
0
log T (keV)
log Ξ B
C D E
F R00x
0 0.5 1 1.5 2
−3
−2
−1
0
log T (keV)
log Ξ A
B C
D E F R01y
0 0.5 1 1.5 2
−3
−2
−1
0
log T (keV)
log Ξ A
B C
D E F R01z
0 0.5 1 1.5 2
−3
−2
−1
0
log T (keV)
log Ξ A
B C
D E
F H02
Fig. 5. Thermal stability curves of the NGC 5548 archival observations (L99 and H00 in the top panels; R00x and R01y in the middle panels;
R01z and H02 in the bottom panels) showing the pressure ionization parameter as a function of the electron temperature (solid line). The curves have been computed from the SED of Steenbrugge et al. (2005). The X-ray WA components in each observation are represented as solid squares (A to F). For comparison, the dashed horizontal lines represent in each panel the location of the WA components in the L02 observation.
WA components in L99 show a variety of behaviors: A and B are significantly more ionized than in L02, D and F are consistent with the gas responding immediately, while C and E would be closer to a no response scenario.
It is clear that, in spite of the large uncertainties associated
with the determination ofξ, the WA components show some kind
of variability as seen in Figs. 5, 6 and 7, and in the values listed
in Table 5. If these changes are due to photoionization or recom-bination of the ionized gas in response to continuum changes, it is then possible to estimate a lower limit on the density of the
absorbing gas via the following equation (Bottorffet al. 2000):
trec(Xi)= αr(Xi)n
"f (X
i+1)
f (Xi)
−αr(Xi−1)
αr(Xi)
#!−1
0 0.5 1 1.5 2
−3
−2
−1
0
log T (keV)
log Ξ A
B C
D E
F L02
−0.5 0 0.5 1 1.5 2
−3
−2
−1
0
log T (keV)
log Ξ
A B
C D
E F L05
0 0.5 1 1.5 2
−3
−2
−1
0
log T (keV)
log Ξ A
C
D E
F L07
Fig. 6. Thermal stability curves of the NGC 5548 archival observations (L02 and L05 in the top panels; L07 in the bottom panel) showing the
pres-sure ionization parameter as a function of the electron temperature (solid line). The curves have been computed from the SED of Steenbrugge et al. (2005). The X-ray WA components in each observation are represented as solid squares (A to F). For comparison, the dashed horizontal lines rep-resent in each panel the location of the WA components in the L02 observation.
where trec(Xi) is the recombination time scale of the ion Xi,
αr(Xi) is the recombination rate from ion Xi−1to ion Xi, and f (Xi)
is the fraction of element X at the ionization level i. The
recombi-nation ratesαrare known from atomic physics and the fractions
f can be determined from the ionization balance of the source.
Therefore, for a given ion Xiit is possible to obtain a lower limit
on the density n if an upper limit on the recombination time trec
is known, since trec∝1/n.
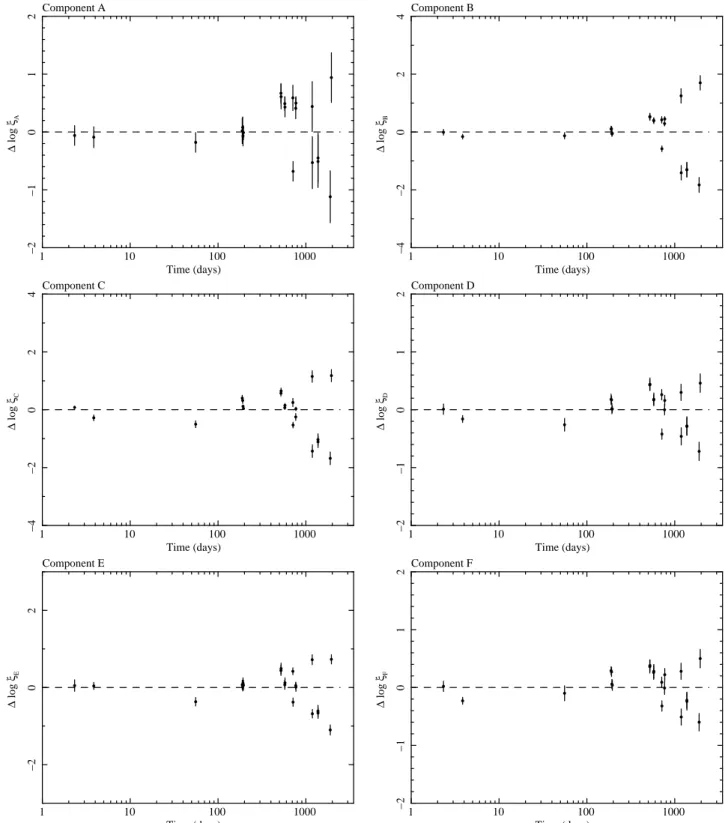
The archival observations of NGC 5548 allow us to probe variability on time scales that range from two days to almost a decade. In Fig. 8 we show the measured variations in the
ioniza-tion parameterξbetween each individual observation (e.g., the
first observation is compared with the rest, then the second is compared with the rest, and so on). This enables us to estimate
the typical time scale at which the different WA components
be-gin to vary, which can be used as a proxy for the recombination time of the gas. In this sense, we will adopt the first point where
significant changes can be seen as trec for a given WA
compo-nent. For component A there are no signatures of variability in
ξ below∼ 500 days, and similarly for component B although
there are marginal hints of variability at 4 and∼60 days.
Com-ponents C and D start showing marginal evidence for variability at 4 days, becoming more significant on time scales of 60 days.
Component E also begins to significantly vary at ∼ 60 days,
while component F does so at 4 days.
Another variable in Eq. 3 that needs to be determined is the fraction of a given element X in an ionization state i. This can be done by means of the ionization balance of NGC 5548 that provides the ionic column densities of all the ions, which can be divided by the total hydrogen column density to obtain f (Xi).
We looked for the ions that contribute substantially to the fit for each WA component (i.e. the ones that because of their column density, oscillator strengths, and signal-to-noise of their features in the spectrum, are driving the fit), so that they can be used as a proxy for that component. We used the ionic column densities of these ions to feed the SPEX auxiliary program rec_time, which delivers as output the product ntrec. The ions used for each
com-ponent and their corresponding ntrec product are listed in
Ap-pendix B. Using the averaged<ntrec>values, and the variability time scales described above as upper limits for trec, we obtained
lower limits to the density of the absorbing gas n for each WA component. We find that the WA components with the lowest density are components A and B (of the order of a few thousands
of cm−3or higher), while the higher ionization components C to
F have densities of the order of tens of thousands of cm−3. These
−0.6 −0.4 −0.2 0 0.2
0
0.5
1
1.5
log
ξ
log L/L0
Component A
No response
Immediate response
L05
H00
H02
L02 L99
R01y R01z
L07
−0.6 −0.4 −0.2 0 0.2
−0.5
0
0.5
1
1.5
2
log
ξ
log L/L0
Component B
No response
Immediate response
L05
H00
H02
L02
L99
R01y R01z
R00x
−0.6 −0.4 −0.2 0 0.2
0
1
2
log
ξ
log L/L0
Component C
No response
Immediate response
L05
H00
H02
L02 L99
R01y R01z
L07
R00x
−0.6 −0.4 −0.2 0 0.2
1.5
2
2.5
log
ξ
log L/L0
Component D
No response
Immediate response
L05
H00
H02
L02
L99
R01y R01z
L07 R00x
−0.6 −0.4 −0.2 0 0.2
2
2.5
3
log
ξ
log L/L0
Component E
No response
Immediate response L05
H00
H02
L02
L99
R01y R01z
L07
R00x
−0.6 −0.4 −0.2 0 0.2
2
2.5
3
log
ξ
log L/L0
Component F
No response
Immediate response
L05
H00 H02
L02
L99
R01y R01z
L07
R00x
Fig. 7. Ionization parameterξagainst the ionizing luminosity L in units of the luminosity of the L02 observation L0for components A and B (top panels), C and D (middle panels), and E and F (bottom panels). Black filled circles represent the LETGS observations, red crosses the HETGS observations, and green filled triangles the RGS observations. The dotted horizontal line indicates no response to continuum changes, while the dashed diagonal showsξproportional to L and indicates instantaneous response to variations in the ionizing flux.
4.4. Location of the warm absorbers
From the definition of the ionization parameter (Eq. 1) it follows immediately that we can use the lower limit on the density n
calculated in Sect. 4.3 to constrain the location of the WA with respect to the central ionizing source:
R≤ pL/nξ. (4)
The ionizing luminosity was calculated by integrating the
template SED shown in Fig. 2 in the 1−1000 Ryd range,
1 10 100 1000
−2
−1
0
1
2
∆
log
ξA
Time (days) Component A
1 10 100 1000
−4
−2
0
2
4
∆
log
ξB
Time (days) Component B
1 10 100 1000
−4
−2
0
2
4
∆
log
ξC
Time (days) Component C
1 10 100 1000
−2
−1
0
1
2
∆
log
ξD
Time (days) Component D
1 10 100 1000
−2
0
2
∆
log
ξE
Time (days) Component E
1 10 100 1000
−2
−1
0
1
2
∆
log
ξF
Time (days) Component F
Fig. 8. Variation in the ionization parameter∆logξon different time scales (in days) for components A and B (top panels), C and D (middle panels), and E and F (bottom panels). The dashed line represents no variability.
for the L02 dataset, which are representative of the flux state and the ionization state of the WA, we obtained upper limits on the distance of the WA components that are listed in the last column of Table 6. We conclude that the WA in NGC 5548 has a strat-ified structure, where the lowest ionization components A and
B are the farthest, at.50 and.20 pc from the central source,
respectively. Components C and D lie at the order of∼4 pc or
less, whereas components E and F are located at pc and sub-pc distances, respectively.
ba-Table 6. Variability time scales, density, and location of the WA components in NGC 5548.
Component <ntrec>(s cm−3) tlower
rec (days) t
upper
rec (days) nlower(cm−3) nupper(cm−3) Rlower(pc) Rupper(pc)
A 1.1×10¹¹ >200 <500 >2 600 <6 500 >31 <50
B 1.2×10¹¹ >200 <500 >2 850 <7 100 >13 <20
C 5.9×10¹⁰ >4 <60 >11 600 <174 000 >1.2 <4.7
D 6.5×10¹⁰ >4 <60 >12 800 <192 000 >0.9 <3.6
E 4.5×10¹⁰ >4 <60 >8 800 <132 000 >0.6 <2.2
F 2.6×10¹⁰ >2 <4 >77 300 <155 000 >0.4 <0.6
sic approach to estimate the distance of the intervening gas used in the literature (e.g., Blustin et al. 2005) is by assuming that the bulk of the WA mass is concentrated in a layer with thickness
∆r that needs to be less than or equal to the distance to the
cen-tral source R so that∆r/R≤1. Together with the approximation
NH≈n∆r, it follows that R≤L/NHξ. Applying this method to
NGC 5548 we derive distance constraints that are at least one order of magnitude higher that those obtained from Eq. 4.
Furthermore, we can use a similar argument based on the non-detection of variability on smaller time scales to set upper limits on the density of the absorbing gas, and hence lower lim-its on their possible location. Following this, we see that
compo-nents A and B have lower limits on R of the order of∼30 and
∼10 pc, while the highest ionization components, C to F, are at
sub-pc scales or further from the black hole (see Table 6). The scenario depicted by these distance estimations, where high-density highly ionized gas is located much closer to the central SMBH than the less dense lowly ionized absorber, is con-sistent with the picture sketched in Kazanas et al. (2012). In this work, a line of sight at a given inclination angle intersects several layers of a stratified wind, each of them with differentξand den-sity such as the ones seen in NGC 5548. WA components with a variety of ionization phases are thus originally launched from different parts of the disk, most likely due to the combined effect of magnetic and radiation pressure (Fukumura et al. 2010).
In the context of the unification models of AGN, these ion-ized winds are much farther from the SMBH than the broad line region (BLR), which is located at a few light-days distance (Pancoast et al. 2014; Kaastra et al. 2014). For comparison, the inner edge of the torus can be estimated from the approximate relation for the dust sublimation radius (Krolik & Kriss 2001)
Rtorus∼L1ion/2,44(pc), (5)
where Lion,44 is the ionizing luminosity in units of 1044 erg s−1,
obtaining a distance of ∼ 1.4 pc. The most ionized WA
com-ponent F is thus generated closer to the disk than the inner edge of the torus, in agreement with the scenario discussed in Kazanas et al. (2012). According to their lower limits on R, com-ponents C to E, all of them with logξ >2, may also extend down to distances comparable to the torus inner edge.
With respect to the location of the narrow line region (NLR) in NGC 5548, Detmers et al. (2009) constrained it to a cone ex-tending between 1 and 15 pc from the central black hole, depend-ing on its exact geometry. More recently, Peterson et al. (2013)
used [Oiii] variability to estimate the size of the NLR in NGC
5548. They found it to be compact (RNLR∼1−3 pc) although its
actual extent is possibly larger if it is elongated toward the line of sight. In this respect, the analysis of the narrow emission lines in the stacked RGS spectrum of NGC 5548 during the 2013-2014 campaign, renders a location for the NLR of rmin=13.9±0.6 pc
from the nucleus (Whewell et al. 2015). This analysis also shows the narrow emission lines to be absorbed by WA component B, located at 13<R<20 pc, a range consistent with the location of the NLR estimated by Whewell et al. (2015), although no con-clusions can be firmly drawn on the possible connection between the absorbers along our line of sight and the emitting clouds that extend over a much larger region.
4.5. Energetics of the warm absorbers
With the distance constraints for the WA derived in Sect. 4.4 we can estimate the amount of mass carried by the outflows into the ISM of NGC 5548. For an outflow in the form of a partial thin spherical shell at a distance R from the central source and moving radially at constant speed v, the mass outflow rate is:
˙
Mout=µmpNHvRΩ (6)
whereµ = 1.4 is the mean atomic mass per proton, mp is the
proton mass, and Ω is the solid angle subtended by the
out-flow, which ranges between 0 and 4π sr. The main source of
uncertainty in this equation is introduced by the parameterΩ,
which depends on the geometry of the WA outflow and is
usu-ally unknown. Typicusu-ally, Ω = π/2 sr is assumed, as inferred
from the observed type-1/type-2 ratio in nearby Seyfert galaxies
(Maiolino & Rieke 1995), and the fact that ionized outflows are detected in approximately half of the observed Seyfert 1 galaxies (Dunn et al. 2007). This value is only an estimate, and we note that it will not hold if the outflows are bent because of gravita-tional and/or magnetic processes.
Since ˙Mout scales with the distance R, the farthest
compo-nents will carry considerably more mass per unit time than the inner ones, even if the former are much less dense than the lat-ter; and similarly for the fastest winds with respect to the slower velocity winds. Indeed we calculate that for components A, B, and C, located at pc-scale distances, their mass outflow rates are of the order of ˙Mout ≃0.05ΩM⊙yr−1. These values are almost
a factor of two higher than those of components E and F, with mass outflow rates of ˙Mout≃0.03ΩM⊙yr−1. We have expressed all these ˙Moutvalues as a function ofΩto reflect the uncertainty associated with this parameter.
Assuming that the absorbers subtend a solid angle ofΩ =
π/2 sr, the mass outflow rates for components A to C are in the
range of ˙Mout∼0.06−0.09 M⊙yr−1, while those of components
E to F are of the order of∼ 0.04−0.05 M⊙yr−1. Component
D contributes much less with ˙Mout ∼ 0.01 M⊙ yr−1. The ˙Mout
values for all WA components are reported in Table 7. In gen-eral, these values are similar or slightly higher than the mass accretion rate of the source, ˙Macc ≡ Lbol/ηc2 = 0.05 M