Association between Physical Activity and Risk of Occupational Injury
By
Cindy Feltner, MD
A Master’s Paper submitted to the faculty of the University of North Carolina at Chapel Hill in partial fulfillment of the requirements for the degree of Master of Public Health in
the Public Health Leadership Program.
Chapel Hill
2011
Advisor
Date
Second Reader
Abstract
Background: Physical activity is associated with lower rates ofchronic diseases and
injuries in the elderly. The objective of this study was to determine whether self-reported
physical activity and participation in a workplace physical fitness program are associated
with lower rates of Workers’ Compensation (WC) claims, controlling for other risk factors.
Methods: Thisretrospective cohort study examined data from 22,831 health care and
university employees (72,633 full-time equivalents [FTE]) with at least 1 health risk
appraisal between 2003 and 2009. The main outcome measure was stratified rates of
WC claims per FTE. Independent variables included self-reported physical activity,
participation in a workplace fitness program, BMI, sex, age, race/ethnicity, smoking
status, employment duration, and occupational group. Results of bivariate analyses and
multivariate Poisson regression models are reported.
Results: Moderately physically active employees had fewer injuries over time than did
those who reported no regular activity, in a generally linear relationship ranging from
6.53 claims per 100 FTEs for sedentary persons to 4.53 claims per 100 FTEs for those
who exercise 4-5 days per week. Those who exercise every day; their claims
approached those who reported no regular physical activity. Controlling for other
independent variables, employees who exercised for 30 minutes 2-3 days per week or
4-5 days per week had lower rates of injury than did the sedentary (IRR= 0.84-5 and 0.86
respectively). Participation in a workplace physical activity program had no apparent
effect.
Conclusions: Moderate levels of self-reported physical activity appear to predict lower
Acknowledgements
This study was conducted as a component of an obesity intervention study funded by
the National Institute for Occupational Safety and Health (NIOSH). I would like to
express my gratitude to all those who helped make this work possible. The research
conducted for this paper would not have been possible without the guidance and support
of my readers Dr. Sue Tolleson-Rinehart and Dr. Carol Epling. I am indebted to Dr. John
Dement who guided me through the study design and statistical analysis. I also would
like to thank Dr. Doug Myers, Epidemiologist at Duke Occupational Medicine, for
Table of Contents
Abstract ... ii
Acknowledgements ... iii
Table of Contents ... ………iv
List of Tables and Figures………....v
Introduction………...……...6
Background:
Physical Activity and the Workplace………...……...8
Physical Activity and Risk of Injury……….………...10
The Boundary between Individual Health and Worplace Safety...……..13
Methods………..15
Results………....19
Discussion ... 21
Conclusion ... 24
Tables and Figures ... 25
Appendix 1: Systematic Review: Obesity and Occupational Injury ... 31
Appendix 2: Methods Background:
Live for Life
and Physical Activity ... 41
List of Tables and Figures
Table 1. Baseline Demographics of Study Cohort ... 25
Table 2. Bivariate Models of Rates of Workers Compensation Claims ... 27
Table 3. Multivariate Models of Rate Ratios of Worker’s Compensation Claims ... 29
Introduction
The relationship between physical activity and occupational safety has not been
considered widely in the literature. Workplace injuries are common and lead to morbidity,
mortality, and significant financial and social costs (Schulte 2007). According to the US Bureau
of Labor and Statistics, employees suffered 3.6 cases of nonfatal, recordable, injuries or
illnesses per 100 FTE in 2009 (Bureau of Labor Statistics, 2009). At the same time, physical
inactivity and obesity are major public health concerns, and sedentary behavior is on the rise in
both the workplace and non-occupational settings. Strong scientific evidence supports the
contention that physically active adults have lower rates of all-cause mortality, coronary heart
disease, high blood pressure, stroke, type 2 diabetes, metabolic syndrome and certain types of
cancer compared with less active people (Physical Activity Guidelines Advisory Committee,
2008). However, in terms of workplace safety, physically demanding work is generally
considered to be a risk factor for higher rates of occupational injury. Although personal health
factors such as smoking and obesity have been linked to higher rates of occupational injury, the
relationship between physical activity and workplace injuries has received little attention outside
of occupational related activity.
Evidence exists which suggests that obesity is related to higher rates of occupational
injury (see Appendix 1). The underlying etiology for this association is unclear. It has been
hypothesized that obesity could lead to higher rates of injury through multiple mechanisms,
including compromised gait and mobility, fatigue due to sleep apnea, poor ergonomic fit, the use
of potentially sedating medications to treat diseases associated with obesity, and inability to
tolerate physically demanding work (Pollack and Cheskin 2007). Although the determinants of
obesity are complex, they are strongly related to energy expenditure and lower rates of physical
activity is a potential contributor to both obesity and functional impairment that may lead to
is becoming increasingly prevalent (Alley 2007). Physical activity has shown to be protective
against falls and injury in the elderly, regardless of body weight (Skelton and Beyer 2003); the
same may be true of physical activity as a prevention strategy against occupational
musculoskeletal injuries.
The development of optimal prevention programs is an additional reason to consider the
relationship between occupational safety and physical activity. Healthy People 2020”s (CDC)
national objective to increase the rates of physical activity among adults and children
emphasizes partnerships with worksites to “increase the proportion of employed adults who
have access to and participate in employer-based exercise facilities and exercise programs”
(CDC, Healthy People 2020). This emphasis is particularly important given that adults spend up
to a quarter of their lives at work, and the work environment may affect their eating habits and
activity patterns (Schulte et al 2007). While these programs aim to improve overall health
among employees, their effect on worker safety has not been widely considered. If these
programs improve rates of injury among employees, this information may give employers
additional incentives to devote resources into developing and expanding worksite health
initiatives.
In 2004, the National Institute for Occupational Safety and Health (NIOSH) launched the
“Worklife” initiative to “promote information dissemination, research, and policy development
relevant to the integration of worksite health protection and health promotion programs and
policies” (Cherniack et al 2011 pg 11). Considering workplace safety and personal health
together has the benefit of creating programs that simultaneously promote healthy lifestyle
choices and workplace safety. Paradoxically, trying to link workplace safety and personal health
also has ethical, legal and policy implications that include the risk of overlooking important
workplace determinants of injury. Despite this conflict, since both occupational injury and
physical inactivity lead to significant health, financial, and social burdens, the value of
The purpose of this paper is to examine whether workers who are more physically
active, by self-report and through participation in an employer-based physical fitness program,
are less likely to experience a workplace injury compared with workers who are not active,
regardless of other factors.
Background
Physical Activity and the Workplace
Leisure-time physical activity (LTPA) appears to have remained relatively stable over
time, while activities related to work, transportation, and household chores have all declined
substantially (Hu 2008). Because of the importance of physical activity to overall health and
obesity prevention, declines in one area may require increases in others in order to maintain
optimal health. Changes in occupational energy expenditure (OEE) have occurred over several
decades and have been attributed to a progressive decline in the percent of individuals
employed in goods producing and agriculture occupations and an increase in the percent of
individuals employed in service occupations (Church et al 2010). One analysis of data from the
National Health and Nutrition Examination Surveys (NHANES) III suggested that the likelihood
of being obese can be reduced by about half in persons who do not engage in LTPA if they
maintain a physically active occupation (King et al 2001). And another analysis concluded that
daily occupation-related energy expenditure has decreased by more than 100 calories in both
women and men over the past five decades, and this reduction in occupational energy
expenditure can be held accountable for a large portion of the observed increase in mean U.S.
weight over the past 5 decades (Church et al 2010). Clearly there are other determinants of
obesity, yet a change in occupational energy expenditure is important given that working adults
The consequence of changes in occupational energy expenditure has primarily been
analyzed by considering the effect on rates of obesity among adults. At the same time, more
literature has addressed various personal risks and costs associated with obesity. A systematic
review of the relationship of BMI and occupational injury is presented in Appendix 1. Overall,
recent studies consistently show a higher risk of occupational injury with increased BMI. Most
studies are small and vary in the way they account for injury rates and control for confounding
factors. There is also significant variability in the hypotheses offered for the association between
obesity and injury rates. Despite the limitations of this body of data, examining more closely the
link between obesity, physical activity and rates of injury may provide insight into how to develop
programs which both improve health and lower rates of workplace injuries.
One link between declining OEE, weight gain, and increased risk of occupational injury
might be the role of physical activity as a modifying factor. Examining changes in total daily
physical activity – both leisure and occupational – is complex. Survey data paint confusing
pictures of daily energy expenditure outside of work. According to NHANES data and other
surveys, the time spent in recreational activities has increased but so has time spent watching
TV and engaging in other sedentary behaviors (Hu 2008; Church 2010). When physical activity
is assessed with accelerometers, rather than relying on self-reports, the number of Americans
that meet federal physical activity recommendations falls significantly to 1 in 20 (Troiano et al
2008). Given that it is unlikely that there will be a return to occupations that demand moderate
levels of physical activity, focusing on promoting physically active lifestyles through the
workplace becomes increasingly attractive.
Worksite initiatives that target healthy eating and physical activity have become
widespread. Employers are interested in programs and policies that improve worker health, and
ultimately reduce healthcare costs. Anderson et al conducted a systematic review of the
effectiveness of worksite interventions targeting nutrition and physical activity in 2009 for the
programs in promoting a healthy weight. Participation in a worksite health promotion program
was associated with a modest reduction in weight among workers. At 6-12 months of follow-up,
there was a 2.8-pound loss on average (95% CI= -4.63, -0.96) based on a meta-analysis of nine
RCTS (Anderson et al 2009). The authors note that the additional positive health benefits of
these programs (physical and mental health effects for example) were not commonly measured.
These additional positive health effects, beyond modest reductions in weight, may be equally
important in improving overall health. Injury prevention may be one of the positive
consequences of engaging in regular physical activity or workplace fitness initiatives.
Physical Activity and Risk of Injury
In some ways, workforce sectors that previously contained many jobs with heavy
physical loads have undergone a transition towards less strenuous work, not only because of
technical developments, but also because of successful health and safety interventions (Straker
et al 2009). An unintended consequence of this transition may be that workers employed in
occupations with low physical demand may have traded an elevated risk of occupational injury
for other detrimental health effects. Regular physical activity clearly has musculoskeletal
benefits beyond those related to weight loss. In an extreme example, prolonged bed rest is
known to reduce muscle strength by up to 0.5% per day and bone mineral density by up to 0.4%
per day (Greenleaf et al 1989). Chronic low levels of physical activity have also been associated
with osteoporosis, hypertension, coronary artery disease, diabetes and some cancers (Physical
Activity Guidelines Advisory Committee, 2008). The relationship between physical workload,
personal health and safety is more complex than avoidance of injury.
The traditional ergonomic principle of injury prevention was that “less is better” – optimal
biomechanical strain (Straker et al 2009). Newer approaches have proposed that both too small
and too large exposures are a problem for health Today, current thinking contends that work
can provide an opportunity for instigating physical loads that can aid in protecting against ill
health. A new paradigm would require work to be designed not only to avoid ill health, but also
to provide sufficient doses and variation of physical stress to have positive health benefits. This
has led to initiatives that promote “active breaks” in jobs that are primarily sedentary, such as
initiatives that promote using stairwells, stretching and brisk walking while at work (Straker and
Mathiassen 2009). Other examples include treadmill walking while working with a computer.
These initiatives can be hampered by concerns over productivity or appropriateness for specific
occupations given the diverse nature of job tasks.
Is work a health enhancement opportunity? As discussed above, public health agencies
would like to see the workplace used as a venue to promote healthy lifestyles (Healthy People
2020). In some ways the workplace meets these expectations, such as with successful smoking
cessation programs. Many workplaces also have wellness programs that offer opportunities for
fitness programs. Some argue that these campaigns and initiatives for increased activity should
be directed toward increasing physical loads at the workplace not just through leisure time
activities (Straker and Mathiassen 2009). However, despite theories about the proposed
benefits in musculoskeletal strength, bone density and other positive health benefits with
diversification or increases in occupational physical activity, few studies have evaluated the
effects of these programs on outcomes other than weight loss or productivity measures such as
lost work days and absenteeism (Anderson et al 2009).
Little research evaluates physical activity frequency or interventions to increase activity
and the risk of occupational injury. This is in part due the difficulty in measuring physical activity
and determining causality. For example, prior injuries or co-morbid conditions may both lead to
lower rates of physical activity and predispose to injury. Most studies are cross-sectional, limited
One recent study at a large university examined self-reported rates of physical activity on rates
of back injuries using a health risk assessment to determine physical activity frequency. Those
participants who exercised vigorously for at least 20 minutes, 3 or more days per week, or 3 or
more days per week of combined vigorous exercise and moderate-intensity physical activity,
were significantly less likely to have a back injury than were participants who were less active
(OR=29.68, 95% CI=25-35.25, p<. 001) (Bidassie et al 2009). One study of materials-handling
industry workers was able to evaluate for factors related to physical fitness. This industry has a
historically high rate of musculoskeletal injuries and requires frequent physically demanding
work. Workers who had lower percentages of body fat (measured by skin-fold) and higher
aerobic power had significantly lower rates of injury compared with those who had lower aerobic
power and higher percentage of body fat (Craige et al 2006).
One appropriate analogy for the potential benefits of physical activity in the workplace
may be to look at the data on prevention of falls in the elderly. Like occupational injuries, some
fall risk factors in the elderly are not modifiable (age, sex, social class, chronic medical
conditions, visual impairment) and others have the potential to be so (physical activity,
environmental risk factors and the effects of sedating medications). Physical activity is felt to be
important in preventing falls, having the functional capacity to get up after a fall and repair from
injury (Skelton and Beyer 2003). Aging is associated with a loss of muscle mass (sarcopenia)
that is independent from weight loss. Even in fit, athletic elderly adults, some degree of
sarcopenia occurs. However, some degree of loss previously felt to be associated with aging is
now thought to result from disuse (Skelton and Beyer 2003). Multiple RCTs and
epidemiological studies show that various types of physical activity initiatives can prevent falls
and bone fractures. In general, moderate physical activity can improve strength and balance,
which are known risk factors for falls. Incorporating weight resistance exercises into these
programs can reduce fracture risk (Skelton and Beyer 2003). It is unclear if similar programs
The boundary between Individual Health and Workplace Safety
Complex workplace and individual health variables affect the risk of occupational
injury. The development of appropriate policy and prevention programs requires us to consider
where we draw the line between individual health and workplace safety. Traditionally, these two
areas were kept separate. Individual health status has historically been perceived as the result
of an individual’s behavior, biology or circumstance. Occupational disease and injury prevention
have historically been perceived as the responsibility of the employer and a consequence of
physical hazards in the workplace, such as toxic chemical exposures. Lifestyle-related
disorders, such as obesity and physical inactivity, are increasingly challenging this paradigm.
A large body of research documents the effect of individual health status on risk of
occupational injury. Considering lifestyle factors and workplace safety together leads to ethical
and policy implications. While the evidence suggests that higher BMI is associated with a
higher rate of injury (Appendix I), there is also evidence suggesting that workplace conditions
can contribute to increased rates of obesity through changes in occupational-related energy
expenditure. (Church et al 2011). Knowing how to transform research on individual level risk into
effective policy changes in the workplace is challenging when work-related factors also may be
contributing to an unhealthy lifestyle.
This relationship is made more complex by competing policy interventions surrounding
the relationship between workplace safety and individual health. Existing policies influence the
degree to which we can consider workplace safety and individual health promotion together,
and affect our ability to create prevention programs. First, systems of overlapping rules govern
employee safety. National standards (developed by OSHA) protect workers from agreed upon
safety hazards. Laws enforce many of these standards, and noncompliance can be associated
set certain standards which institutions uphold (such as work hour restrictions for graduate
medical training). Individual institutions set their own safety standards as well. Local
management practices can affect worker safety- managers have the ability to ensure that proper
personal protective equipment is available and that employees have ergonomically appropriate
equipment and work stations. Considering individual level risks of injury is also addressed in
pre-placement and “fitness-for-duty” examinations. However, when considering
“iifestyle-related” variables, the division between personal health and workplace safety becomes more
difficult to define.
Considering individual health and workplace safety together may mean that everyone
wins: effective strategies are developed that lead to improvements in individual health and also
reduce the rate of occupational injuries. Alternatively, this approach could be used to blame
individual workers for personal characteristics, and such blame may distract from examining
workplace determinants of injury (Schulte et al 2007). Developing prevention strategies that
avoid discriminatory, stigmatizing or punitive policies while appropriately addressing personal
health considerations that can lead to higher rates of injury may be difficult. This difficulty lies in
the dilemma of uncovering the true determinants of lifestyle related disorders. Larger
environmental, cultural and societal determinants may be equally (or more) important in the
development of obesity and physical inactivity as personal behavior.
Federal policy has clearly turned in the direction of examining the intersection of work
and personal life. NIOSH created the “WorkLife Initiative” in 2004, stating “Comprehensive
approaches addressing health risk from the work environment (both physical and
organizational) and from individual behavior are more effective in preventing disease and
promoting health and safety than each approach taken separately.” This initiative funds
research examining the intersection of personal health and safety. In addition, multiple public
Services, emphasize partnerships with worksites to promote personal health and well-being.
These new federal initiatives promoting an integrated approach to wellness exist side by side
with several policies that continue to separate individual health from activities in the workplace,
first among them Worker’s Compensation. “Worker’s comp,” as it is colloquially known, is a
mandatory business insurance that provides employees who become injured at work with
medical coverage and income replacement. It seeks to make a clear distinction between
illnesses and injuries related to explicit workplace exposures and those related to personal
health. Often the distinction may not be clear. The privacy provisions in the Health Insurance
Portability and Act (HIPAA) also includes a reasonable expectation for personal privacy with
regard to health information, and work-based programs that focus on individual behaviors may
be seen as violating HIPAA. The Genetic Information Nondiscrimination Act of 2008 (GINA)
prohibits genetic information discrimination in employment, and even family medical history is
included in the definition of genetic information.
In the context of this continuing and very nuanced tension between traditional workplace
safety and using the workplace as another way of promoting wellness, what can the evidence
base say about how individual health behavior and workplace injuries may interact?
Particularly, in what ways can we promote both personal health and improve safety? That
question is the focus of this study.
Methods
Duke Health and Safety Surveillance System
The Duke Health and Safety Surveillance System (DHSSS) is a comprehensive data repository
constructed from several ongoing programs at Duke and existing data sets such as human
resources, health benefits, industrial hygiene, occupational medicine, workers’ compensation,
System and Duke University. The Duke Health and Safety Surveillance system makes it
possible to analyze data from multiple sources for given individuals, and to define the population
of employees and their demographics, occupations, work locations, potential exposures and
health outcomes (Dement et al 2004). The system allows for the linkage of these data systems
for individual level analysis of occupational exposures and injuries. After the linkage, all data
are de-identified using an external independent contractor and are, thus, anonymous to
investigators.
This study is an extension of a previous cohort study examining rates of WC injury by
BMI category and uses similar methods (Ostbye et al 2004). The aim of this study was to
determine whether physical activity is independently associated with lower rates of workplace
injury, using both self-reported rates of physical activity and participation in a work-place fitness
intervention
Cohort Definition and Follow-up
All Duke Hospital and Duke University employees who are eligible for benefits were
eligible to participate. The study cohort includes all employees who completed at least one
Health Risk Assessment (HRA) during the study period (2003-2009). The DHSSS includes data
from two HRAs; the form was changed midway through the study period (see Appendix 2). The
HRA is voluntary and available at hire and annually to all employees eligible for health benefits.
The HRA includes questions about baseline levels of physical activity, tobacco use, nutrition,
and height and weight measurement.
The first available HRA was used to define the start date of follow-up for each cohort
member. Time at risk was accumulated until employee termination, disability resulting in inability
to work or end of the study period. The first HRA was used to determine self-reported degree of
Individual demographic and job characteristics (sex, age, race/ethnicity, employment duration,
and occupational group) were updated for each year of follow-up (time-varying covariates).
Employment dates and work schedules were used to estimate full-time equivalents (FTEs) for
each cohort member by follow-up year (each employee contributes 1 FTE per year of full-time
employment). This was used to determine exposure time, or time at risk for an occupational
injury.
Intervention
Self-reported physical activity frequency was determined for each employee at the start
of the study period by extraction of data from two HRAs (see Appendix 2). Level of activity was
categorized based on number of days per week an employee participates in 30 minutes or more
of aerobic physical activity and grouped into the following categories: seldom or never, 1 day a
week or less, 2-3 days per week, 4-5 days per week or 6-7 days per week. In addition,
participation in a workplace physical activity program was determined for each employee yearly.
Included in the analysis are two physical fitness programs that aim to incorporate physical
activity into the workday (“stairwell to health” or “take-10” challenge). These are termed
“low-intensity programs”. Also included are several more intensive programs that involve activity
outside the workday (an employer sponsored fitness club membership, Duke Run-Walk
Program, or a group exercise class series such as yoga or aerobics class). These are grouped
together and termed “higher-intensity” programs. The Live-For-Life program and fitness classes
are further described in Appendix 2. Participation was then categorized into three categories:
low-intensity physical activity intervention participation, high-intensity physical activity
intervention participation, or participation in both types of intervention. Participation was counted
Workers’ Compensation Claims
The number of Worker’s Compensation (WC) claims per FTE is the primary outcome
measure in this study. Workers’ Compensation is a state legislated program administered by the
North Carolina Industrial Commission. Duke self-insures employees for workers’ compensation.
All workers’ compensation medical and indemnity claims in the study period were analyzed.
Report only claims, such as first-aid only cases, were excluded. Only new claims (after each
individual’s follow-up start date) were included.
Data Analysis
On the basis of prior studies , a number of sociodemographic variables were included as
potential confounders. Body Mass Index (BMI) is categorized as follows: less than 18.5
(underweight), 18.5-24.9 (normal weight), 25-29.9 (overweight), 30-34.9 (obesity class 1),
35-39.9 (obesity class II), or 40 or higher (obesity class III). Smoking status was categorized as
never smoked, current smoker, past smoker or unknown. Other covariates included sex,
occupational group, age group (15-34, 34-54, or > 55), race/ ethnicity (white, black, or other),
employment duration (years with the current employer [<1, 1-4, 5-9, or > 10 years]), and history
of diabetes diagnosis (yes/no). Diverse occupational groups are included in the analysis; a
“low-risk referent group” includes faculty, house staff, and scientific and administrative personnel.
See Table 1 for a demographic profile of this population.
Overall crude rates of WC claims (per 100 FTEs) were stratified by self-reported physical
activity frequency, level of participation in a fitness program, and by each covariate. Multivariate
Poisson regression models were developed to assess the relative effect of self-reported
physical activity frequency and Live-for-Life fitness program participation on claim rates,
controlling for age, gender, smoking status, duration of employment, history of diabetes, BMI
grouping was used in this analysis. This method has been shown to yield results equivalent to
those obtained by using grouped data analysis of cohort data in traditional Poisson regression
analysis (Loomis et al 2005). Parameters included in the Poisson models included those
included in the prior analyses of the relationship between obesity and WC claims (Ostbye et al
2007).
Pearson’s chi square (for categorical variables) and student’s t test (for continuous
variables) were used to determine if there were differences in sociodemographic variables
among employees who participated in a work-related physical fitness intervention program and
those who did not participate.
This study was approved by the IRBs at both Duke University and UNC University at
Chapel Hill. Data analysis was conducted in SAS and Stata version 11.0.
Results
The study cohort included 22,831 employees (72,633 FTEs during the study period).
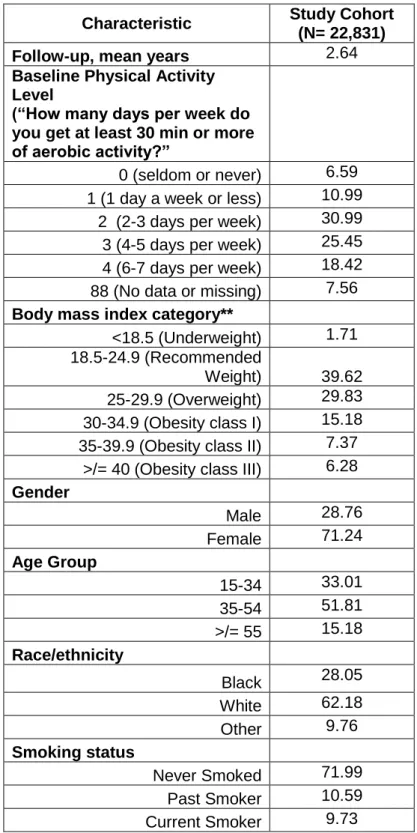
Table 1 gives their characteristics at entry into the cohort. More women than men (71% vs.
29%) are included in the cohort, most likely as a result of the fact that the largest percentages of
participants were employed in the “low-risk” referent group and secretarial staff. Crude rates of
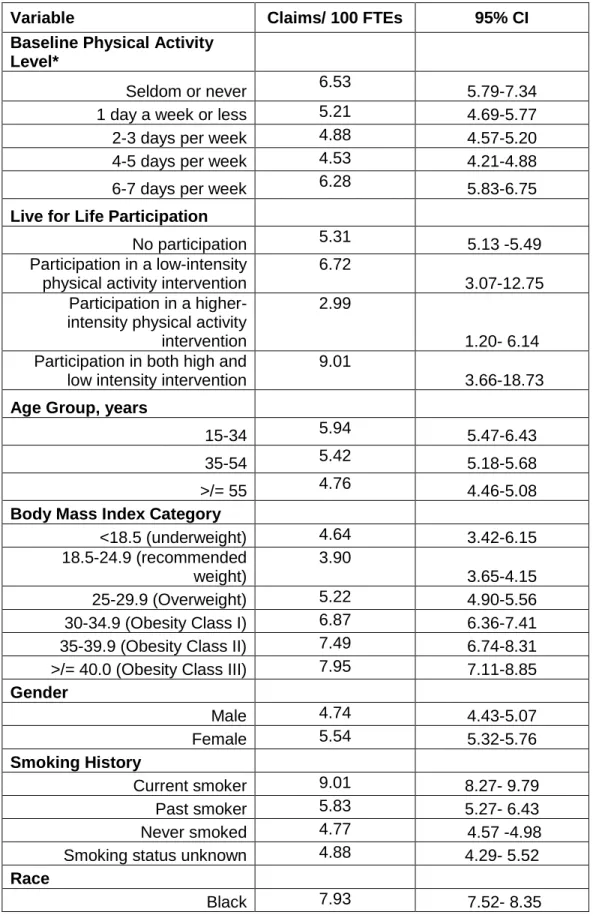
workers’ compensation claims per FTE for the study cohort are given in Table 2. There was a
step-wise decrease in rates of WC claims for increasing levels of self-reported activity
frequency, except for the highest level of activity (6-7 days per week of 30 minutes or more of
aerobic activity) for which the rate of injury increases and approaches that of the group reporting
no regular activity. There was no associated decrease in WC claims for those employees who
participated in a work-place fitness intervention.
Large differences in claims rates were observed by occupational group. Jobs in the
Compared to this group, much higher rates of claims were observed for physically demanding
jobs involving lifting or other ergonomic stress: laundry staff, medical supply assembly
employees, and laboratory animal technicians. Inpatient nurses and nurses’ aids also had high
rates of WC claims, likely reflecting tasks such as patient lifting. The group referred to as “other
high-risk occupations” included employees involved with hospital sterilization, patient services,
clinical supplies, and parking and traffic operations.
Higher rates of WC injuries are seen with increasing BMI category. This parallels the
findings found in an earlier analysis of this cohort (Ostbye et al 2007). Also, in the unadjusted
bivariate models, higher rates of claims were observed in women, current smokers, blacks, and
the lowest category of employment duration.
Table 3 summarizes the relationship between physical activity frequency and the claims
Risk Ratio (RR), adjusted for covariates in the Poisson models. Employees who reported
engaging in 30 minutes or more of aerobic activity 2-3 or 4-5 times per week had a lower RR of
WC claims compared with those who reported seldom or never engaging in physical activity
(IRR 0.86, [95% CI 0.76-0.99] and IRR 0.85 [95% CI 0.74-0.98]). There was a higher risk of
claims for persons in the highest activity group that was not statistically significant (RR 1.14,
95% CI 0.99-1.31) compared with the referent group (seldom or never engaging in physical
activity). There was no association between participation in a fitness intervention and risk of WC
injury.. The multivariate analysis substantiated the much higher risks of WC claims in selected
occupational groups, including laundry staff, housekeepers, and inpatient nurses. It also found a
linear increase in WC claims for rising BMI category. The RR for WC claims was statistically
higher in women, current smokers, and those who have been employed less than one year. No
Pearson’s Chi-square analysis was used to determine whether there was a significant
difference in demographic and work-related variables between employees who participated in a
live-for-life program and those who did not. There was no significant difference between the two
groups in self-reported activity frequency, BMI category, job category, gender, or smoking
status. However, the percentage of employees participating in these interventions was small.
Those who participated in a Live-for-Life fitness program had a statistically higher mean age (42
vs. 40, p=0.0043) that is unlikely to be clinically significant.
Discussion
This is one of the few studies describing the effect of physical activity on rates of WC
claims. The results demonstrate that participants who engage in moderate levels of physical
activity (2-3 or 4-5 days per week of 30 minutes or more of aerobic activity) have lower rates of
WC claims, controlling for multiple covariates. The reduction in risk persisted even when
controlling for BMI and job category. The national decline in physical activity levels, often
attributed to increasing sedentary work pattern and other environmental factors, has been
mirrored by an unprecedented rise in the incidence of obesity and chronic diseases such as
hypertension and diabetes (Murphey et al 2009). These findings suggest that, in addition to
other health benefits of physical activity, lower rates of injury are seen among adults who are
physically active. These findings strengthen the case for public health initiatives that improve
rates of physical activity among adults and indicate that the positive health benefits of physical
activity may include prevention of workplace injury.
Employees who reported the highest rate of physical activity, 30 minutes of aerobic
activity 6-7 days per week, had a higher, although non-significant, increased risk ratio of WC
claims. This unexpected finding might be explained by one study finding showing that persons
non-occupational injury compared with persons who did not sustain an non-occupational injury (Tsai et al
1991). It can be difficult to determine the origin of on or off the job musculoskeletal injuries,
despite using WC claims, and those employees who engage in certain types of physical activity
may have had non-work related injuries. An alternative explanation may be that employees
answered the question in terms of their occupational related physical activity rather than
leisure-time physical activity. The question asks only how often one engages in 30 minutes of aerobic-
exercise per week, but not the type of activity or setting in which it occurs. This study, and
others, clearly document that employees who engage in more physically demanding work are at
a higher risk of injury (Tsai et al 1992).
This analysis also identified several occupations that are at a significantly increased risk
of WC claims, pointing out the need to pair individual level interventions that target lifestyle
factors with broader workplace environmental interventions. Most high-risk jobs were associated
with lifting and other ergonomic hazards. Balancing these changes with the potential benefits of
physical work in protecting against chronic diseases is a challenge. This challenge calls for a
multidisciplinary approach with ergonomic input on the design of work tasks to maximize
positive health benefits, in addition to individual level health interventions.
Newly hired employees had a higher injury rate, possibly speaking to the need for proper
training and education regarding injury prevention. Smoking’s apparent association with higher
rates of injury may simply mean that smoking is a proxy both for other comorbind conditions
and, in recent years, for lower SES, making it more likely that smokers are working in more
physically demanding or unsafe jobs
The Live-for-Life fitness program participation had no apparent effect on injury rates.
Overall, data on participation rates was sparse and we were not able to discern whether an
example, it is possible that some employees who enrolled in a health-club membership did so
for their family and may not have personally participated. Future studies need to monitor actual
participation over time to determine outcomes related to injury prevention at work. Although
demographic variables showed few differences in those who participated and those who did not,
the number of employees participating in any fitness program was overall low and important
differences may have been overlooked.
Additional limitations of this study include the fact that physical activity frequency was
only available for those employees who completed an HRA. Those who complete an HRA may
be healthier in some ways than those employees who chose not to participate. There may be
additional work-related and personal characteristics that predispose employees to injury that
were not included in this analysis. Potential work-related factors not included may be
information about shift work, previous history of WC claims or musculoskeletal injury prior to the
start of the study period. For this analysis, the type of WC injury claim (fall vs. low back strain for
example) was not determined. There may be important differences in the types of claims
associated with those who report no regular activity versus employees who are more physically
active. Self-reported physical activity is limited in that it may not accurately reflect energy
expenditure, however, there are few ways to measure exercise frequency in a large study
population. There is no reason to suspect that there was differential inaccurate reporting of
exercise frequency among the participants. Other potential confounds, such as education, other
chronic medical conditions, or use of a sedating medication, may also lead to lower rates of
physical activity and higher rates of injury.
Strengths of this study include the fact that it is based on a comprehensive data set from
a large employer, resulting in a large population with diverse job types. This strengthens the
ability to generalize the results to other populations. The study population includes people of
associated with injury rates was comprehensive, and follow-up occurred over a several year
period. This study also generates several important questions regarding how to maintain
physical activity within the workplace while simultaneously improving safety, especially in jobs
that are more physically demanding.
Conclusion
Increasingly, public health agencies are looking to the workplace as a venue to deliver
interventions that improve the rates of physical activity among adults (HealthyPeople 2020). At
the same time, we are becoming increasingly aware that personal lifestyle factors, such as BMI,
can predispose to higher rates of injury at work. This analysis shows that moderate levels of
self-reported physical activity are associated with lower rates of WC claims. It is unclear whether
employment based physical fitness programs lead to lower rates of injuries in those employees
who participate. Workplace physical activity interventions have primarily been analyzed through
either their effect on the individual worker’s health status (weight loss, rates of chronic disease
such as diabetes) or from a business perspective (return on investment). However, evaluating
the potential effect of these programs on the rates of injuries and potential improvements in
worker safety may help to develop more comprehensive programs that target both individual
Tables and Figures
Table 1.
Baseline Characteristics of the Study Cohort 2003-2009*
Characteristic Study Cohort
(N= 22,831)
Follow-up, mean years 2.64
Baseline Physical Activity Level
(“How many days per week do you get at least 30 min or more of aerobic activity?”
0 (seldom or never) 6.59 1 (1 day a week or less) 10.99 2 (2-3 days per week) 30.99 3 (4-5 days per week) 25.45 4 (6-7 days per week) 18.42 88 (No data or missing) 7.56
Body mass index category**
<18.5 (Underweight) 1.71 18.5-24.9 (Recommended
Weight) 39.62
25-29.9 (Overweight) 29.83 30-34.9 (Obesity class I) 15.18 35-39.9 (Obesity class II) 7.37
>/= 40 (Obesity class III) 6.28
Gender
Male 28.76
Female 71.24
Age Group
15-34 33.01
35-54 51.81
>/= 55 15.18
Race/ethnicity
Black 28.05
White 62.18
Other 9.76
Smoking status
Never Smoked 71.99
Past Smoker 10.59
Smoking Unknown 7.69
Employment duration, years
<1 33.6
1-4 30.8
5-9 13.7
>/= 10 21.8
History of Diabetes
Yes 3.42
No 96.53
Occupational Group
Laundry staff 0.04 All secretarial staff 18.07
Dietary service 1.23
Housekeeper 2.89
Inpatient Nurse 9.58 Laboratory animal technician 0.18 Medical supply assembly 0.04 Nurses’ aide 2.61
Odd job 0.57
Other clinical technicians 7.31 Outpatient nurse 3.86 Skilled craft worker 1.62 Other high-risk occupations 2.95 Low-risk referent group 48.82
Table 2. Bivariate Models of Rates of Worker’s Compensation Claims
Variable Claims/ 100 FTEs 95% CI
Baseline Physical Activity Level*
Seldom or never 6.53 5.79-7.34
1 day a week or less 5.21 4.69-5.77
2-3 days per week 4.88 4.57-5.20
4-5 days per week 4.53 4.21-4.88
6-7 days per week 6.28 5.83-6.75
Live for Life Participation
No participation 5.31 5.13 -5.49
Participation in a low-intensity physical activity intervention
6.72
3.07-12.75 Participation in a
higher-intensity physical activity intervention
2.99
1.20- 6.14 Participation in both high and
low intensity intervention
9.01
3.66-18.73
Age Group, years
15-34 5.94 5.47-6.43
35-54 5.42 5.18-5.68
>/= 55 4.76 4.46-5.08
Body Mass Index Category
<18.5 (underweight) 4.64 3.42-6.15
18.5-24.9 (recommended weight)
3.90
3.65-4.15
25-29.9 (Overweight) 5.22 4.90-5.56
30-34.9 (Obesity Class I) 6.87 6.36-7.41
35-39.9 (Obesity Class II) 7.49 6.74-8.31
>/= 40.0 (Obesity Class III) 7.95 7.11-8.85
Gender
Male 4.74 4.43-5.07
Female 5.54 5.32-5.76
Smoking History
Current smoker 9.01 8.27- 9.79
Past smoker 5.83 5.27- 6.43
Never smoked 4.77 4.57 -4.98
Smoking status unknown 4.88 4.29- 5.52
Race
White 4.27 4.07- 4.48
Other 4.14 3.64- 4.68
Employment duration, years
>/=10 5.28 4.97- 5.59
5-9 4.96 4.59- 5.34
1-4 5.37 5.08- 5.67
<1 6.26 5.52- 7.07
Occupational Group
Laundry staff 39.48 18.93-72.60
Temporary service 2.11 0.26- 7.62
All secretarial staff 4.19 3.83- 4.57
Dietary service 14.32 11.84- 17.16
Housekeeper 15.26 13.56- 17.12
Inpatient Nurse 9.46 8.63-10.34
Laboratory animal technician 26.08 17.84-36.81
Medical supply assembly 17.78 4.84- 45.52
Nurses’ aide 15.73 4.84- 45.52
Odd job 17.59 13.18- 23.01
Other clinical technicians 6.80 6.07 -7.59
Outpatient nurse 5.61 4.71- 6.62
Skilled craft worker 14.78 12.62-17.21
Other high-risk occupations 7.11 5.96 -8.41
Low-risk referent group 2.84 2.66-3.03
Table 3. Multivariate Models of Rate Ratios of Workers’
Compensation Claims
Variable Incidence Rate
Ratio
95% Confidence Interval Baseline Physical Activity
Level*
1 day a week or less 0.93 0.79- 1.08
2-3 days per week 0.86 0.76- 0.99
4-5 days per week 0.85 0.74- 0.98
6-7 days per week 1.14 0.99- 1.31
Live for Life Participation**
Participation in a low-intensity physical activity intervention
1.44
0.75-2.77 Participation in a
higher-intensity physical activity intervention
0.66
0.31-1.38 Participation in both high and
low intensity intervention
1.43
0.68-3.01
Age Group^**
35-54 0.87 0.79-0.95
>/= 55 0.74 0.66-0.83
Body Mass Index Category^
<18.5 (underweight) 1.16 0.87-1.56
25-29.9 (Overweight) 1.19 1.09-1.30
30-34.9 (Obesity Class I) 1.38 1.24-1.53
35-39.9 (Obesity Class II) 1.48 1.30-1.68
>/= 40.0 (Obesity Class III) 1.52 1.33-1.74
Gender^^
Female 1.12 1.03-1.22
Smoking History^^^
Past smoker 1.07 0.96-1.20
Current Smoker 1.38 1.25-1.52
Race #
Black 7.93 7.52- 8.35
Other 4.14 3.64- 4.68
Employment duration##
(years)
5-9 1.07 0.96-1.12
1-4 1.22 1.12-1.35
<1 1.36 1.17-1.58
Laundry staff 7.93 4.21-14.95
Temporary service 0.63 0.16-2.51
All secretarial staff 1.18 1.05-1.33
Dietary service 3.55 3.03-4.07
Housekeeper 3.51 3.03-4.07
Inpatient Nurse 3.22 2.87-3.61
Laboratory animal technician 3.04 5.64-11.46
Medical supply assembly 4.44 1.66-11.89
Nurses’ aide 3.94 3.37-4.61
Odd job 5.09 3.84-6.75
Other clinical technicians 2.21 1.52-2.19
Outpatient nurse 1.83 1.52-2.19
Skilled craft worker 4.60 3.86-4.49
Other high-risk occupations 2.27 1.89-2.72
*Reference is no activity
** Reference group is no participation
***Reference is 15-34 years of age
^ Calculated in weight (kilograms) divided by height in meters squared.
Reference is 18.5-24.9
^^ Reference is male sex
^^^ Reference is never smoked
# Reference race is White
Appendix 1:
Systematic Review of the Relationship of Obesity and Workplace
Musculoskeletal Injuries
Introduction
The relationship between obesity and risk of occupational injury is a complex but
important public health problem. Workplace injuries are common and lead to morbidity,
mortality, and financial and social costs. At the same time, obesity and overweight are major
public health concerns of the general population (Alley and Chang 2007). Obesity is associated
with a number of poor health outcomes, including cardiovascular disease, diabetes, disability
and mortality(Ferraro et al 2002; Flegal et al 2005). And obesity has been associated with
musculoskeletal problems, especially in the lower back, knee, hip and wrist. These types of
injuries represent a large percentage of the total burden of occupational injuries and illnesses
and a major focus of prevention efforts (Wilder and Cicchetti 2009; Wearing et al 2006). There is
also increased awareness of the relationship between obesity and higher rates of disability,
especially among the elderly (Alley and Chang 2007). The consequences of an increased
burden of disability among obese adults could have consequences for the workforce given that
employed adults spend a large percentage of time at work.
At the same time, the relationship between work and obesity is complicated by the
diverse nature of work and diverse determinants of obesity. For example, the pressure and
demands (or lack of physical demands) of work may affect a person’s eating behavior and
activity patterns (Schulte et al 2007). And obesity may affect both work opportunity and
performance as well as modify the relationship between workplace exposure and health
workplace is a potentially important venue to deliver obesity prevention and control programs;
these programs could be more effective if they also addressed both workplace safety and
personal health issues. Research regarding the relationship between obesity and worker safety
is limited. However, in the past few years, several studies have been published that examine the
effect of obesity on work-related injuries. The objective of this review is to evaluate the literature
looking at the relationship of obesity and occupational injuries, in terms of quality of the
evidence, consistency and magnitude of results.
Methods
A systemic search of the peer-reviewed literature was conducted to identify studies
examining the relationship between obesity and occupational injury using Medline (pubmed) on
May 26th 2011. The following Medical Subject Headings (MeShs) and test words were used:
“obesity” OR “BMI” OR “body mass index” OR “overweight” AND “workplace injury” OR
“worker’s compensation” OR “occupational injury” OR “workplace safety.” Limits included adults
19+ years of age, human subjects, and English language. To increase sensitivity of the search,
no limits were placed on type of study or year of publication
Cohort studies, case-control studies and cross-sectional studies of employed adults with
at least a sample size of 400 subjects and which measured both body composition (BMI or
adiposity) and either prevalence or rate of injury over a minimum of a one year period of
follow-up were included. Studies that examined only one narrowly defined type of injury (such as
carpal tunnel syndrome) were excluded.
The initial search resulted in 42 results. All abstracts were reviewed electronically to
determine if they met inclusion criteria. Of the 42, only 4 met the full inclusion criteria. Ten
articles examined weight gain or obesity as a risk factor for one narrowly defined condition (low
outcomes among obese and non-obese participants, 15 did not examine any relationship
between injury rate and obesity, 6 articles were reviews, editorials or letters regarding obesity
among workers.
The reference sections of the four articles that met the inclusion criteria were reviewed to
identify additional studies; two additional studies that met the full-inclusion criteria were
identified and are included in this analysis. Articles were reviewed and the following information
was extracted: publication year, study design, population characteristics of participants,
measurement of obesity, definition and measurement of workplace injury, results and inclusion
of known confounders or risk factors for injury.
Results
Table I describes the six studies identified which investigated BMI or adiposity as a risk
factor for occupational injury and met the full inclusion criteria described above. There was
significant heterogeneity among the study populations, study design, definition of obesity,
definition of workplace injury and follow-up period. Overall, five of the six studies found a
positive relationship between BMI and risk of occupational injury. As a whole, there are
significant concerns regarding selection bias, limits on external validity and limitations in the
ability of these analyses to control for important confounders in the relationship between obesity
and risk of occupational injury.
Chau et al (2009) conducted a cross-sectional survey of employed adults,
randomly selected from the Lorraine community in North-Eastern France, with the goal of
determining personal health factors which are associated with increased risk of occupational
injury. The study was advertised through the media prior to the mailing of surveys to 8.000
randomly selected households; responses were obtained on 44% of the initial sample. For
survey were included in this analysis. Questions including information about sex, age, height,
weight, job category, physical job demands, smoking, alcohol and regular use of psychoactive
drugs and the presence of at least one occupational injury during the two year period before the
survey were included. Obesity was defined as BMI> or =30. The annual incidence rate of at
least one occupational injury was low at 4.45% (this was similar to the total population of France
according to national data). The prevalence of obesity in this sample was also low at
approximately 6%. No relationship between obesity and injury was noted for younger workers;
in workers who were over 45 years of age, the OR of an injury was 2.6 (95%CI 1.2-5.3).
Strengths of this study include its ability to assess occupational injuries across a
population that included various types of workers, self-reported information and a relatively large
sample size. By asking individuals about injuries, this study is not limited by under reporting that
can occur with Worker’s Compensation or employer-based reporting. However, self-reported
results may be affected by recall bias and may include injuries that are non-work related. The
population had an overall low rate of obesity and did not measure other potential confounders
such as degree of physical fitness, length of time in current job or history of prior injuries.
Tsai et al (1992) conducted a study of 10,350 workers employed at Shell Oils
Company’s manufacturing facilities between 1987 and 1989. This was a cross-sectional study
evaluating personal and job characteristics associated with musculoskeletal injuries.
Musculoskeletal injuries were extracted from a health surveillance system that included injuries
resulting in absences in excess of 5 days. Job title was used to identify workers with physically
demanding work and personal health risk factors were derived from pre-placement and periodic
physical examinations. These factors included smoking history, elevated blood pressure and
BMI. Obesity was categorized as greater than or equal to 27.2 for men and 26.9 for women
(values represent 20% more than the ideal body weight based which reflected the NIH
associated with a RR of 1.42 (95% CI: 1.10-1.82) for low-back injury and 1.53 (95% Ci:.26-1.86)
for non low-back musculoskeletal injuries.
This study differs from other studies included in this analysis in that it did not separate
work-related and non-work-related musculoskeletal injuries; however, most injuries were
attributed to occupational exposures. Also, multiple employees (1359) were excluded from the
multivariate analysis because of missing data, which may have affected the validity of the
analyses. Data on personal health factors were extracted from pre-placement and periodic
health exams; these may not be as accurate as personal health records or self-reported
information depending on the depth of questioning which occurred during the exams.
Cohort studies offer the advantage of looking at rates or incidence of injuries over time.
A study by Craig et al in 2006 examined rates of musculoskeletal injuries among materials
handling workers’. This industry has been shown in prior studies to have a high rate of workers’
compensation claims. Volunteers from three Fortune 500 companies located in different
geographic locations were enrolled in the study (403 males and 39 females). The authors
attempted to perform a rigorous job task analysis by examining factor such as lifting frequencies
and weights of materials. Subjects were evaluated with heart rate monitors, coronary risk survey
assessments, general health questionnaires, blood pressure measurements, and several
anthropometric measurements (stature, body weight, height, reach, body fat [skin-fold], and
waist circumference). Injury information was obtained by reviewing company OSHA records for
one year following the initial testing.
Overall, 31% of the cohort suffered a work related injury/illness during the 1-year
follow-up period. The back was the most injured body part followed by the hand, knee and shoulder.
Body fat was categorized into three categories: low, medium and high. BMI was reported in
categorized as “grade 3 obesity.” In the multivariate analysis, participants with a high percent
body fat had a greater risk of suffering an occupational injury (OR=2.70, 95% CI=2.01-3.40)
when compared to the low percent body fat group. However, the relationship of BMI to injury
was not as expected. When compared to those participants in the grade 2 obesity group, the
participants in the grade 1 obesity group had an odds ratio for injury of 6.67 (95% CI=
5.56-7.78) while the participants in the desirable range classification retained an odds ratio for injury
of 10.05 (95%CI= 8.81-11.30).
This study suffers from several limitations. First, the population is young (average age
24), disproportionally male and made up of volunteers. It is possible that less fit workers may
not have volunteered given the rigorous testing involved. The narrow range of work tasks and
population demographics limits the external validity of the study. The percentage of overweight
workers was 14%, less than the average in the US population. The authors propose that the
physical nature of this work may increase strength and lean muscle mass. However, they did
not report whether those who had high versus low body fat differed in terms of BMI. This study
was also limited by questions regarding internal validity. The authors admit that not all
participants completed all testing due to time constraints. Those employees who participated in
more physically demanding work may not have undergone as much testing as those employees
who had more flexibility or less physical demand associated with their particular work. Important
confounders were also not included- such as job tenure and history of previous injuries. A
follow-up period of only one year may lead to misrepresentation the true incidence of injury
based on confounding administrative aspects of work (such as job tenure or changes in work
practice).
The remaining three studies were conducted over at least a two-year period of follow-up,
lending added strength to their analyses. In a study of employees from a multisite aluminum
examined using a company-linked database (Pollack et al 2007). The authors recorded the
occurrence of any traumatic work-related injury over a two-year period; included were injuries
requiring only first-aid attention and those recordable by OSHA. Multiple socio-demographic
variables were included as potential confounders (see Table A-1). The population had an
unusually high rate of workers who were overweight or obese (85%) and the mean BMI was
29.8. Twenty nine percent of employees sustained at least one traumatic injury during the study
period; 30% were OSHA recordable and 70% required first-aid only. After controlling for age,
sex, education, race/ethnicity, smoking, physical demand, plant, time since hire, time on the job,
there were significantly increased odds of injury for persons in the highest obesity category
when compared with the reference group (OR=2.21, 95% CI: 1.34-5.53). The odds of injury for
workers who were overweight or who had a BMI between 25-39.0 was 1.26 (95% CI 1.06-1.50)
and 1.54 (95% CI: 1.22-1.96) respectively.
The substantially greater prevalence of obesity in this population limits the external
validity of the study. It calls into question either a significant difference within the local or
workplace environment or potential concerns regarding the validity of weight and height
measurements. The authors propose the high prevalence of obesity is related to the geographic
locations of the plants (generally the rural South). Validity of injury recording is also a concern.
First aid only reports were included in the analysis and no information was gathered regarding
recurrent injuries- only a first injury was measured during the study period. Strengths of this
study included its large sample size of workers who had diverse work tasks and measurement
of a number of important confounders that were controlled for in what appears to be appropriate
modeling during statistical analysis.
While the above study counted only first time injuries, a study by Froom et al in
1996 suggests that obesity is more strongly related to recurrent workplace injuries. A study of
1985-1987 to determine the effect of personal health factors on rates of occupational injury. Workers
came from diverse industries. Ergonomic evaluations were conducted on-site as were health
surveys, height/weight measurements and physical exams of all participants. Over a two-year
period, 18.6% of the population suffered an injury. In the multivariate analysis, the increased
risk of one accident versus no accidents was not associated with BMI. However, an elevated
BMI increased the risk of multiple injuries over the two-year period, OR 1.25 (95% CI 1.03-1.50).
The effect was strongest for those workers who both worked in an environment with high
ergonomic stress levels and had a BMI>27.8% (OR 4.6 compared with those who have a lower
BMI and job tasks with low ergonomic stress levels).
The authors propose that the relation between BMI and repeat accidents could be
explained by fatigue (perhaps due to increased incidence of sleep apnea). However, no
information on sleep apnea, other chronic diseases or medication use was collected. In this
study, BMI categories were loosely defined and there was only a small sample of employees
with a BMI >30. The limited collection of possible confounders and the lack of inclusion of
women further limit the generalizability of this study. However, measurements appeared
accurate and the large sample size increases the strength of the study.
To determine the relationship between BMI and number and types of worker’s
compensation (WC) claims, costs and lost workdays, Ostbye et al conducted a retrospective
cohort study of employees at Duke University and Hospital system in 2007. The authors used a
database which links human resources, health benefits, industrial hygiene, and worker’s
compensation data. Participants included 11,728 health care and university employees and
analyzed rates of injury per full-time equivalent over a 7-year period of follow-up (1997- 2004).
The main outcome measures included stratified rates of worker’s compensation claims,
associated cost and lost workdays, calculated by BMI category. Multiple covariates were
BMI and rate of WC claims. Both crude rates of claims are presented and IRR of claims; the
effect was seen even when controlling for covariates (Table A-1 for results).
The strengths of this study include the large sample size, measurement of rate of claims
(allowing for more than one claim for employee and counting work-time as a exposure variable).
This study also extended over a longer period of time than other analyses included in this
review. Limitations include the fact that some confounders may not have been measured (such
as shift work physical activity, prior injuries before the start of the study period). This analysis
also included more women than men, which could have influenced the analysis.
Discussion
The results above illustrate the complexity and difficulty in studying the relationship
between personal health factors such as obesity and occupational injury. Because the studies
differ in type of analysis, population and breath of covariates included, each offers some insight
into the effect of BMI on rates of injury. Two studies showed no effect on rates of injury (or first
injury in the study by Froom et al), both were conducted in populations where the prevalence of
obesity was relatively low. These findings call into question what we are really measuring and
the causal role of obesity on rates of injury. Studies differ on what hypothesis are used to
explain the relationship of obesity to rates of injury- poor ergonomic fit, sleep apnea, and higher
rate of co-morbid disorders are all proposed.
All studies suffer from poor external validity to varying degrees. The study by Froom et
al showed that obese men were at higher risk of repeat injury over a two-year period. This study
had a relatively lower number of obese workers, and included mostly male workers. Yet the
findings highlight the need to collect data on a longitudinal basis. The cross-sectional study
from issues such as recall bias, difference in response rates among those who were and were
not affected by occupational injuries.
Measurement and categorization of BMI is also a potential source of error- both
measurement error and in terms of internal validity. Two studies found that rates of injuries
differed by BMI category (Ostbye et al 2007; Pollack et al 2007). The remainder of the studies
categorized BMI ambiguously or based on prevalence of obesity within the sample population.
One analysis found that a higher percent body fat, but no elevated BMI, is associated with an
increased rate of injury. Likely this speaks to the fact that this population was young, male and
almost exclusively involved in physically demanding work. However, this may be an important
source of error in studying the relationship between BMI and injury rates in certain populations.
Two studies appeared to be superior in internal validity and both collected data on a
large cohort of diverse workers using an integrated database (Ostbye et al 2007; Pollock et al
2007). These two studieshad access to a system which links information from human
resources, occupational health, industrial hygiene and medical claims information. These types
of systems are not common yet appear to be the most appropriate way to collect longitudinal
information regarding the effect of individual health factors on rates of occupational injuries.
Conclusion
On the basis of several cross-sectional and large cohort studies, obesity emerges as a
risk factor for occupational injury. However, larger studies are needed among diverse settings to