1
Abstract
Monitoring concentrations of bacterial pathogens and indicators of fecal contamination in coastal and estuarine ecosystems is critical to avoid adverse effects to public health. During storm events, particularly hurricanes, floods, Nor’easters, and tropical cyclones, sampling of coastal and estuarine waters is not generally possible due to safety concerns. It is particularly
2 Based upon our experiments, holding times of up to 21 h appear to have a negligible effect on bacterial concentrations for estuarine waters. However, the findings also suggest that increased variability and growth can occur during the middle of the day. Therefore, if at all possible, analysis schedules should be modified to account for this variability, e.g. collection of samples after overnight storage should occur as early in the morning as practicable.
1. Introduction
1.1. Vibrio spp. and fecal indicator bacteria
Bacteria of the genus Vibrio are abundant in, and autochthonous to, estuarine ecosystems. The genus contains two human pathogens of importance to North Carolina coasts and estuaries, V. vulnificus and V. parahaemolyticus. Both are known to cause disease from ingestion or wound infection (Tantillo et al., 2004). Allochthonous bacteria also exist in estuary ecosystems and can include Enterococcus spp. and E. coli which are used as a proxy of fecal contamination. Fecal contamination demonstrated by high levels of Enterococcus spp. is identified as a causal factor for gastrointestinal illnesses (Currieo et al., 2001; Fries et al., 2006). Urban and agricultural growth in coastal watersheds can increase microbial concentrations through stormwater runoff resulting in a decrease in water quality at locations where recreational and commercial fishing is prominent (Fries et al., 2008). Monitoring bacterial concentrations in coastal systems is therefore critical to avoid adverse effects to public health (Froelich et al., 2013; Burkholder et al., 2004; Currieo et al., 2003; Strom & Paranjpye, 2000).
Studies have documented increases in bacterial pathogens such as Vibrio spp. and fecal indicator bacteria after storm events in the Neuse River Estuary (NRE), North Carolina, USA (Fries et al., 2008; Hsieh et al., 2008). Storm activity in the NRE resuspends sedimentary populations of Vibrio spp. into the water column (Wetz et al., 2008). Due to their affinity for fine particles, resuspension events also increase fecal indicator bacteria concentrations from contaminated stormwater runoff sources (Wetz et al., 2008; Krometis et al., 2007; Characklis et al., 2005).
1.2. Autonomous Vertical Profiler and ISCO Automated Sampler
3 samples. The AVP floats in the upper NRE region near New Bern, NC at what is referred to as Station 60 in previous studies monitoring the NRE (Figure 1) (Fries et al., 2006; Paerl et al., 2006). Within the AVP, an ISCO Automated Sampler is programmed to fill proprietary bottles (1120 mL) with estuary water at a desired sampling scheme of varying time intervals and depths. The ISCO can be triggered at the beginning of severe weather events to collect water
during a storm period.
During sampling and the additional transport time between the AVP and laboratory, ISCO water samples are stored in bottles that are shaded but exposed to ambient temperatures. For example, a typical sampling regime in the NRE collects samples every 6 h for an 18 h period with an additional 3 h of transport time to the lab. Whereas long-term bottle effects of water samples has been sufficiently studied, most studies do not consider or do not provide evidence of potential short-term bottle effects; therefore, it was necessary to study short-term bottle effects especially in the context of ISCO autosampling during pulse stresses (i.e. storms lasting less than 24 h) in coastal marine environments. Environmental microbiologists expressed concern as to whether up to 21 h of bottle storage in the sun-protected but un-refrigerated ISCO affects bacterial concentrations and invalidates the sample from representing in situ
conditions. This report claims that short-term bottle effects are not significant on total Vibrio
4
1.3. Methods in environmental microbiology: Bottle effects
Environmental microbiology studies the interactions of microbes in nature and under anthropogenic conditions. Finding a suitable method to collect field water samples and perform analysis is a challenge in the microbiology field especially considering the plethora of microbial habitats and interactions that influence methodology. Scientists utilize the term “bottle effects”
to explain variability in experimental results, especially those that require transport and storage time before lab analysis.
While attention is given to collecting samples under aseptic conditions and choosing appropriate construction material of sampling containers, few studies mention the artifacts of containment on experimental results. Pernthaler & Amann (2005) articulated the uncertainty around the apparent effect of variability in experimental studies: “Such investigations are often plagued by the mysterious ‘bottle effect,’ a hard-to-define concept that reflects the worry of whether phenomena observed in confined assemblages are nonspecific consequences of the confinement rather than a result of the planned manipulation.” Hammes et al. (2010) summarized bottle effects to include changing cell concentrations, grazing and bacterivory, viability and cultivability, and population composition. As soon as a sample is removed from the field study site, artifacts of enclosure such as change in genetic, biochemical and physical aspects of the sample may be triggered and pose concern as to the validity of experimental results (Madsen 2006). Many published studies implicitly hypothesize a “safe period” of less than 24 h within which samples accurately represent in situ processes and while the general recommendation is to conduct immediate analysis or to minimize time of storage (e.g. Ferguson et al. 1984; O’Carroll, 1988; Brozel & Cloete, 1991; Atlas & Bartha, 1998; Toranzos et al., 2002) studies do not provide direct supporting evidence. Some studies do not even mention effects of confinement on experimental results (e.g. Munn, 2004; Mimura et al. 2005).
5
1.4. In depth: bottle effects
Freshwater and saltwater stored in containers can increase bacterial cell numbers up to three orders of magnitude, especially in samples stored for longer than a day (ZoBell & Anderson, 1936; O’Carroll, 1988). Another study showed a 5 fold decrease in V. cholerae after two days (Heinemann & Dobbs, 2006). The doubling time of culturable bacteria is affected by
containment in as few as 5 h of sample collection (Ferguson et al., 1984). Whipple (1991) saw a 10-15% increase in bacterial concentrations within the first 3-6 h of storage followed by an increase of several hundred percent. Conversely, Brozel & Cloete (1991) did not see a significant increase or decrease of culturable bacteria counts at 4, 10, 20, and 30°C during 24, 48, 72, and 216 h.
When bacterial analysis is performed a distance away from the sampling location, samples are shipped cold because refrigeration is thought to retain bacterial composition and decrease enzymatic reaction rates, cell division and death (Harrigan & McCance, 1976; Brozel & Cloete, 1991). Nevertheless, short-term effects of storage in refrigerated conditions can trigger bacteria into a “viable but not culturable” state, which is similarly induced during the winter months, preventing them from forming colonies during incubation (Roszak & Colwell, 1987). Even at refrigerated temperatures, the dying out of Protozoa and other marine organisms could increase bacteria survival (ZoBell & Anderson, 1936).
7 concentrations (Petersen et al., 1997). On the other hand, Fuhrman & Azam (1980) showed that ATP on walls of glass containers of different surface to volume ratios rose to 3-5% of total ATP by 22 h, but bacterioplankton cell counts were within 5% of each other. Studies that did not observe surface wall growth admit that carbon adsorbs to clean glass surfaces but question how these effects can be dramatic enough to alter growth (Hammes et al., 2010).
During initial colonization on surface walls, microbes interact in cooperative and inhibitory ways, shaping bacteria community structure, for example by decreasing the number of species, in confined samples (Whipple, 1991; Lawrence et al., 2002). Prolonged assays also affect dominance in microbial communities of the sample (Christian & Capone, 2002; Ferguson et al., 1984).
2. Methods
2.1. Experiment Site
8
2.2. Seawater Parameters and Bacterial Analyses
Temperature and pH were recorded using an UltraBASIC UB-5 pH meter (Denver Instrument; Bohemia, NY, USA). A HI96822 Seawater Refractometer (HANNA Instruments Inc.; Woonsocket, RI, USA) was used to determine salinity. Turbidity was recorded using a 2100Q Portable Turbidimeter (HACH®; Loveland, CO, USA).
Water samples were filtered through 0.45-μm pore, glass fiber filters and plated on Thiosulfate Citrate Bile Sucrose (TCBS) agar or CHROMAGAR VIBRIO to quantify total Vibrio spp. (VIB) and presumptive V. vulnificus (VV) and V. parahaemolyticus (VP), respectively. Two plates of different dilutions (1 ml, 5 ml, or 10 ml) using phosphate buffered saline for each sample were prepared. Plates were then incubated for 24 h at 37°C. Green and yellow colonies were counted from TCBS plates to quantify VIB in colony forming units (CFU). Purple and blue colonies were counted on CHROMAGAR plates to quantify VP and VV, respectively, also in CFU. Fecal indicator bacteria Enterococcus spp. (ENT) were quantified using EnterolertTM. Quanti-tray/2000® (IDEXX Laboratories) trays were incubated at 41°C for 24 h and quantification of most probable number (MPN) per 100 ml was calculated based on the numbers of small and large positive wells (Hurley & Roscoe, 1983; Fries et al., 2006).
2.3. Experimental Set-up
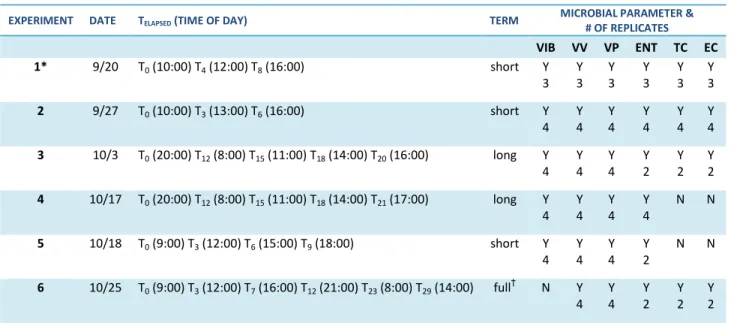
A total of six experiments were conducted during September and October 2013 (Table 1). The six experiments addressed variations in bacterial concentrations according to “bottle effects” associated with water storage in an ISCO autosampler, and used estuarine water from Calico Creek as the source water (Figure 3). Bottles were stored in the ISCO autosampler compartment outside, with the exception of a single replicate set that was taken immediately to the lab for analysis. These samples were labeled as T0. Remaining replicate sets would be retrieved from the ISCO after a specific number of hours after collection elapsed (i.e. T3 after 3 hours elapsed in the ISCO).
9 Table 1. Summary of six experiments conducted September to October of 2013 and their respective
data analyses set and measured parameters.
at 12:00 and 16:00, respectively. VIB, VV and VP were quantified along with TC, ENT and EC concentrations. Temperature, salinity, pH and turbidity were recorded for each water sample at each time point. Because Experiment 1 results did not yield a significant difference between small vs. big bottle sample concentrations for VV, VP and ENT and since the ISCO autosampler uses only small bottles, we eliminated the use of big bottles in Experiment 2. We also did not
measure pH or turbidity since they did not significantly affect bacterial concentrations during the course of Experiment 1. Except for number of replicates and time points, Experiment 2 was
conducted in the same manner as Experiment 1. Replicate sets of 4 were used for analysis at time points T0 (10:00), T3 (13:00) and T6 (16:00).
Water collection for Experiment 3 occurred in the evening. T0 (20:00) bottles were analyzed immediately while T12 (8:00), T15 (11:00), T18 (14:00) and T20 (16:00) bottles were analyzed the following day. Replicate sets of 4, small ISCO bottles were analyzed for temperature, salinity, VIB, VV and VP. Two of the four replicate bottles were analyzed for TC, EC and ENT. Experiment 4 was conducted in the same manner as Experiment 3 except for the last time point was T21 (17:00) and neither TC nor EC were quantified. ENT was calculated for all four replicates at each time point. Experiment 5 consisted of time points T0 (9:00), T3 (12:00), T6 (15:00) and T9 (18:00). This experiment analyzed the same parameters as Experiment 4 except only two replicates were analyzed for ENT.
EXPERIMENT DATE TELAPSED (TIME OF DAY) TERM
MICROBIAL PARAMETER & # OF REPLICATES
VIB VV VP ENT TC EC
1* 9/20 T0 (10:00) T4 (12:00) T8 (16:00) short Y
3 Y 3 Y 3 Y 3 Y 3 Y 3
2 9/27 T0 (10:00) T3 (13:00) T6 (16:00) short Y
4 Y 4 Y 4 Y 4 Y 4 Y 4
3 10/3 T0 (20:00) T12 (8:00) T15 (11:00) T18 (14:00) T20 (16:00) long Y
4 Y 4 Y 4 Y 2 Y 2 Y 2
4 10/17 T0 (20:00) T12 (8:00) T15 (11:00) T18 (14:00) T21 (17:00) long Y
4 Y 4 Y 4 Y 4
N N
5 10/18 T0 (9:00) T3 (12:00) T6 (15:00) T9 (18:00) short Y
4 Y 4 Y 4 Y 2
N N
6 10/25 T0 (9:00) T3 (12:00) T7 (16:00) T12 (21:00) T23 (8:00) T29 (14:00) full† N Y
4 Y 4 Y 2 Y 2 Y 2
*Proof of concept experiment. Small vs. large bottles used.
†
10 Calico Creek water for Experiment 6 was collected in the morning of day 1 and analyzed at T0 and at intervals throughout the day. Leftover bottles were left to sit in the ISCO overnight until analysis continued in the morning and through early afternoon of day 2. The time points were T0 (9:00), T3 (12:00), T7 (16:00), T12 (21:00), T23 (8:00) and T29 (14:00). Each of the four replicate sample bottles was analyzed for VV and VP. Only two of the four were analyzed for TC,
EC and ENT.
2.4. Compilation of Experiments into Short, Long and Full-terms
All raw data was converted into relative change by dividing a measured value by the average of the replicate samples measured at T0 within each experiment. As result, experiment data could then be compiled into three different data analyses sets: short, long and full-term categories (Table 1). Experiments 1, 2 and 5 were compiled into a short-term data set by time of day which was then enhanced by incorporating T3, T7 and T12 time points from Experiment 6 as T3, T6 and T9 time points since they matched in approximate elapsed time and time of day. Experiments 3 and 4 are long-term and Experiment 6 is our full-term experiment. The long term experiment was the only experiment that was conducted starting in the evening.
2.5. Statistical Analyses
One-way ANOVAs with a Holm-Sidak post-test for multiple comparisons run by SigmaPlot determined significance (p≤0.05) between time points.
3. Results
For each of the three compiled data analyses sets, the temperatures according to time of day were significantly different from one another over the course of the experiment (Figure 4). Conversely, salinity remained constant within each experiment (Figure 4).
11 other (p=0.001) (Figure 5c). However, neither T3 (p=0.243) nor T9 (p=0. 302) values were significantly different from T0. ENT decreased through T6 but increased at T9 (Figure 5d).
Over the long-term experiments, the concentrations of VIB (p=0.521), VP (p=0.509), VV (p=0.334) and ENT (p=0.509) were also not significantly different at any time point over the 21 h as compared to the concentration at T0. Total VIB peaked at T12 and T18 (Figure 6a). VP peaked
at T15 and decreased through T21 (Figure 6b). Both VV and ENT peaked at T15 and followed downward trend to T21 (Figure 6c, d).
No significant difference was detected in microbial concentrations over time for the full length experiment for VP (p=0.109), VV (p=0.415) and ENT (p=0.053) concentrations at any point in time as compared to time zero. VP first decreased then peaked at T7 and T23 (Figure 7a). VV peaked at T3, dipped at T7 and continued to increase through T29 (Figure 7b). ENT concentrations peaked at T12 and dipped at T23 subsequently increasing through T29 (Figure 7c).
14
4. Discussion
15 interactions in response to temperature. Bdellovibrio and like organisms (BALOs) preferably consume Vibrio spp. (Williams & Pineiro, 2007). Not only are BALOs associated with surfaces which could increase their abundance in storage bottles, but they are also tightly coupled with temperature (Williams, 1988; Yair et al., 2003). The inverse relationship between temperature and V. vulnificus concentrations may have been a result of diurnal temperature change which
could also affect BALO abundance in the water sample. We hypothesize the increase of BALOs with the increase in temperature following the time of day causes V. vulnificus concentrations to rise and fall. Noon and evening time points exhibit extremes in temperatures potentially increasing the effects of predation. Further research of predator-prey interactions of microbial communities in confinement would provide evidence for our hypothesis. Temperature itself could be playing an important direct role on bacterial growth, effecting metabolism directly through the production of enzymes that dictate growth substrate utilization.
According to Dawson et al. (1981) the number and size of marine Vibrio spp. increased and decreased dramatically, respectively, within 5 h of exposure to starvation and showed enhanced rates of adhesion to siliconized glass surfaces for survival. Future studies should apply sonication techniques to determine the quantity of Vibrio spp. on the surface and compare to
Vibrio spp. in the water sample prior to agitation. Shaking will ensures that bacteria are loosened from surface walls as Taylor & Collins (1949) reconciled the increase in bacteria concentration to surface growth after conducting experiments between bottles that were shaken before sampling and not.
16 chlorophyll-A concentrations, and zooplankton (grazer) counts to determine other variables that affect the concentration of bacteria in stored sample bottles.
Whether or not the relationship of concentrating a sample through filtration on the observed bacteria activity causes variability is also interesting. The filtration used to for abundance measurements in this study may pose a problem in that treatment of
vacuum-filtering could have injured delicate cells. It has also been shown that Vibrio spp. and E. coli that attach to aggregates in the water persist longer than those in aggregate free water and have a significant species-richness-area relationship (Lyons et al., 2010). Manipulating filter size may be of concern when aggregates are present or absent because of the possibility of altering cell count. To choose filter size, scientists must consider the natural conditions of the bacteria of interest to simulate nature as closely as possible.
There are a range of limitations to the study that was conducted. First, the study focused on culture-based quantification of Vibrio spp. and fecal indicator bacteria. Neither bacterial community structure nor population dynamics were studied in this experiment and would have been a valuable addition. For example, 16S rDNA sequence analyses would have been a useful addition to show the variation in species of eubacteria present in the water samples over time. Population dynamics could have been studied via either fluorescence in situ hybridization, or qPCR analyses to determine interactions of Vibrio spp., fecal indicator bacteria and other important bacterial players in the system in confined bottles. This could be done at very small time scales, for example, every 2 h for 20-24 h hours to observe small scale changes. Scrapping the sides of the bottle and collecting material that has settled to the bottom would allow us to understand the full array of particles attached and free living organism dynamics over time. Finally, ideally this experiment would be conducted over the course of a real extreme storm event such as a hurricane, incorporating bacterial abundance, BALO abundance, viral analyses, community and population dynamics and culture based analyses.
17 effects within 24 h of collection. In our collection regime, bottle effects experienced with samples that are stored for more than 24 h may be diminished by increasing sample size and decreasing surface area relative to volume. It is well known that surfaces provide substrate for many microorganisms and increase bacterial population, absorb substrates and metabolites or release contaminants. An important consideration is the development of gradients and ability
to agitate the sample to ensure homogenization (Christian & Capone, 2002). If keeping samples saturated with oxygen should become a priority, bottles should be kept partly filled and in contact with air with daily shaking (ZoBell & Anderson, 1936).
As demonstrated by our study, the effect of temperature in the ISCO autosampler during sampling period is also of note. It would be ideal to keep the ISCO bottles in a water bath that filters water from the estuary as the sampling period progresses even though this could pose problems if water temperatures change dramatically, for example during an extreme storm period.
Changes to normal growth activity are unavoidable during laboratory measurement of bacterial populations. Relating of results back to the natural environment should fully disclose of the consequences of extrapolation (O’Carroll, 1988). Incubations monitoring short-term changes may provide direct information on a single variable pertaining to the confined community. Albeit, confinement disrupts the steady-state and/or flux system (e.g. production and consumption) experienced in the natural environment. Even in situ experimentation restricts the natural exchange of substrates (Christian & Capone, 2002). Artifacts of enclosure are unavoidable, and it is crucial environmental microbiologists understand the characteristics of bottle effects so that extrapolation of microcosm data to natural ecosystem is accurate.
Note: The table below summarizes 11 bottle effect studies dated from 1936 to 2010 that
AUTHOR(S) & YEAR
TITLE WATER CONTAINER FACTORS EXPERIMENT RESULT(S) & CONCLUSION(S)
Fuhrman & Azam (1980) Bacterioplankton secondary production estimates for coastal waters of British Columbia, Antarctica, and California
Seawater Glassware,
baked 2 h at 400°C
15, 100 and 500 ml with 3, 10, and 5 3 cm long glass tubing added, respectively (for three different surface to volume ratios)
Samples taken periodically for 30 h for water cell biomass and surface cell biomass
▪ Cell counts from different surface to volume ratios within 5% of each other
▪ Substantial growth without large particles in water
▪ ATP on walls negligible within 15 h, increased 3-5% of total ATP by 22 h and was 8-14% of total by 30 h
Brozel & Cloete (1991)
Effect of storage time and temperature on the aerobic plate count and on the community structure of two water samples
Cooling-water and tap water
Sterile 10 ml glass tubes
4, 10, 20, 30°C for 24, 48, 72 and 216 h
Aerobic plate count and bacterial community structure of each sample determined
▪ No significant trend for culturable bacteria count or change in community structure
▪ No temperature where culturable bacteria count after 24 h equal to initial count
Ferguson et al. (1984)
Response of marine bacterioplankton to differential filtration and confinement
Seawater 4 L
autoclaved polypropylen e bottles
Unfiltered, 0.2-μm and 3.0-μm filtered water
Subsamples taken at 0, 16 to 18 h, and 30 to 34 h
▪ Culturable cells increased from 0.08% of total cell number (TCN) upon collection, 13% at 16 h and 41% at 32 h
▪ Shift in dominance from non-culturable to culturable bacteria
▪ Vibrio spp. only bacteria not observed initially ▪ Dissolved primary amines (DPA) increased then
decreased during confinement
▪ 41% of growth within 16 h attributable to bottle effect
▪ Bottle effect increased TCN 10% after incubation of approx. 15 h
▪ Confinement can affect estimate of TCN within as few as 5 h
Zobell & Anderson (1936)
Observations on the multiplication of bacteria in different volumes of stored sea water and the influence of oxygen tension and solid surfaces
Seawater Chemically
clean and sterilized Pyrex bottles or flasks
▪Bottles of differing volume ▪Differing volumes in varying
types of bottle
▪Partially filled bottles of differing volumes
▪Completely filled bottles of differing volumes
▪Bottles with different initial oxygen concentrations
▪Bottles with different volume to solid surface ratios
▪Bottles of same volume stored without shaking
Samples storage at 16°C and tested for bacteria
concentration and oxygen content; storage in number of days
▪ Densest bacterial populations appear in smallest volume (or highest surface area) in low nutrient concentrations therefore related to surface area of underwater glass surface
▪ Bacteria detach from walls if a few mg of organic matter present
▪ Little to no difference in bacteria population within the first two days at any volume ▪ Bacteria population abundance not related to
surface area of sample exposed to air
Heinemann & Dobbs (2006)
Microbiological 'bottle effects' not to be ignored (a comment on Mimura et al., 2005)
Seawater NA V. cholerae in water sample stored
at 4°C
Daily analysis for 1 week then 14 d after collection
▪ 5-fold decrease in mean CFU after 2 d ▪ 40-fold decrease in mean CFU after 7 d ▪ CFU remained low after 14 d
19 Petersen et al. (1997) Scaling aquatic primary productivity: experiments under nutrient- and light-limited conditions
Seawater Sun-Lite
glazed (fiber- glass-reinforced glazing material)
▪0.1, 1, 10 m3 samples of constant depth (1 m)
▪Same volume samples in constant shape (0.56 radius to depth ratio)
Nutrient concentration, primary productivity (PP) and respiration measured during spring, summer and fall
▪ Differences in PP at constant depth less extreme than at constant shape - wall area to unit volume ratio as artifact
▪ Rate of PP per volume and rate of PP per area increased as depth increased
▪ Radius effect on surface area to volume ratio - total ecosystem metabolism increased decrease in radius
Hammes et al. (2010)
Critical evaluation of the volumetric "bottle effect" on microbial batch growth Filter-sterilized river water and drinking treatment plant water Cleaned glassware
30°C incubation until stationary phase reached (approx. 3, 4, 5 days) at 20, 40, 250, 500 and 1000 ml
Net growth quantified by total cell counting, total ATP analysis, and conventional plating with less than 5 day assays
▪ No growth on walls - questions how surface growth dramatic enough to make a difference on results
▪ No correlation between bottle size and net growth
▪ Rule out volume-related bottle effects
Taylor & Collins (1949)
Development of bacteria in waters stored in glass containers Windermere lake water Bohemian glass, gutta percha, Pyrex glass and fused silica containers
▪ 1 L Pyrex, 32 oz. glass vs. 1 L gutta percha containers
▪ 1 L Winchester bottle vs. 1 L Pyrex flasks
▪ 1 L Pyrex flask with differing agitation schemes
▪ 150, 500 vs. 2000 ml Pyrex flasks ▪ Differing volume Pyrex flasks shaken
before sampling
▪ 25 vs. 1000 ml glass without shaking
▪ Plates incubated for bacteria counts for 3, 4 or 10 days at 20°C
▪ Oxygen content measure
for different volumes for different days
▪ Greater numbers of bacteria when sample shaken before sampling
▪ Quiescent conditions (most similar to natural conditions) show no significance increase in bacteria
▪ Water-soluble substances of glass type stimulate bacterial activity
▪ Observed growth of bacteria and demonstrable organic matter on walls
Butterfield (1933)
Observations on changes in numbers of bacteria in polluted water
River, creek and sewer waters
Glass 10, 20 and 37°C in the dark Bacterial density determined
at 0, 4, 8, 24, 48, 96 h, 6 d, 15 d and sometimes 41 d
▪ 37°C samples reached max bacterial density in 12 h, 20°C in 22 h and 10°C in 50 h
▪ All subsequently decreased bacterial density
Whipple (1901)
Changes that take place in the bacterial contents of waters during transportation
Tap water Glass Large vs. small bottles, non-agitated
vs. agitated
Time factors vs. number of bacteria and number of species
▪ Number of bacteria decreased 10-25% within 3-6 h subsequently increased by many hundred percent
▪ Increase much greater in small than large bottles though effect reduced with agitation
▪ 77 bacteria/ml initial gallon sample yielded 300 bac/ml in pint and 7020 in two ounces after 24 h ▪ Reduction in the number of species observed in
all samples
Marrase et al. (1992)
Seasonal and daily changes in bacterivory in a coastal plankton community
Sound water
Poly-carbonate containers
100, 200 and 500 ml and 1, 2 and 20 L at 19°C without stirring under darkness, light, and 12 h dark/light cycle
▪ Samples removed initially and every 6 h over 36 h ▪ Light regime samples
collected initially, after 12, 24, 36 and 48 h
▪ Bacterial grazing rates measured disappearance of fluorescently labeled bacteria
▪ Large variability in small bottles - larger samples more representative
▪ No effect of light on samples ▪ Higher rates of bacterivory at higher
References
Atlas, R.M., & Bartha, R. (1998). Quantitative ecology: numbers, biomass, and activities (Chapter 7). In: Microbial Ecology: Fundamentals and Applications. Benjamin/Cummings Science Publishing, Menlo Park, California, 218–280.
Brözel, V. S., & Cloete, T. E. (1991). Effect of storage time and temperature on the aerobic plate count and on the community structure of two water samples.
Burkholder, J., Eggleston, D., Glasgow, H., Brownie, C., Reed, R., Janowitz, G., ... & Springer, J. (2004). Comparative impacts of two major hurricane seasons on the Neuse River and western Pamlico Sound ecosystems.Proceedings of the National Academy of Sciences of the United States of America, 101(25), 9291-9296.
Butterfield, C. T. (1933). Observations on changes in numbers of bacteria in polluted water. Sewage Works Journal, 600-622.
Characklis, G. W., Dilts, M. J., Simmons III, O. D., Likirdopulos, C. A., Krometis, L. A. H., & Sobsey, M. D. (2005). Microbial partitioning to settleable particles in stormwater. Water Research, 39(9), 1773-1782.
Christian, R.R., Capone, D.G., 2002. Overview of Issues in Aquatic Microbial Ecology (Chapter 28). In: Hurst, C.J., Crawford, R.L., Knudsen, G.R., McInerney, M.J., Stetzenbach, L.D. (Eds.), Manual of Environmental Microbiology, second ed. ASM Press, Washington, DC, pp. 323-328.
Chung, H., Jaykus, L. A., & Sobsey, M. D. (1996). Detection of human enteric viruses in oysters by in vivo and in vitro amplification of nucleic acids. Applied and environmental microbiology, 62(10), 3772-3778.
Curriero, F. C., Patz, J. A., Rose, J. B., & Lele, S. (2001). The association between extreme precipitation and waterborne disease outbreaks in the United States, 1948–1994. Journal Information, 91(8).
Dawson, M. P., Humphrey, B. A., & Marshall, K. C. (1981). Adhesion: a tactic in the survival strategy of a marine vibrio during starvation. Current Microbiology, 6(4), 195-199.
Ferguson, R. L., Buckley, E. N., & Palumbo, A. V. (1984). Response of marine bacterioplankton to differential filtration and confinement. Applied and Environmental Microbiology, 47(1), 49-55.
Fries, J. S., Characklis, G. W., & Noble, R. T. (2006). Attachment of fecal indicator bacteria to particles in the Neuse River Estuary, NC. Journal of Environmental Engineering, 132(10), 1338-1345.
Fries, J. S., Characklis, G. W., & Noble, R. T. (2008). Sediment–water exchange of Vibrio spp. and fecal indicator bacteria: Implications for persistence and transport in the Neuse River Estuary, North Carolina, USA.Water Research, 42(4), 941-950.
Froelich, B., Bowen, J., Gonzalez, R., Snedeker, A., & Noble, R. (2013). Mechanistic and statistical models of total Vibrio abundance in the Neuse River Estuary. Water research, 47(15), 5783-5793.
21 Hammes, F., Vital, M., & Egli, T. (2010). Critical evaluation of the volumetric “bottle effect” on
microbial batch growth. Applied and environmental microbiology, 76(4), 1278-1281.
Harrigan, W. F., & McCance, M. E. (1979). Laboratory methods in food and dairy microbiology. Metodos de laboratorio en microbiologia de alimentos y productos lacteos.
Harvey, H. W. (1941). On changes taking place in sea water during storage. Journal of the Marine Biological Association of the United Kingdom, 25(02), 225-233.
Heinemann, S., & Dobbs, F. C. (2006). Microbiological ‘bottle effects’ are not to be ignored (a comment on). Marine pollution bulletin, 52(10), 1310.
Hsieh, J. L., Fries, J. S., & Noble, R. T. (2008). Dynamics and predictive modelling of Vibrio spp. in the Neuse River Estuary, North Carolina, USA.Environmental Microbiology, 10(1), 57-64. Hurley, M. A., & Roscoe, M. E. (1983). Automated statistical analysis of microbial enumeration
by dilution series. Journal of Applied Microbiology, 55(1), 159-164.
Krometis, L. A. H., Characklis, G. W., Simmons III, O. D., Dilts, M. J., Likirdopulos, C. A., & Sobsey, M. D. (2007). Intra-storm variability in microbial partitioning and microbial loading rates. Water Research, 41(2), 506-516.
Lyons, M. M., Ward, J. E., Gaff, H., Hicks, R. E., Drake, J. M., & Dobbs, F. C. (2010). Theory of island biogeography on a microscopic scale: organic aggregates as islands for aquatic pathogens. Aquatic Microbial Ecology, 60(1), 1.
Lawrence, J.R., Neu, T.R., Marshall, K.C., 2002. Colonization, Adhesion, Aggregation, and Biofilms (Chapter 42). In: Hurst, C.J., Crawford, R.L., Knudsen, G.R., McInerney, M.J., Stetzenbach, L.D. (Eds.), Manual of Environmental Microbiology, second ed. ASM Press, Washington, DC, pp. 466-468.
Madsen, E. L. (2011). Environmental microbiology: from genomes to biogeochemistry. John Wiley & Sons.
Marrase, C., Lin Lim, E., Caron, D.A. (1992) Seasonal and daily changes in bacterivory in a coastal plankton community. Marine Ecology Progress Series, 82, 281-289.
Meyer-Reil, L.-A., Bolter, M., Liebezeit, G., & Schramm, W. (1979). Short-Term Variations in Microbiological and Chemical Parameters. Marine Ecology Progress Series, 1, 1-6.
Munn, C.B., 2004. Methods in marine microbiology (Chapter 2). In: Marine Microbiology: Ecology and Applications. Garland Science/BIOS Scientific Publishers, New York, NY, pp. 19. O’Carroll, K., 1988. Assessment of Bacterial Activity (Chapter 13). In: Austin, B. (Ed.), Methods in
Aquatic Bacteriology. John Wiley & Sons Ltd, New York, NY, pp. 347-354.
Paerl, H. W., Valdes, L. M., Piehler, M. F., & Stow, C. A. (2006). Assessing the effects of nutrient management in an estuary experiencing climatic change: the Neuse River Estuary, North Carolina. Environmental Management, 37(3), 422-436.
Pernthaler, J., & Amann, R. (2005). Fate of heterotrophic microbes in pelagic habitats: focus on populations. Microbiology and molecular biology reviews, 69(3), 440-461.
Petersen, J. E., Chen, C. C., & Kemp, W. M. (1997). Scaling aquatic primary productivity: experiments under nutrient-and light-limited conditions. Ecology,78(8), 2326-2338.
Roszak, D. B., & Colwell, R. R. (1987). Survival strategies of bacteria in the natural environment. Microbiological reviews, 51(3), 365.
22 Strom, M. S., & Paranjpye, R. N. (2000). Epidemiology and pathogenesis of Vibrio vulnificus.
Microbes and infection, 2(2), 177-188.
Tantillo, G. M., Fontanarosa, M., Di Pinto, A., & Musti, M. (2004). Updated perspectives on emerging vibrios associated with human infections. Letters in applied microbiology, 39(2), 117-126.
Taylor, C. B., & Collins, V. G. (1949). Development of bacteria in waters stored in glass containers. Journal of general microbiology, 3(1), 32-42.
Toranzos, G. A., McFeters, G. A., Borrego, J. J., & Savill, M., 2002. Detection of microorganisms in environmental freshwaters and drinking waters (Chapter 18). In: Hurst, C.J., Crawford, R.L., Knudsen, G.R., McInerney, M.J., Stetzenbach, L.D. (Eds.), Manual of Environmental Microbiology, second ed. ASM Press, Washington, DC, pp. 249-264.
Wetz, M. S., & Paerl, H. W. (2008). Estuarine phytoplankton responses to hurricanes and tropical storms with different characteristics (trajectory, rainfall, winds). Estuaries and Coasts, 31(2), 419-429.
Williams, H. N. (1988). A study of the occurrence and distribution of bdellovibrios in estuarine sediment over an annual cycle. Microbial ecology,15(1), 9-20.
Williams, H. N., & Piñeiro, S. (2007). Ecology of the predatory Bdellovibrio and like organisms. In Predatory prokaryotes (pp. 213-248). Springer Berlin Heidelberg.
Yair, S., Yaacov, D., Susan, K., & Jurkevitch, E. (2003). Small eats big: ecology and diversity of Bdellovibrio and like organisms, and their dynamics in predator-prey interactions. Agronomie-Sciences des Productions Vegetales et de l'Environnement, 23(5-6), 433-440. Zobell, C. E., & Anderson, D. Q. (1936). Observations on the multiplication of bacteria in