#
ABSTRACTIn order to ensure virologically acceptable drinking
water, the US EPA promulgated the Surface Water Treatment
Rule and is preparing the groundwater disinfection rule (as
well as amendments to the SWTR) to define requirements for
disinfection to achieve specified degrees of virus
inactivation. While free chlorine disinfection has been
widely used since the early 20th century, the recent
evidence that THMs and other chlorine by-products are
carcinogens and cause other adverse health effects has
focused attention on alternate disinfectants, including
monochloramine and chlorine dioxide. Although previous
studies have examined both disinfectants at high doses on
inactivation of some important waterbome viruses, little
information is available at realistic concentrations used in
water treatment plants and at a range of pH levels.
computing the proportions of surviving viruses at
carefully-measured time intervals. Viruses were assayed by plague
technigues and both disinfectants were measured using the
DPD colorimetric method.
In order to compare inactivation data for the two
viruses and the different test conditions, times to achieve
a specified percent of virus inactivation as well as values
for disinfectant concentration (C) x time for specified
percent inactivation (T), or CT values were computed. In
In previous studies inactivation data were treated as
first-order in extrapolating to the times for 99.99% (4 log^^)
virus reduction. From examination of the experimental data
from our experiments, it was evident that HAV and MS2
inactivation kinetics did not conform to the first-order
model and were instead of the retardant die-off type.
Subseguently, five alternative mathematical models were
constmicted and used to predict the kinetics of HAV and MS2
inactivation based in the experimental data. These models
included: (a) a one-population model which assumes a
decreasing disinfectant concentration over time, (b) a one
hit, two-populations model assuming two subpopulations with
different rate constants of inactivation, (c) a third model
similar to (b) with the exception that the concentration of
the disinfectant decreases over time, (d) a multistate model
in which various stages of sublethal injury are assumed
fit was determined for each model using the least-squares
method and the results for 2, 3, and 4 log,Q inactivation
times were compared to the standard first-order regression
model.
The results indicate that a large discrepancy in the
predicted times is found both between the various models and
within the models when experiments of different sampling
time points are used. Consequently, these data suggest that
the assumption of first-order disinfection kinetics
Page
LIST OF FIGURES V LIST OF TABLES vi ACKNOWLEDGEMENTS vii I. INTRODUCTION 1
II. LITERATURE REVIEW 4
A. 2.0 Drinking Water and Pathogens 4
B. 2.0.1 Historical Perspective 4
C. 2.0.2 Outbreaks 4
D. 2.0.3 Enteric Viruses 5
E. 2.0.4 Hepatitis A Virus 6
F. 2.0.5 Bacteriophages: MS2 10
G. 2.0.6 Detection Methods 12H. 2.0.7 Drinking Water Regulations 13
I. 2.1.1 Treatment of Drinking Water 14
J. 2.1.2 Current Practice 15 K. 2.2 Disinfection 16
L. 2.3 Monochloramine:History 20
M. 2.4 Monochloramine:Chemistry 21
N. 2.5 Monochloramine:Mode of Inactivation 22
0. 2.6 Previous Studies Using Monochloramine 23
P. 2.7 History of Chlorine Dioxide 25
Q. 2.8 Chlorine Dioxide:Chemistry 27
R. 2.9 Chlorine Dioxide:Mode of Inactivation 28
VI
T. 2.11 Disinfection as a Kinetic Process 31
III. METHODS AND MATERIALS 3 9 IV. EXPERIMENTS 43 V. DATA ANALYSIS 4 5 VI. MODELING 45 VII. RESULTS 50 VIII. DISCUSSION 76 IX. CONCLUSION 82 X. REFERENCES 85 XI. APPENDIX I 92
XII. APPENDIX II 113
LIST OF FIGURES
PAGE
2.0 Cases of Hepatitis A Virus 9
2.1 Balancing Risks 18
2.2 Ratio of Monochloramine Formation 22 2.3 Disinfection Curves 35 1-6 Monochloramine Disinfection Curves 54-58
7-8 Chlorine Dioxide Disinfection Curves 69-70
VllX
LIST OP TABLES
PAGE 2.0 Characteristics of HAV 8
2.1 Characteristics of Bacteriophage MS2 11
2.2 Reductions of Pathogens in Water Treatment 16
2.3 Comparison of Disinfectants 19
2.4 CT Values of Various Microorganisms 34
1-8 Predicted Inactivation Times:Monochloramine 59-679-12 Predicted Inactivation Times:Chlorine Dioxide 71-74
ACKNOWLEDGEMENTS
How does one begin, to tell the story of how great a
lab has been? Foremost, my gratitude should be expressed for Dr. Mark Sobsey- who provided me with not only lots of extra experiments, but the enthusiasm to complete them! I would
also like to thank Dr. Crawford-Brown for all the hours spent with the mouse/modeling...and Dr. Ricardo DeLeon for helping me pack to avoid a "disaster" at customs in Peru! I
also want to express my appreciation for the members of the
lab, for all the times you saved my agar!
Bushki, thanks for your patience and flowers. Ann-mon amie-may you finish soon and join me south of the border! Ram...NI MYRA PUDINGI...thanks for everything.
Although the research described in this paper has been funded by the U.S. Environmental Protection Agency through
Assistance Agreement Number CR816673 to the University of North Carolina at Chapel Hill, it has not been subjected to agency review and therefore does not necessarily reflect the views of the agency and no official endorsement should be
In recent years, the responsibility of water
treatment plants to provide adequate removal or disinfection of pathogens has been complicated by the negative impact of
disinfection by-products. With the discovery that free
chlorine combines with natural organic matter to form trihalomethanes (THMs) and other by-products that are
implicated as carcinogens and toxicants, the Environmental
Protection Agency (EPA) and others responsible for drinking
water quality are considering more seriously the use of
alternative disinfectants. A drinking water disinfectant
must meet the Surface Water Treatment Rule's maximxam
contaminant level for THMs while effectively destroying
pathogens. Monochloramine has become a more attractive
disinfectant due to its low THM-forming potential as well as
stability in the distribution system. However, the efficacy
with which microbes are inactivated by monochloramine is
generally lower when compared to other agents such as free
chlorine, chlorine dioxide and ozone. Chlorine dioxide use
in the U.S. has been primarily limited to the control of
taste and odors. It is a strong oxidant and has not been
shown to produce THMs. However, other by-products are
2
1982) when administered to rodents via drinking waiter.
In 1980, the Safe Water Drinking Committed (1980) selected the CT concept (concentration of a disinfectant in
milligrams per liter multiplied by the time in minutes for a specified percent inactivation) to allow comparison of
various disinfectants. According to the Surface Water
Treatment Rule, it is assvimed that a 99.9% reduction in
Giardia cysts by monochloramine will result in a 9 9.99% reduction of. viruses, if chlorine is applied prior to ammonia. These reductions are based upon data assximing
first-order reaction kinetics. Previous extrapolation
studies have questioned the validity of the log-linear model (Young and Sharp, 1985; Haas and Karra, 1984). Deviations from a simple first-order relationship may be due to a
number of factors, including aggregation of microorganisms,,
variations of susceptibility within the microbial population, and changes in disinfectant species and
concentration (Chang, 1971; Hoff, 1986).
The purpose of this study was to further characterize the disinfection capabilities of preformed monochloramine
and chlorine dioxide using hepatitis A virus and the model coliphage MS2 in a demand-free system. The EPA has
identified the latter virus as a model organism in
developing CT values and conducting pilot plant studies. The
following experiments were performed: 1) One hour-long
disinfection 2) Three day-long experiments with
monochloramine to document the inactivation kinetics of
these organisms over longer time periods 3) and three day¬
long studies using monochloramine in which additional viruses or monochloramine were added to test alternative disinfection kinetic models, such as a state-vector model and a distributive rate constant model, both based on virus
2.0 DRINKING WATER AKD PATHOGENS
2.0.1 Historical Perspective Prior to the development of sanitary water systems, epidemics of cholera and other
waterborne infections claimed thousands of lives in urban
areas such as New Delhi, New York City and London (Melnick 1971, Keswick 1984). Typhoid fever, hepatitis, and
dysentery-were regularly transmitted by drinking water
contaminated with human waste. Today, strict measures in the U.S. ensure, at least theoretically, that human sewage does not contaminate drinking-water sources, and in most
developed countries many of these diseases have been
controlled or eliminated. Drinking water in most municipal water systems using surface sources is filtered and
chlorinated to eliminate contaminants. However, pathogens still find their way into the water supply. Water filtration and disinfection systems break- down or are poorly maintained
and operated. Faulty distribution systems and
cross-connections re-contaminate water delivered to the consumer.
Faulty septic tanks and sewer line breaks flood or otherwise
reach nearby wells.
2.0-2__Outbreaks Overall, approximately half of all
5
transmitted by groundwater that is inadeguately treated or
untreated, and nearly 25% are related to contaminated
surface water. The remainder are attributed to
post-treatment (distribution system) problems (Craun, 19 88).
Approximately half of all waterborne outbreaks are
designated as "acute gastrointestinal illness of unknown
etiology". It is suspected that much of this G.I. is due to enteric viruses. Furthermore, it has been estimated that
viral gastroenteritis produces 30 to 40 percent of the
documented cases of infectious diarrhea in the U.S., outnumbering the documented cases of both bacterial and
parasitic diarrhea (Dupont, H. L. and Pickering, LK, 1980).
Acute gastroenteritis is the second most common infectious
disease in the U.S. (to respiratory infections), with about 1-1.5 episodes per person per year. Much G.I. illness
occurrs as individual endemic cases and "household
epidemics", but other sources and settings of epidemic G.I. are well documented, including outbreaks in camps,
hospitals, day care facilities and nursing homes as well as
contaminated water or food.
2.0.3 Enteric Viruses Several characteristics of enteric viruses and that influence their risk of infection
through contaminated water include: 1) their general
infective dose, with as few as one infectious virus units
capable of initiating infection in a susceptible host.
Several studies have therefore been conducted to determine
whether drinking water provided by municipalities is :Cree of
viral contamination.
Coin was the first to isolate viruses from drinking
water in France, with the cause attributed to inadequate
treatment (settling and marginal chlorination). Currently,
Rose (1990) claims that " viruses can be recovered from
treated drinking water because approximately 53 percent of
the reported isolations came from water with complete
treatment, while 26 percent came from water which was only
disinfected and 15 percent came from untreated water."
According to one study by Payment et al. (1989), " Virus
were detected in seven percent of the finished water
samples... and the water met the current standards of water quality".
Of the many viruses which can be found in potential
drinking water sources, hepatitis A virus has been studied
recently and is used in disinfection experiments which serve
as the basis for U.S. EPA drinking water regulations.
2.0.4 Hepatitig A Virus The main characteristics of
Hepatitis A virus (HAV) are listed in Table 2.1. HAV was the
first viral disease to be conclusively shown to be
7
disease outbreaks of HAV continue to pose a public health
threat in both the U.S. and developing countries. According to Mosley (1967) and Goldfield (1976), more than 80
outbreaks of HAV traced to contaminated drinking water have -been documented between the years 1967-1972.
Hepatitis A is also transmitted by person to person
contact and ingestion of contaminated food, such as bivalve
molluscan shellfish. According to the Viral Hepatitis
Surveillance Program (VHSP), contact with a person infected with hepatitis A, association with a day care center, and international travel were factors strongly linked to
acquiring the disease (MMWR,Vol. 34, No. 135,1990) Overall,
the rates of infection by hepatitis A have remained fairly
constant in the years 1981-1990 (see Figure 2.0). The
reported number of cases for the year 1990 is 31,441 (MMWR,
Vol. 39, No. SS-1, 1990).
Hepatitis A was identified by radioimmunoassay as the causative agent of a waterborne outbreak involving 3 6 cases
of illness in Georgetown, Texas. The outbreak was traced to
pathogens in the drinking water from city wells (Hejkal, et
al.. 1982). Since then, more efficient methods of HAV
concentration and detection have been developed which have
associated hepatitis A with more outbreaks and cases of waterborne illness (Sobsey et al.. 1985; Bosch, et al..
1991). Due to the severity with which HAV manifests itself
treatment processes and the documented evidence that it
causes waterborne disease (Sobsey, 1988; Rao, 1988) , this
virus has been chosen by the U.S.EPA as the target virus for
which disinfection criteria are to be established.
Table 2.0 : Characteristics of Hepatitis A Virus
Feature Description
Family/Genus
Size/Genome
Incubation period
Route
Host range
Seasonality
Age group
virus in blood
and feces
Effective vaccine
Picornaviridae/Enterovirus 72 27-30 nm/ ssRNA
15-40 days
fecal-oral
humans and possibly other primates
higher in fall and winter
much higher incidence in children
2-3 wks prior to illness, 1-2 wks
after recovery currently being developed
—N in
<f-Ha
So
—
0-<D
Uq
-JZ
2o
^^
ͣ
m
1
^H
m
m
2.0.5 Bacteriophages; MS2
As mentioned previously, the difficulty in isolating
human enteric viruses from environmental samples, as well as the hazards involved in their use in pilot plant studies,
have led to the use of surrogate model of fecal
contamination indicators. A list of attributes for an ideal
indicator were described by Bonde (1966). They include:
1} presence when pathogen is present
2) presence only when the presence of pathogens is an
imminent danger (no proliferation to any greater extent in the environment)
3) occurrence in much greater numbers than pathogen
4) greater resistance to the envirozu&ent and disinfectants
than pathogens
5} grov readily on relatively simple media
6) yield characteristic and simple reactions eneOsling an
unambiguous i.d. of the group
7) random distribution in the test sample, or ability to obtain random distribution by simple homogenization 8) growth independent of other organisms present when
inoculated in artificial media
Bacteriophages are very similar to enteric viruses both
physically and in their relative resistance to chemical
disinfectants (see Table 2.1). The coliphage group are candidates as potential indicators of fecal pollution
because they infect Ej. coli (which are found in the gut of
warm-blooded mammals). They are found in high numbers in
sewage and polluted water sources, and are not known to
11
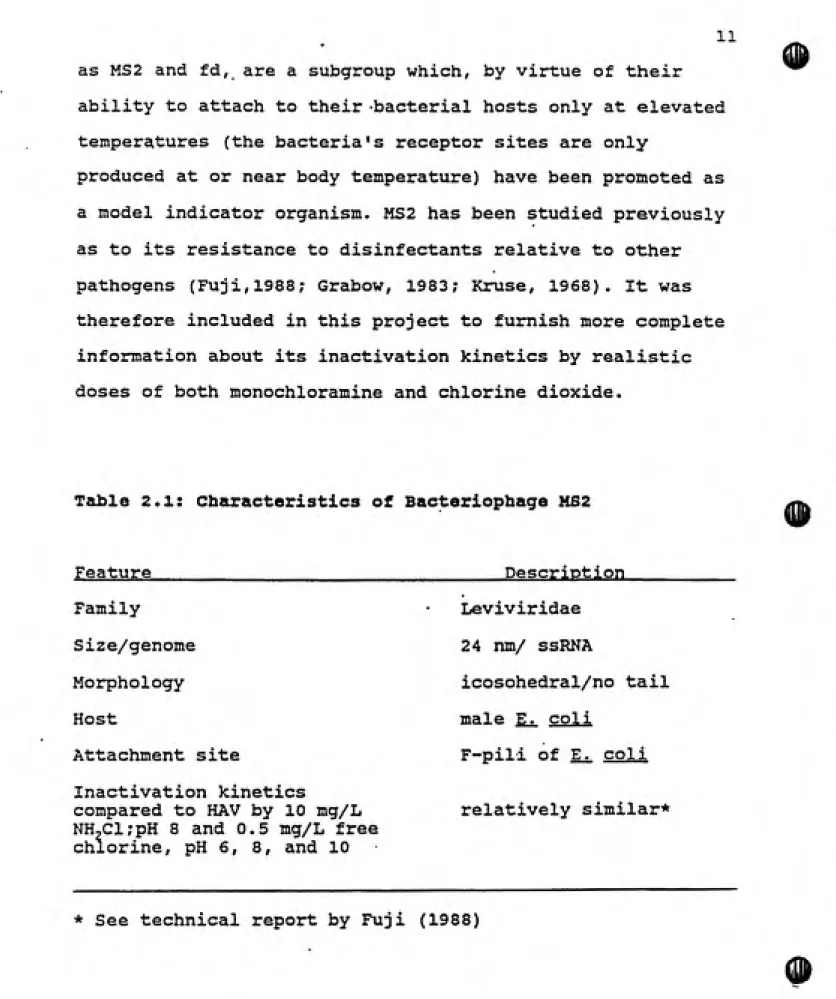
as MS2 and fd, are a subgroup which, by virtue of their ability to attach to their -bacterial hosts only at elevated temperatures (the bacteria's receptor sites are
only-produced at or near body temperature) have been promoted as
a model indicator organism. MS2 has been studied previously
as to its resistance to disinfectants relative to other pathogens (Fuji,1988; Grabow, 1983; Kruse, 1968). It was
therefore included in this project to furnish more complete
information about its inactivation kinetics by realistic doses of both monochloramine and chlorine dioxide.
Table 2.1: Characteristics of Bacteriophage MS2
Feature Description
Family
Size/genome
Morphology
Host
Attachment site
Inactivation kinetics
compared to HAV by 10 mg/L NH2Cl;pH 8 and 0.5 mg/L free chlorine, pH 6, 8, and 10
Leviviridae
24 nm/ ssRNA
icosohedral/no tail
male Ej. coli
F-pili of Ej. coli
relatively similar*
2.0.6 Detection Methods Frequently, common so-urce
outbreaks due to water and food vehicles are over before the
public health officials can collect and analyze samples in a timely fashion. Even more germane to the difficulties
involved in identifying the infectious agents that cause
epidemics are the paucity of methods for detecting viral pathogens in both clinical and environmental samples-.
In the case of environmental samples, where
concentrations of the causitive agent are likely to be relatively low, the media itself may contain interfering
parameters such as organic material, turbidity, and high
salinity (Safe Drinking Water Committee, 1977) that bias
testing. This is especially pertinent for assays designed to detect viruses. Current virological techniques involving cell culture and radioimmunofocus assays require expensive materials and are cumbersome, or are not possible with
several as yet non-culturable viruses such as the Norwalk
virus. Methods presently being developed include polymerase
chain reaction and gene probes. A caveat exists, being that " a disadvantage of utilizing a new method is the lack of rigorous testing and confirmation by other investigators
that conventional methods often have undergone" (DeLeon and Sobsey, 1991). If these novel methods can be validated,
13
2.0.7 Drinking Water Recmlations In order to regulate the
quality of drinking water, the U.S. EPA has embarked on the
establishment of a series of drinking water regulations that
will require states to assure disinfection of all ground
water sources and filtration and disinfection of all surface
water. The Surface Water Treatment Rule (SWTR) recpiiring
mandatory filtration and disinfection has already been
promulgated. Microbial contaminants to be regulated included
enteric viruses, Giardia lamblia. Legionella and
heterotrophic plate count bacteria (Federal Register, 1989).
The 1986 ammendments to the SDWA require all public water
suppliers, including those from both ground and surface
waters, to disinfect drinking water prior to distribution.
Specific objectives of disinfection include:
1) A 3 log and 4 log inactivation of Giardia lamblia cysts
and enteric viruses, respectively 2) assure control of other
harmful microorganisms 3) not impart toxicity to the
disinfected water 4) minimize the formation of undesirable
disinfection by-products and 5) meet the Maximum Contaminant
Levels (MCLs) for the disinfectants used and by-products
that may form. According to the goals defined by the
American Water Works Association (AWWA) Disinfection
Committee,"a functionally ideal water should contain no
pathogenic organisms and be free from biological forms that
may be harmful to human health or aesthetically
Despite these goals and regulations, the task of
regulating the more than 59,000 community water systems
(public or investor-owned water companies that serve 25 or
more year-round residents) and 140,000 noncommunity systems
(such as those found in institutions and parks) is
infeasible (Regli, personal communication). In 1985, 60
percent of all waterborne outbreaks occurred in noncommunity
water systems (Craun, 1986). Another 40 million people get
their drinking water from private wells and other individual
systems (Gerba et al., 1985).
2.1 Treatment of Drinking Water
2.1.1 Historical Background The lethal cholera epidemic of 1854 in London ironically provided an
opportunity for a milestone in public health to be
established. Dr. John Snow suggested water as being the
means of transmission of the disease, and as an experiment
removed the handle from the pump which delivered the
suspected water. He subsequently eliminated the outbreak,
and the link between contaminated water and illness was made
(Cohen and Snow, 1969). The rapid development of the
discipline of microbiology during the second portion of the
19th century clarified the role of bacteria and later
viruses as the agents responsible for many waterborne
diseases.
15
contaminants in polluted drinking water has been studied and methods of achieving this goal have been developed- One of the first attempts to counter an epidemic of typhoid fever
by disinfection was at the Austro-Hungary naval base of Pola
in 1896 by using bleaching powder. In the U.S. the first full-scale application of gaseous chlorine to a public water supply took place at Wilmington, DE, in 1913 (Houston,
1913) .
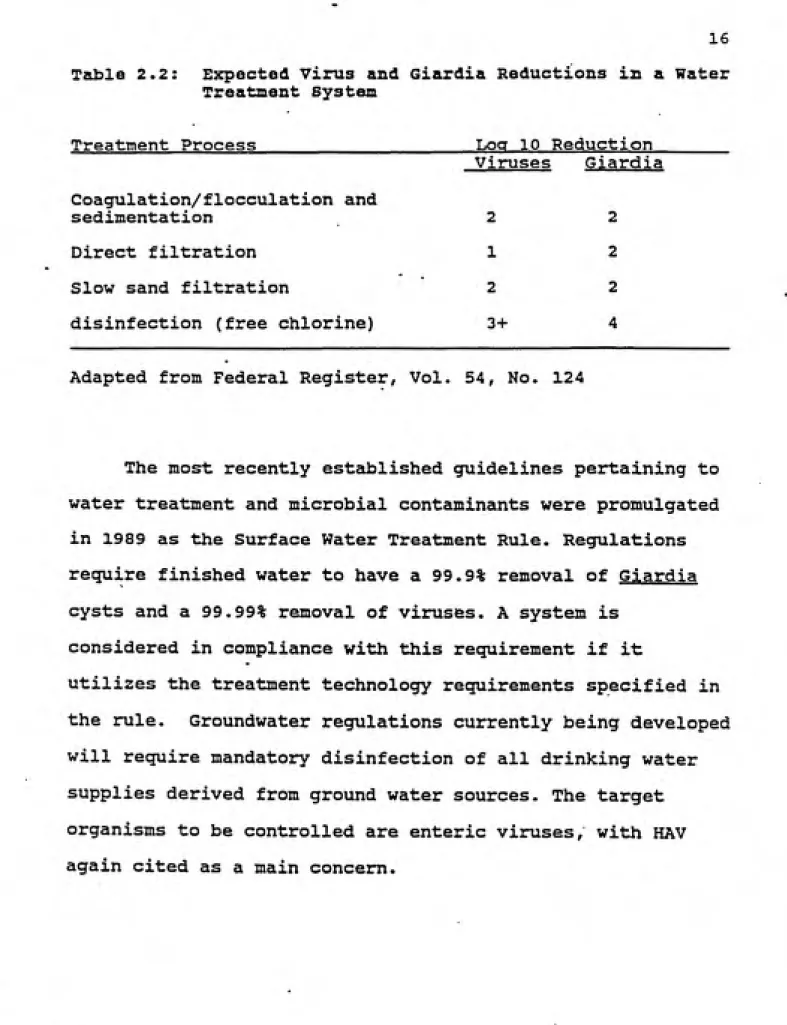
2.1.2 Current Practice Contemporary methods of water
treatment in the U.S. consist of 1)screening 2)
coagulation/flocculation 3) sedimentation 4) filtration and 5) disinfection. The multiple barrier concept...The
predicted efficiency of these processes with respect to
removal of viruses and Giardia is listed in Table 2.2. It is
clear that although processes prior to disinfection are
effective to a limited extent, it is this step which
Table 2.2: Expected Virus and Giardia Reductions in a Water Treatment System
Treatment Process Log 10 Reduction
Coagulation/flocculation and sedimentation
Direct filtration
Slow sand filtration
disinfection (free chlorine)
Viruses Giardia
2
1 2 3+
2
2 2 4
Adapted from Federal Register, Vol. 54, No. 124
The most recently established guidelines pertaining to
water treatment and microbial contaminants were promulgated
in 1989 as the Surface Water Treatment Rule. Regulations
require finished water to have a 99.9% removal of Giardia
cysts and a 99.99% removal of viruses. A system is
considered in compliance with this requirement if it
utilizes the treatment technology requirements specified in
the rule. Groundwater regulations currently being developed
will require mandatory disinfection of all drinking water
supplies derived from ground water sources. The target
organisms to be controlled are enteric viruses, with HAV
17
2.2 Disinfection
All of the standard methods of water treatment in the
U.S. involving physico-chemical methods (e.g.
coagulation-flocculation, filtration, adsorption) remove potentially
harmful microorganisms to some extent, thus reducing their
i numbers prior to the final or terminal disinfection stage.
I
However, it is this latter process which functions
specifically to destroy infectious agents in the water. Disinfecting agents can be classified into the
following general groups: (1) physical agents such as heat and ionizing and UV radiation (2) oxidizing agents (3)
cations of heavy metals '(4) quaternary ammonium and pyridine
compounds and (5) others. Ideally, a disinfectant used in
water treatment should eradicate the causative microbes of
i waterborne infectious diseases at concentrations which are
I
I
. harmless to the public, while not producing any offensive
I,
t odors or tastes. Additionally, the disinfectant should be J economical and provide residual protection in the
I distribution system. Realistically, no one disinfectant has
I all of these qualities. In the past, the method of choice
: was chlorination. However, studies by Rook (1974) and Seller (1974) suggested possible health risks associated with the
:, formation of haloforms during chlorination. Haloforms are
produced by the reaction of free chlorine with naturally
investigations were conducted by the EPA which identified
trihalomethanes as a major organic constituent produced in
drinking water during chlorination. A significant
association was confirmed between bladder cancer and the levels of haloforms in drinking water by Cantor (1977) using
information gathered by the National Organics Reconnaissance
Survey (NOMS).
Although further research is necessary in the field of
disinfection by-products, one result of the preceding
studies was the set of regulations created by the 1979 treatment rules aimed at reducing the levels of
trihalomethanes to 100 ug/1 in finished waters (Federal
Register 44, No. 231).
Consequentially, a search for alternatives to chlorine
are being explored. The risk trade-offs must be balanced
between the original goal of disinfection in reducing the
chances of waterborne illness and the long-tenn cancer risks
of disinfection by-products (see figure 2.1).
FIGURE 2.1
risk
RISK TRADE-OFFS
SOURCE WATER & TECHNOLOGY AFFECT SLOPE
Ds/DBPs-REGULATORY RANGE
microbial
19
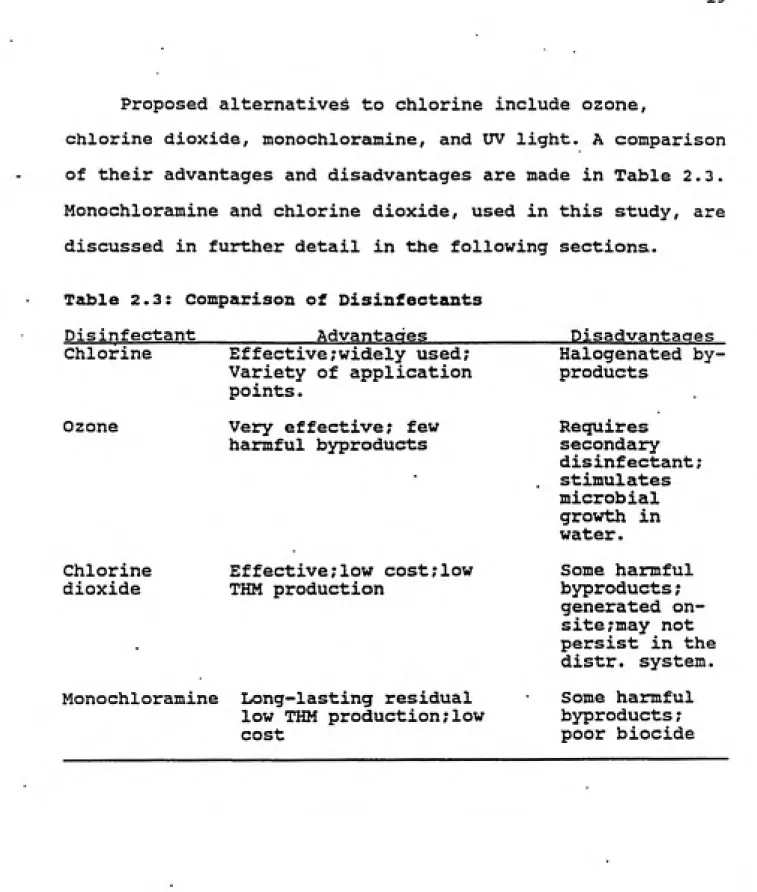
Proposed alternatives to chlorine include ozone,
chlorine dioxide, monochloramine, and UV light. A comparison
of their advantages and disadvantages are made in Table 2.3.
Monochloramine and chlorine dioxide, used in this study, are
discussed in further detail in the following sections.
Table 2.3: Comparison of Disinfectants
Disinfectant__________Advantages_____ Disadvantages
Chlorine
Ozone
Chlorine
dioxide
Effective;widely used;
Variety of application points.
Very effective; few
harmful byproducts
Effective;low cost;low
THM production
Monochloramine Long-lasting residual
low THM production;low cost
Halogenated by¬ products
Requires secondary
disinfectant;
stimulates
microbial
growth in
water.
Some harmful
byproducts; generated on-site;may not
persist in the
distr. system.
Some harmful
byproducts;
2.3 Monochl"T->iTni ne History
Chloramines were first applied to water treatment in
Ottawa, Canada in 1917 by Race who was seeking an
alternative to sodium hypochlorite (Race, 1918). Since that
time, monochloramine usage in the U.S. became popular in the
193 0s as a technique to control taste and odor problems and
regrowth of bacteria in distribution systems (Ruth,1931;
Skinner, 1932). However, the understanding of breakpoint
chlorination (Griffin and Chamberlain, 1941) and the
shortage of ammonia during WWII led to a decrease in the use
of chloramines in general.
A resurgence of interest in monochloramine was driven
by the discovery that chlorination produced by-products
harmful to human health. Monochloramine is not as strong an
oxidizer as chlorine and is less reactive in water. Recent
toxological studies by Moore (1982) have suggested that
monochloramine is not absorbed into the blood stream and
that the liver and kidneys are able to detoxify and excrete
any harmful products. Nevertheless, other studies have
shown that kidney dialysis patients were at risk of
complications due to the inability of facilities to remove
chloramines from the water used to make their dialysate
solutions (Krasner et al., 1986). As of now, no reference
dose has been devised based on either noncancer health,21
2.4 Monochloramine chemistry
Monochloramine can be produced in three ways: (1)
adding chlorine to water containing ammonia (as is often the
situation in wastewater treatment) (2) adding ammonia to
water containing chlorine, and (3) mixing the two compounds
together prior to application. When water, chlorine and
ammonia are combined, the following reactions are observed:
NH3 + HOCl = H^O •(> NH^Cl (monochloramine)
NH^Cl + HOCl = H^O + NHCI2 (dichloramine)
NHClj + HOCl = HjO + NCI3 (nitrogen trichloride)
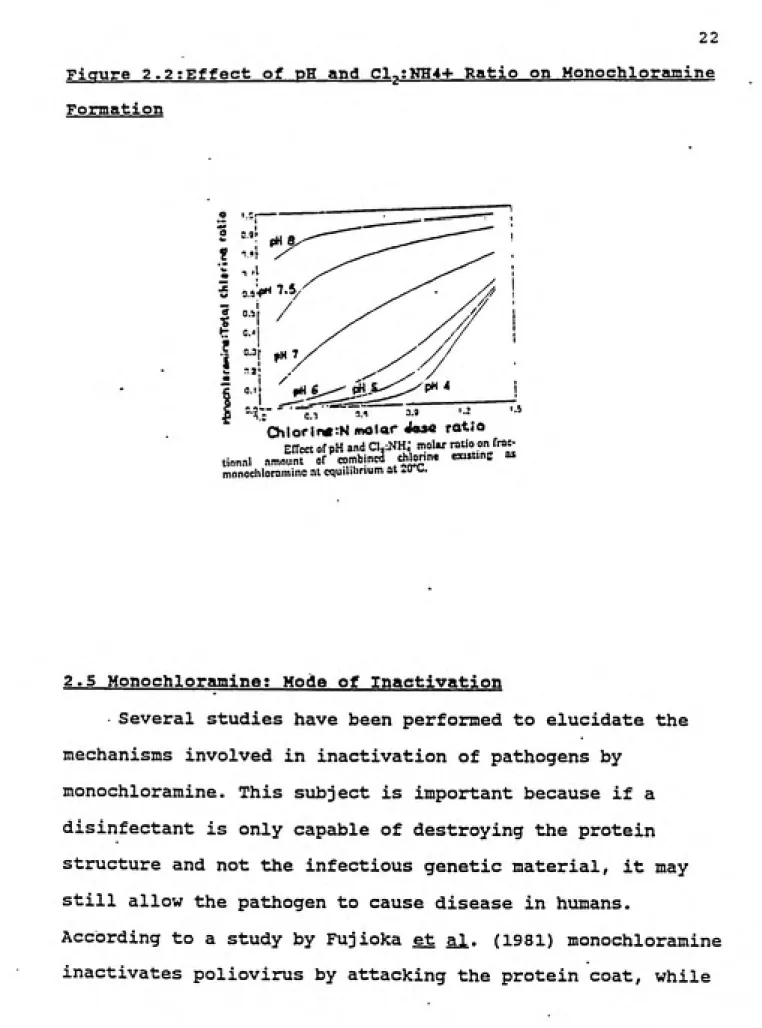
The species of chloramines produced depends upon several
factors, with the ratio of ammonia to chlorine and the pH
values having a strong influence on the resulting dominant
species (see Figure 2.2). The product at a pH of 8 and
higher is predominantly monochloramine when a > 3:1 ratio of
ammonia:chlorine is used. In the pH range of 5-8, a mixture
of mono- and dichloramines are produced. Dichloramine is
formed readily between pH 4-5, and is catalyzed by the
presence of H3O*. Excess ammonia will retard the reaction
Figure 2.2;Effect of pH and Cl..;NH4+ Ratio on Monoehloramine
Formation
rotio
Chlorin«:N moiar
EITcct of pH and C1,:NH; molar ratio on frac¬ tional nmount of combined chlonne existing as
monoehloramine at cquiUlirium at ZU \..
2.5 MonotshirtrMininet Mode of Inactivation
Several studies have been performed to elucidate the
mechanisms involved in inactivation of pathogens by
monoehloramine. This subject is important because if a
disinfectant is only capable of destroying the protein
structure and not the infectious genetic material, it may still allow the pathogen to cause disease in humans.
According to a study by Fujioka et al. (1981) monoehloramine
ͣ
ͣ 23 the extracted RNA was shown to still be viable. More
detailed research using the bacteria Ej. coli has indicated
that "monochloramine reacts with the whole nucleic acid and with free purine and pyrimidine bases rather than with
nucleotides or nucleosides...and reacts more readily with
amino acids than with nucleic acids." (Jacangelo and Olivieri, 1986). In light of these somewhat conflicting results, caution should be exercised when considering the
use of monochloramine. Further work should examine whether
microorganisms exposed to monochloramine are indeed still
infectious in humans and other hosts.
-2.6 Previous virus Disinfection Studies Using Monochlo-rwiniT^A
Several experiments have been conducted which used
combined chlorine, but did not distinguish the exact
proportions of mono- di- or trichloramines in the reaction.
For example, Kelley and Sanderson (1960) examined the
inactivation kinetics of coxsackie and polio viruses using chloramine concentrations of 1 mg/L. At pH 10, where
monochloramine can be assumed' to be the dominant species, 3
log^Q inactivation was not reached for both viruses after
more than five hours.
Additional work by Shah and McCamish (1972) using
coliphages Tj and fj and poliovirus I also indicates the
high resistance of pathogens to monochloramine. A 99%
phage was markedly more resistant, requiring over 190
minutes. Unfortunately, although the concentration of
combined chlorine was reported as 4 mg/L, neither the pH used nor the speciation of chloramines was reported.
The inactivation kinetics of f^ coliphage upon exposure
to monochloramine was further studied by Michael Snead
(1974)- Using a demand-free system and a range of
disinfectant concentrations, he demonstrated that the rate
of inactivation was dependent on monochloramine
concentrations only if they exceeded 4 mg/L. The bacteriophage also followed a biphasic pattern of
inactivation, with scarcely more than a 99% reduction in
titer after 3 hours.
In a recent review article (Sobsey,1989) it was
summarized that "studies on indicator bacteria such as E.
coli, coliforms and HPC bacteria and pathogens such as
Salmonella and Shigella show that chloramine residuals of
1-2 mg/L and contact times of up to hours are needed to
produce appreciable inactivation. Furthermore, compared to
these bacteria, some other health-related bacteria such as
mycobacteria as well as viruses (e.g. HAV and rotaviruses) and Giardia cysts are extremely resistant to chloramines."
Cell-associated and dispersed HAV were studied under demand-free conditions using monochloramine concentrations of 10 mg/L (Sobsey et al., 1988). While the cell-associated
25
forms of HAV indicated a strong resistance to
monochloramine, with CT values for 4 log,Q (99.99%)
inactivation estimated at 1,740 and 1225 mg-min/L.
While a considerable amount of research has been
performed regarding monochloramine inactivation of viruses,
a significant lack of quantitative information is available
concerning the doses and times necessary to achieve specific
levels of inactivation of some important pathogens,
including HAV at realistic doses and over a range of typical
pH levels in drinking water. This is especially pertinent to
the Safe Water Drinking Water Act, the SWTR and its future
amendments and the forthcoming groundwater disinfection
rule. The disinfection requirements of these rules will have
profound effects on drinking water treatment practices in
the U.S.
2.7 History of chlorine dioxide
Chlorine dioxide was initially produced by Davy from
the reaction of potassium chlorate and hydrochloric acid in
1811 (Miller, et al., 1978). It has been used extensively as
an industrial bleaching agent (White, 1972) but only
for surface water (Water Information Database, 1991). Recent
interest in chlorine dioxide is largely a result of the
upcoming Federal regulations on disinfection by-products,
and the current concern over THMs.
Similarly to monochloramine, chlorine dioxide has also
been stringently tested for potential toxicity or
carcinogenicity for humans. The principal concern with the
use of chlorine dioxide is the potential toxicity of the
chlorite and chlorate ions produced. White (1972)
substantiated the general acceptance of the production of
chlorite being the end-product of ClOj reactions in water.
Hefferman et al. claim that chlorite " carries the oxidation
of hemoglobin to methoglobin in vivo" and recommend the
concentration of chlorite to be zero due to the adverse
effect upon nursing babies when the oxidation reaction takes
place. (Hefferman, 1979). In 1987, the Subcommittee on
Disinfectants and Disinfectant By-products concluded that
thyroid and neurological disorders observed in laboratory
animals could be due to the oxidation of dietary iodine by
chlorate in the intestinal tract (Lykins et al., 1990). In
contrast, in a prospective epidemiological study, Michael et
al. (1981) compared 197 people exposed to water treated with
chlorine dioxide (avg. cone, of 0.7, 5.1 and 0.7 mg/L of
ClOj, chlorite and chlorite, respectively) to 112 unexposed
subjects and found no increased risk of adverse health
ͣ
. 2 7
conflicting reports, the USEPA currently recommends a
maximum combined concentration of chlorine dioxide and its
by-products of no more than 0.5 mg/L. Analyses are now in
progress to better define the health effects criteria for
chlorine dioxide and its by-products in drinking water.
2.8 Chlorine dioacide chemistry
At room temperature, chlorine dioxide exists as a
yellow-greenish gas. It has an irritating odor above
concentrations of 45 ppm, and due to its instability must be
generated on-site (White, 1972). One of its most significant
properties is its solubility in water, which is five times
that of chlorine. The soliibility of chlorine dioxide is 2.9
g/L at room temperature (Gordon, 1972).
The most routine method of generating chlorine dioxide
by the water industry is to react a strong chlorine solution
having a minimum concentration of 500 mg/L with a
concentrated stream of sodium chlorite (minimum
concentration of 300 mg/L). Other researchers have found
that using an excess of chlorine both prevents the
potentially toxic salt from getting into the water supply
and creates the optimal conditions for rapid conversion and
nearly 100% yield of the chlorine dioxide. The reaction is
as follows :The formation of the undesirable by-products, chlorite and chlorate, occur mainly at pH values greater than 11 and even then is a slow kinetic process (Masschelein, 1979). However, even at neutral pH chlorine dioxide has been shown to
disproportionate upon reacting with organics in the water
with the main by-product being the chlorate ion (Rav-Acha,
et al., 1983):
2 ClOj + 20H' = CIO3* (Chlorate) + CIO2' (chlorite) + HjO
Several methods have been developed to reduce these unwanted by-products including: (1) passage through a granular
activated carbon (GAC) column (2) reduction by sulfur dioxide, and (3) reduction by ferrous chloride. Though no process is 100% successful, progress has been made in
significantly reducing the levels of chlorate and chlorite in drinking water.
2.9 Chlorine dioxide; Mode of Inactivation
Several studies have been performed with both bacteria
and viruses to determine the mechanism of attack of chlorine
dioxide. Roller (1980) stated that "ClOj does not appear to
inactivate bacteria by altering the DNA and oxidizes the
thiol group to the sulfoxide or sulphone stage, which is
29
poliovirus 1 in their study and found that ClOj inactivates
the virus by reacting with the viral RNA and impairing the
ability of the viral genome to act as a template for RNA
synthesis. They also examined the hypothesis that the
disassociation products of chlorine dioxide were responsible
for the observed inactivation, especially at higher pH.
However, the measured amount of chlorate and chlorite
present was less than 5% of the total chlorine dioxide species and therefore could not account for the virucidal
action. They concluded the increased inactivation at
elevated pH was due to the elevated sensitivity of viruses under alkaline conditions.
Since chlorine dioxide appears to act upon the viral
RNA and irreversibly damages bacteria, it may be capable of
completely destroying these pathogens. Further research with
other microorganisms needs to be conducted to determine if
this assumption is justified. If it holds true, chlorine
i
I dioxide could be used with confidence, at least with respect
I
] to its biocidal ability.
2.10 Previous disinfection studies using chlorine dioxide
Several investigations.have reported that chlorine
dioxide disinfection capabilities are enhanced at higher pH
values using E^ coli. bacteriophages, and enteroviruses
(Brett and Ridgeway, 1981; Noss and Olivieri, 1985; Scarpino
rapid inactivation of rotavirus was observed at pH 8. A
99.9% reduction in virus titer was achieved after 10 seconds
versus >600 seconds at pH 6 and 8 respectively, with a ClO^ residual of 0.05 mg/L. In the same study, under identical
conditions it was concluded that under acid or"neutral pH,
ClOj was inferior to ozone and chlorine while above pH 7
ozone was still the most effective virucide, followed by
ClOj and lastly chlorine. Unpublished data by Sobsey and
Battigelli again suggest enhanced inactivation of HAV and
coliphage MS2 at pH 9 versus pH 6 in a buffered demand-free system. Similar results were reported by Bedulvich et al.
(1953), in which ClOj possessed a higher bacteriocidal
efficiency than chlorine against Zj. coli. Salmonella typhi,
and Salmonella paratyphi.
Giardia has also been targeted by the Surface Water
Treatment Rule, in which a 99.9% removal is required by
drinking water utilities. The effect of pH on ClOj
inactivation of Giardia muris is analogous to that of other pathogens, with the protozoan being slightly more resistant to ClOj than viruses or bacteria.
No information at incremental pH values between 6-10
and otherwise constant conditions are available concerning
inactivation kinetics of viruses by ClOj. Such data would be
useful in establishing regulations for disinfection of
drinking water supplies derived from ground or surface
31
2.11 Disinfection as a Icinetic process
The first documented study of the process of
disinfection was realized by Kronig and Paul (1897) . Samples
of surviving microorganisms taken at precise intervals
during the disinfection experiment were quantified .
Analysis of their data indicated that the disinfection
process occurred in an orderly manner and that the rate of
inactivation decreased as the number of survivorsdiminished. A decade later, Madsen and Nyman and Harriet
Chick independently concluded that during the process of
chemical disinfection of anthrax spores (using phenol and
mercuric chloride), the surviving fraction over time
followed a logarithmic pattern. In essence, the number of
spores destroyed per unit time was proportional to the
number present in a unit volvime of the medium at that
moment. These early observations became the foundation for
the•exponential law describing the action of disinfectants
over time in their ability to destroy various
microorganisms.
Chick's Law (Chick, 1908), widely accepted due to its
simplicity and convenience, considers the rate of
inactivation of microorganisms to follow a first-order
relationship dependent on the number of organisms present at
N/No = e'"*
where N = number of organisas at time t
No = nximber of organisms at time o k = proportionality constant
t = time
Ideally, the plot of the log of N/No against time should
produce a straight line. Although this is often the case
with chemicals, this is seldom the result with microbial
suspensions. Several proposed reasons for this deviation
from first-order kinetics include: (1) resistant subspecies
(2) aggregated organisms (3) the presence of several
inactivation sites or "targets" on the organism (4) changes
in the properties of the disinfectant, and (5) interfering
agents in the suspension media, such as particulates.
With the development by Salk of the
formaldehyde-inactivated polio vaccine (Salk, 1954), extrapolation from
experimental data became necessary in determining
inactivation kinetics below the level of detection. Accuracy
became an issue which had direct ramifications on human
health. Since then, the use of kinetic models to describe
and compare disinfectants used in water treatment has
functioned as the basis for current regulations.
The currently accepted method of analyzing disinfection
33
based on the empirical relationship Ic = C" t known as
Watson's Law, where :
k = rate constant of inactivation C = concentration of disinfectant
t = time
n = coefficient of dilution
Baumann and Ludwig (1962) proposed the use of this
relationship in predicting the time and concentration of
disinfectant necessary to achieve a certain reduction in
microorganisms, given a specific pH and temperature. This
ideawas disregarded until 1980 when the Safe Drinking Water
Committee selected CT values as the method for comparing
biocidal efficiency. As mentioned earlier, deviations from
first-order kinetics limit the definitude of this method.
Table 2.3 lists the CT values for several microorganisms
when the disinfectants monochloramine and chlorine dioxide
Table 2.3: CT Values of Various Microorganisms
Organism Disinfectant Temp. PH
CT value*
(°C) (mg*min/L)
E. coli CIO2 5
6.5 0.60
E. coli ClOj 20
6.5 0.29
poliovirus I ClOj 5 7.0
3.60
poliovirus I
ClOj 257.0 0.90
simian rotavirus ClOj 5 6.0
0.22
simian rotavirus C102 5 10.0
0.18
giardia muris C102 5 7.0
11.2
giardia muris
C102 25 7.05.30
E. coli NHjCl 5
7.0 22.0
E. coli" NHjCl 25 9.0
37.0
poliovirus I NHjCl 5 9.0
1420
poliovirus I NHjCl 25 9.0
216
simian rotavirus NHjCl 5 8.0
4034
giardia muris NHjCl 3 7.0
496
giardia muris
NHjCl m7.0 848
*CT value for 99% inactivation
Adapted from Hoff, 1986.
The USEPA has stated that "the CT values for CIO2, O3, and
NH2CI are based on limited data compared to the more
extensive data that provide the basis for the Clj CT values,
and that, for these disinfectants, new data are more likely
to become available in the near future that may support
different CT values or other means of determining what
percent inactivation of Giardia cysts and viruses a
disinfectant achieves."
A variety of different curves generated from
01 o
at
o
0 Time
Exponential Kinetics
0 Time
Concave Upward Kinetics
(Initial "Shoulder" Curve)
O o
Time
Concave Downward Kinetics
("Initial Rapid Rate" Curve)
Time
Multiple Kinetics
(•Tailing Off" Curve)
Figure Typical survival curves for disinfection experiments.
After; Prokop and Humphrey (1970)
Several attempts have been made to construct mathematical
models which better comply with the disinfection curves
displayed previously. The "shoulder curve" has been hypothesized by numerous studies as being the result of aggregation (Floyd and Sharp, 1977; Chen et al., 1985; Hoff
and Akin, 1986; Hom, 1972.)
The multi-hit theory, in which a single target must be
hit "n" number of times before it is destroyed, was also proposed as being a model for shoulder curves. Atwood and Norman (1949) developed the following mathematical
relationship:
N/N^ = 1- (i-e**)" where: N/H^ = surviving
fraction
n = « hits to kill
a = sensitivity vol\ime
D = dose
Mechanistic effects have also been proposed as being
responsible for the deviations from first-order, log-linear
kinetics in disinfection experiments. For example, an infectious particle could develop a resistance to the
inactivating process as the reaction proceeds. Taking data
from experiments in which poliovirus 1 was exposed to
formaldehyde. Card (1957) developed the following formula:
log N/N„ = -a log (1-bt) where N/N^ = surviving
fractiona = sensitivity
b = potency of disinf.
37
Heterogeneity of organisms, where a distribution of
susceptibility to a disinfectant is inherent to the
population, has also been the subject of several modeling
approaches. Hiatt (1964) claimed that a suspension of
vimses may become increasingly heterogeneous as the
disinfection process continues, and constructed the
following model:
(kl k2)t . «^-k2t
N/N, = (1- p)e-^''*"^" + Pe'"^" Where:
N/N^ = surviving fraction
P = probability of infection
k^ = inactivation constant 1
Ic, s inactivation constant 2
t = tine
Haas (1984) adopted a kinetic model which accounted for
changes in disinfectant species in a given system; For
example, the dissociation of monochloramine to hypochlorous
acid:
C^ = C^[x exp(-lc,t) + (i-x)exp(-lC2t)-exp(-lC3t) where:
C^ = combined chlorine Cg = chlorine dose
X = fraction of combined
chlorine decaying by rapid pathway
k^ = fast rate constant of decay
Ic^ = slow rate constant of
decay
constant of conversion of free to combined
chlorine
So far, no attempt at modeling the kinetics of
disinfection data has encompassed the wide range of not only
disinfectants, but also the microorganism's resistance under
different environmental conditions. Nevertheless, the
pursuit of more reliable models has produced information which can be used in devising regulations aimed at
METHODS AND MATERIALS
Preparation of Glassware and Haloaen-Demand-Free Water and
Buffers
Experimental water was prepared by passing
twice-deionized, activated carbon-filtered water through a
macroreticular scavenging resin bed to produce water of the quality describedin Standard Methods (A.P.H.A., 1989). Glassware was rendered demand-free by soaking in a tank containing 25-50 mg/L chlorine solution for a minimum of 6 hours. The glassware was rinsed in halogen-demand-free (HDF) water four times, wrapped in aluminum foil and baked at 200 degrees Celsius for 6 hours. All buffers for the experiments
were made demand-free according to the protocol in Standard Methods (A.P.H.A., 1989).
Monochloramine Reagents and MonochlQT-ami w«» Analysis
Stock solutions of monochloramine were prepared the day of the experiment to produce an approximate concentration of
100 mg/L by modification of the method established by Herman
and Hoff (1984). Household bleach (5.25 % sodium
hypochlorite) was diluted in HDF 0.01 M phosphate buffer, pH
9.5, to a concentration of 200 mg/L free chlorine.
4 0
each of these solutions were combined in HDF glassware and
mixed thoroughly to ensure formation of monochloramine.
These stock solutions were diluted in phosphate-buffered,
HDF water at the desired pH to a final concentration of 2.0
mg/L.
Concentrations of monochloramine in stock solutions
and samples taken during the course of the experiments were
measured by the N,N,Diethyl-P-Phenylenediamine (DPD)
colorimetric method as described in Standard Methods (A.P.H.A, 1989).
Chlorine Dioxide Reagents and Chlorine Dioxide Analysis
Chlorine dioxide was generated according to the
technique described in Standard Methods (A.P.H.A., 1989)
with slight modifications as described in the technical
report of Karen Werdehoff (Werdehoff, 1986), and shown
diagramatically in Appendix IV, Figure l. A solution
consisting of 750 mis HDF water supplemented with 10 g
sodium chlorite was placed in the reaction vessel. The
proceeding tower contained sodium chlorite flakes moistened
with 4-5 mis HDF water. Glass wool was placed on top to
prevent any flakes from being carried out of the tower. The
chlorine dioxide collection bottle consisted of 1500 mis HDF
water. This bottle was wrapped in aluminum foil and the
entire system was connected with teflon tubing.
a gas scrubber consisting of a 5% KI solution. The following
sequence was performed at five-minute intervals for twenty
minutes: 1) 5 mis 1.8 N HjSO^ were added to the generating
bottle 2) The gas flow was augmented to the point that mild
bubbling was observed in the collection bottle 3) After five
minutes the gas flow was interrupted and the system
disconnected at point W 4) 5 mis of acid were again added
and the system reconnected, 5) After twenty minutes 5 mis of
acid were again added and the gas flow allowed to continue
for an additional 30 minutes.
The resulting stock solution ranged in concentration
from 500-800 mg/L ClOj. Yields were analyzed using the DPD
method as described in Standard Methods (A.P.H.A., 1989).
A standard curve was developed the same day using the
DPD colorimetric method described in Standard Methods
(A.P.H.A., 1989). Experiments were performed within 48
hours. Stock solutions of CIO2 were diluted in
phosphate-buffered HDF water to a target concentration of 0.5 mg/L.
Disinfectant residuals were measured as described for the standard curve.
Preparation of Monodispersed Hepatitis A Viruses
HAV, a cytopathic strain HM175, was grown and
assayed enumeratively by the plaque technique in confluent
42
previously described (Cromeans et al., 1987; Sobsey et al.,
1991).
Viruses were propagated, purified and concentrated
by the method described previously (Sobsey et al., 1991).
Confluent layers of host cells were infected" at
multiplicities of 0.01-0.1 infectious units/cell. After an
incubation period of one week, HAV was harvested from the
infected cells by freezing and thawing and then centrifuging
at 3,000 X g for 20 minutes. Viruses in the resulting
supernatant were precipitated with 12% polyethylene glycol
(PEG) and extracted to separate free viruses from cell
debris using chloroform. HAV in resuspended PEG precipitates
and cell extracts was pelleted at 105,000 x g for 3 hours at
5 degrees Celsius. The pellets were pooled and resuspended
in HDF phosphate buffer. Cesium chloride was added to
achieve a density of 1.33 g/ml, and then ultracentrifuged to
equilibrium for three days at 90,000 x g and 5" C in a
self-generated gradient. Fractions of the gradient were assayed
to determine the location of the virus peak and those
portions were desalted using centrifugal ultrafilters
(100,000 molecular weight cut-off). The desalted fractions
were then layered onto 10 to 30 % sucrose gradients in
virions were collected and stored at 4 degrees Celsius for
use in experiments.
Preparation of Monodispersed MS2 Bacteriophages
Coliphage MS2 (ATCC 15597-Bl) was grown and assayed
by the top agar plaque method (Adams, 1959) in E_^ coli C3000 (ATCC 15597). The top agar of plaque assay plates having
confluent lysis was scraped into 3-5 ml/ plate of phosphate buffered saline, extracted with equal volumes of chloroform, and centrifuged at 10,000 x g for 15 minutes. The
supernatant was collected and ultracentrifuged at 90,000 x g
and 5° C for 4 hours to pellet the phage. The pellets were
pooled in phosphate-buffered HDF water, supplemented with CsCl at a final density of 1.44 g/ml and ultracentrifuged to equilibrium in self-generated gradients for three days at 5°
C to concentrate the phages. The gradient fractions
containing the virus peak were pooled and desalted as described for HAV. To ensure that the phages were monodispersed, the desalted portions were filtered
successively through Tween-80-treated 0.2 and 0.08 um pore size polycarbonate filters.
EXPERIMENTS
44
experiments were as described by Sobsey et al. (1991) with
the following additions or modifications.
1) Monochloramine at a final concentration of 2.0
mg/L or chlorine dioxide at a final concentration
of 0.5 mg/L was used.
2) Both MS2 and HAV were added to test samples to
give titers of approximately 10^ infectious
units/ml.
3) Experiments were performed in phosphate-buffered
HDF water adjusted to pH values of 6, 8 and 10.
4) In addition to 60 minute long experiments, three
day long experiments using monochloramineat pH 8
were conducted, with additional samples taken at
1440, 2880 and 4320 minutes using monochloramine.
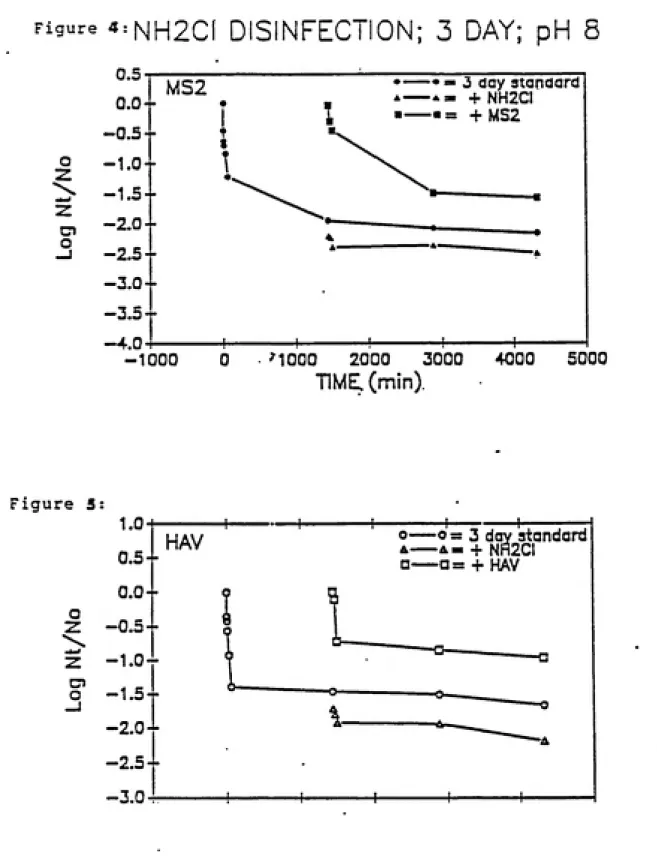
5) Two types of three day long "re-dosing"
experiments were performed with monochloramine at a
pH value of 8. At time=»0, samples were placed in
reaction tubes as usual. After the 1440 minute
samples had been taken, one reaction tube was dosed
with additional HAV and MS2 bacteriophage to achieve
a final concentration of approximately 10^
infectious units/ml. A second reaction tube was
supplemented with additional monochloramine at a
target concentration of 2.0 mg/L. A third tube
ͣ
received no supplemental viruses or monochloramine,
•
taken at specified time intervals as described above
for 3 day-long experiments and virus control and
halogen control tubes were also sampled
periodically.
Data Analysis
Disinfection data as plaque forming units (PFU) per
ml for MS2 and HAV were calculated as average values from
triplicate cultures. For each time point, the average
virus/phage concentration (Nt) was divided by the mean
value of the virus/phage concentration of the controls (No).
These values were then log^^-transformed (log^Q [Nt/No]) and
the values averaged for each set of replicate experiments.
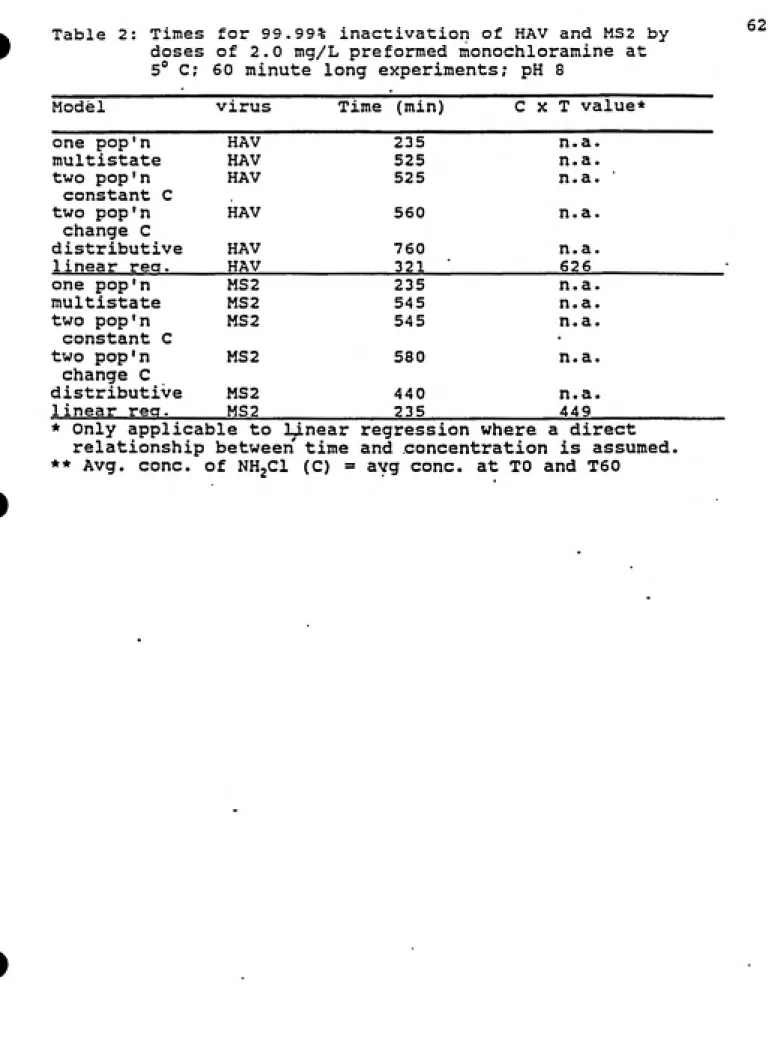
To compute the estimated time for 99.99% virus
inactivation, linear regression was performed on each
experiment and the time estimated from the best fit of the regression equation. This value was multiplied by the
average disinfectant concentration throughout the experiment
to obtain the concentration x time (CT) value.
MODELING
Analytic approach
Each set of data was interpreted through five
,46
disinfectant concentration, time of exposure and fraction of
viruses surviving treatment. The intent of the analysis was
to determine (1) the ability of the various theories to
adequately predict the data, (2) the parameter values
obtained through the fitting of each theory to the data and
(3) the sensitivity of predictions of 99.99 % reduction to
variations in experimental run, virus type, and theoretical
framework of analysis. The various theories employed in the
study, their mathematical formulation, and their associated
bases of axioms, are described below.
Theory 1: One Population
It is assumed here that inactivation proceeds through
first-order kinetics with rate constant k (per unit
concentration). All viruses possess identical values of this
rate constant. The concentration of disinfectant decreases
throughout the treatment period with first order kinetics
and rate constant *. Let Nt be the number of viruses present
in the sample at time t after the onset of disinfection. The
differential equation describing the rate of change of the
number of viruses then is:
dNt/dt = -kC„e-**
where C„ is the initial concentration of the disinfectant.
ONt = N^e
and where N^, is the initial number of viruses. The surviving
fraction may then be obtained through division of both sides of the above equation by N^, or
S(t) = e-kCo(l-e-Xt)/X
Theory 2; One Hit-Two Populations I
It is assumed here that there are two separate
subpopulations of viruses. Each subpopulation is inactivated by first order kinetics, the first with rate constant kl
(per unit concentration) and the second with rate constant k2 (per unit concentration). The concentration decreases throughout the treatment period, with removal rate constant
*. If fl is the fraction of viruses in the first
subpopulation and f2 is the fraction of viruses in the
second population, the solution is analogous to that obtained in theory 1 and yields:
S(t) = fie -kiCo(l-e-Xt)/X + f2e -k2Co(l-e-Xt)/X
Theory 3 : One Hit-Two Populations II
The assumptions here are essentially those of theory 2,
with the exception that the concentration of disinfectant is
4 8
The survival fraction then is:
S(t) = fie -kiCo t + f2e -k2Cot
Theory 4 : Multistate
It is assumed here that viruses must pass through
two substates in being inactivated. The first substate
represents sublethal damage to a virus. The second substate
represents additional damage which is lethal to the virus.
The fraction of initial viruses in the first substate is f,.
The fraction of viruses totally undamaged is fj,. The
transition rate constant from state zero (undamaged) to
state one (sublethal damage) is kj, (per unit concentration) .
The transition rate constant from state one (sviblethal
damage) to state two (inactivated) is k^. The concentration
of disinfectant is assumed constant at C^ throughout the
treatment period. The differential equation for the rate of
change of the number of viruses in the three states then is:
State O: dNJt)/dt = -k^C^N,(t)
State l: dNT(t)/dt = k^C^NJt) - k^C^N, (t)
State 2: dN2(t)/dt = k^C^N, (t)
The fractions of viruses surviving treatment at time t then
State one (or 1 minus the fraction in state two). This
surviving fraction is given by:
S(t)
= f^e-koCot + f^e-kiCot + Jo^e-koCot. g-kiCot)
(ki-ko)^
Theory 5 : Distributive Rate Constant
It is assumed here that the individual viruses are
inactivated by the disinfectant through first-order
kinetics. The inactivation rate constant, k, however, is assumed to be a distributed quantity with probability density function P(k). The concentration is assumed to
change with removal constant and initial concentration c^.
The fraction of surviving viruses then is:
a
S(t) = JP(k)e-kCo(l-e-Xt)/Xdk
In this study, it was assumed that P(k) is a lognormal
distribution with a geometric standard deviation of 3.0. The above equation was integrated niimerically to obtain the
surviving fraction.
Measure of fit;
Each of the above theories was fit to the various
sets of data to obtain estimates of the necessary
parameters. "Best" fitting parameter estimates were
50 the log transformation of the predicted and measured values.
The data points were assigned differential weight based on
the temporal density of the data points throughout the
domain. The equation of the least-square employed was:
Measure of fit = I Wj (ln(pred)i - ln(meas)i)2
where W,. is the weighting for the ith data point and the
DATA IN THE APPENDIX
A summary of the raw data for each experiment is
presented in Appendix 1. This consists of the surviving
fraction of viruses at each time point as well as the
control samples at the start and conclusion of the
experiment. When calculating the percent of original virus
titer remaining at each time point (Nt/No), the average of
the virus control titers were used as "No" to account for
factors other than the disinfectant which may have been
responsible for any observed reduction in titer. The graphs
depicting the averaged values of inactivation for each time
point (for experiments performed under the same conditions)
are also presented in Appendix II. The error bars on the
inactivation curves indicate the range of log Nt/No values
as within one standard deviation of the value plotted.
In addition, Appendix III contains graphs comparing
actual experimental inactivation curves with the
RESULTS
MONOCHLORAMIKE
Effect Of pH levels on monoc>''»ft'rjiiii-<Ti« The results of experiments on inactivation of dispersed HAV and MS2 by a
dose of 2.0 mg/L monochloramine at 5° C are presented
graphically in Figures 1-2, in which mean log,o Nt/No is
plotted against contact time in minutes. Figure 1 plots HAV
and MS2 individually with respect to inactivation at all
three pH levels (6, 8 and 10). Figure 2 plots both viruses
at a given pH (pH 6, 8, and 10), with data for each pH
plotted separately.
Both MS2 and HAV reacted similarly to doses of
monochloramine at the different pH values, indicating that
MS2 is an adequate model indicator of HAV and perhaps other enteric viruses. After 60 minutes of contact, inactivation
of MS-2 and HAV was about 1 log,o or 90 %. For HAV,
inactivation was somewhat greater at pH 10, than at pH 6 and
8 (Figure 1). However, under no condition was there greater
than one log,Q virus reduction at 60 minutes.
Three dav-lona experiments. Figures 3-5 illustrate