ABSTRACT
VENKATESWARLU SWARNA. Sewer System Planning Using Household Willingness
to Pay Data. (Under the direction of DR. DONALD T. LAURIA) .
The planning problem of this research deals with using household willingness to
pay information to improve sewer system planning in less developed countries, particularly
in selecting the regions to be served by sewers and in transporting the wastewater from
these regions to a treatment plant through an optimal network of trunk sewers. To address
the planning problem, this report has developed three planning models of varying
mathematical complexity and has demonstrated their application for a hypothetical city.
The first model, the least complex of the three, approaches the planning problem by
assuming that trunk sewer costs can be ignored, and it solves the model with simple
arithmetic calculations. This model is best for cities in which trunk sewer costs are
negligible or are covered by subsidies. The second model considers trunk sewer costs and
assumes trunk sewer routing. It uses linear programming to determine the optimal solution
even though the model involves binary variables. This model is applicable where trunk
sewer routing choices can be made based on engineering judgment. The final model, the
most complex of the three, considers trunk sewer costs and it determines optimal trunk
sewer routing. This model uses mixed integer programming for solution; it is most
appropriate for regions in a city that are flat and distant from treatment plants, conditions
which essentially do not present an obvious engineering basis for deciding trunk sewer
ACKNOWLEDGMENTS
•
My deepest appreciation goes to Dr. Donald T. Lauria for his guidance, care, and
help during my stay at Chapel Hill. I am especially gratefial to Dr. Lauria for all his efforts
that helped me grow both as an engineer and a person. I thank Drs. Dale Whittington and
George Christakos for readily agreeing to be the readers of the technical report and for
improving the quality of the document with their comments. I also thank Dr. Albert
Wright of the World Bank for providing the financial support for most of my research. I
want to thank Professors Charles ReVelle of The John Hopkins University, Abraham
Chames of the University of Texas at Austin, and Kingsley Haynes of George Mason
University for providing guidance in the initial stages of this research and for suggesting
directions for development. Thanks also go to my friends for providing me with moral
support during the difficult times of my graduate study : Anjum Altaf, J. R. Deshazo, Bill
TABLE OF CONTENTS
Page
Chapter 1. INTRODUCTION...1
1.1 Conventional Planning Methods...1
1.2 Problems with Conventional Planning... ...2
1.3 Estimating Household Demand for Improved Sanitation...3
1.4 Using Demand Information for Sanitation Planning...4
1.5 Research Problem... ...5
1.6 Scope and Objectives...6
1.7 Overview...6
Chapter 2. LITERATURE REVIEW...10
2.1 Existing Sewer Planning Models...10
2.2 The Contingent Valuation Method...13
2.3 Sewer System Planning with WTP Data...14
Chapter 3. PLANNING MODELS...20
3.1 Planning Problem...20
3.1.1 Select a planning objective...20
3.1.2 Divide city into number of regions... 23
3.1.3 Collect data on household WTP and sewer system cost...24
3.1.4 Estimatenumber of connections, revenues and sewer system
cost for each region...24
3.1.5 Make planning decisions to achieve the selected obj ective...26
3.2 Planning Models...27
3.2.1 Consider trunk sewer costs and assume routing choice...28
Unknown Trunk Sewer Cost...33
3.2.2 Consider trunk sewer costs and determine routing choice...35
Trunk Sewer Cost Assumed...36
Unknown Trunk Sewer Costs...38
Chapter 4. MODEL APPLICATION TO A HYPOTHETICAL CASE...47
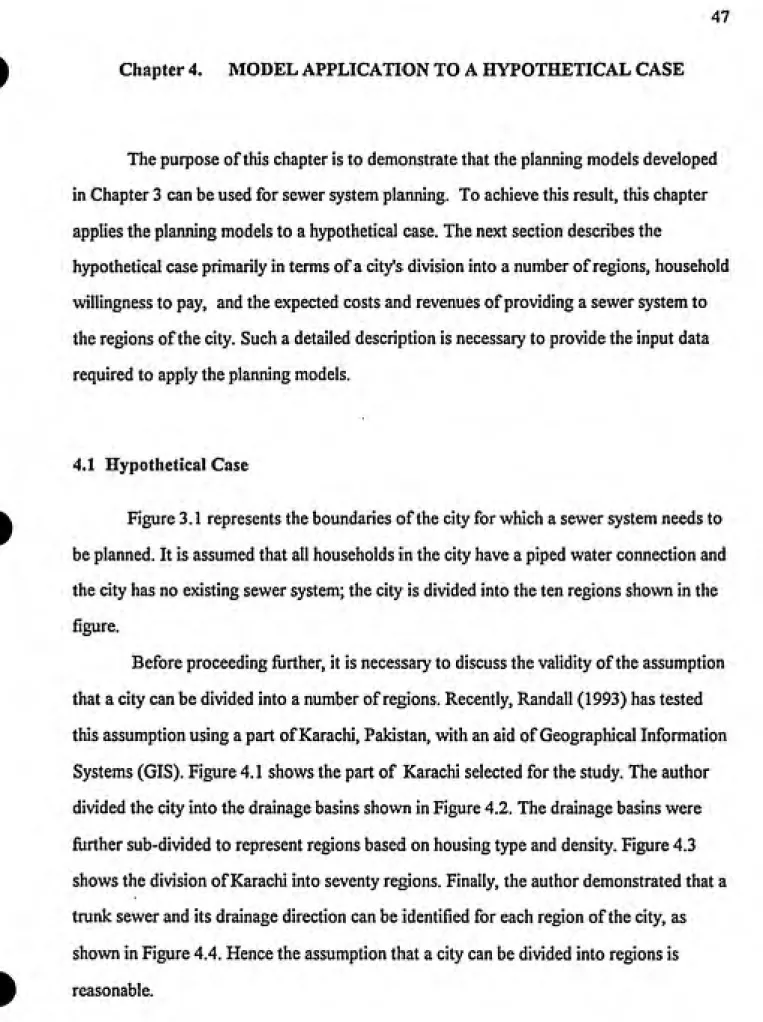
4.1 Hypothetical Case...47
4.2 Application of Planning Models...50
Chapter 5. DISCUSSION AND CONCLUSIONS...70
5.1 Ignore Trunk Sewer Costs...72
5.2 Assume Trunk Sewer Routing...74
5.3 Suitability of the planning models for other planning obj ectives...77
5.4 Conclusions...78
5.5 Directions for Future Research...80
Appendix A. Relation Between Street Sewer Diameter and Area of the Region ...
that Can be Served...98
Appendix B. Estimating Average Street Sewer Size Required for a Region...100
Appendix C. Estimating Fixed Charge Cost Function for Trunk Sewers...102
Appendix D. LP Constraints for Solving Network in Figure 4.6...104
Appendix E. MIP Constraints for Solving Network in Figure 4.5...108
LIST OF TABLES
Tables. 1
Table 4.1
Table 4.2
Table 4.3 Table 4.4 Table 4.5
Page
Summary of Planning Models 43
Characteristics of the City by Region 55
Number of Connections, Annual Revenues and Quantities of
Wastewater if Fee for Sewers is $ 3 / month 56
Cost of Street Sewers 57
Annual Set-up and Marginal Costs for Regions 58
Regions to Receive Street Sewers if Trunk sewer
Costs are Ignored 59
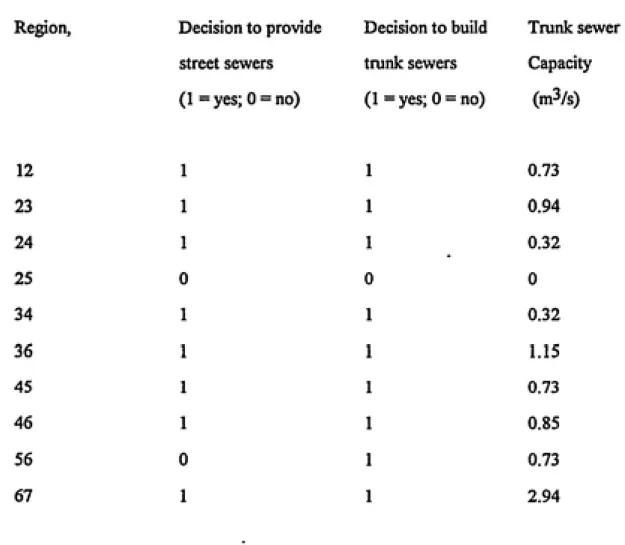
Table 4.6 Results for the LP Model that Considers Trunk Sewer Costs and
Assumes Trunk Sewer Routing Decisions in Advance 60
Table 4.7 Results for the MIP Model that Considers Trunk Sewer Costs and
Determines Optimal Trunk Sewer Routing 61
Table 5.1 Effect of Ignoring Trunk Sewer Costs on the Decision to Provide
Sewers to the Regions of a City 82
Table 5.2 Trunk Sewer Routing Alternatives for the Selected City 83
Table 5.3 Effect of Trunk Sewer Routing Alternatives on Net Revenues 84
Table 5.4 Comparison of Trunk Sewer Routing Alternatives to
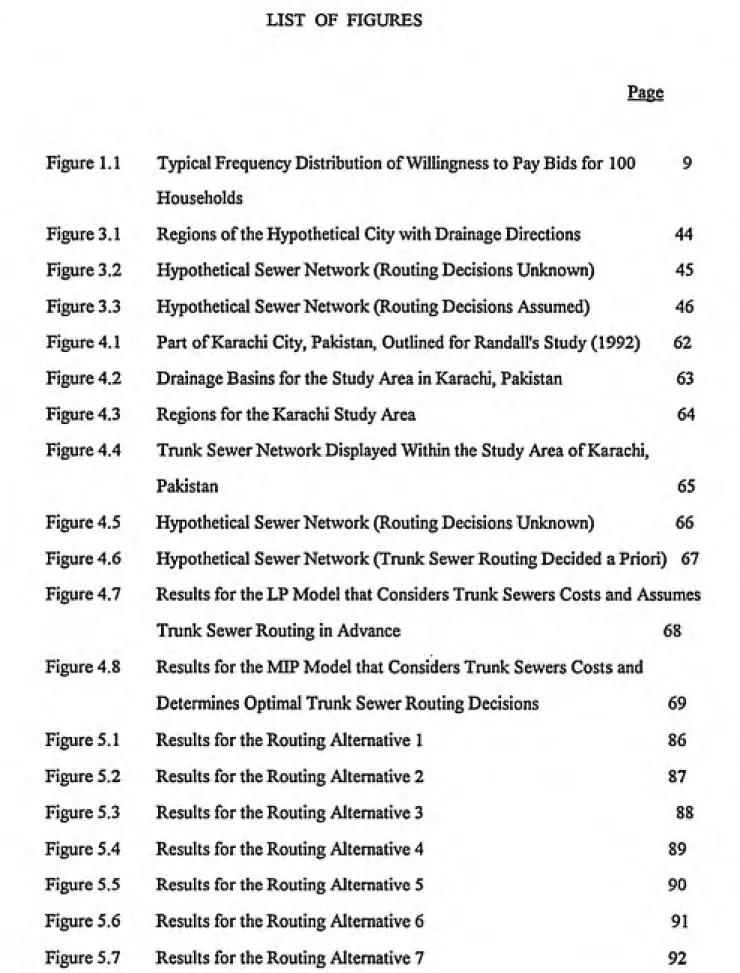
LIST OF FIGURES
Page
Figure 1.1 Typical Frequency Distribution of Willingness to Pay Bids for 100 9
Households
Figure 3.1 Regions of the Hypothetical City with Drainage Directions 44 Figure 3.2 Hypothetical Sewer Network (Routing Decisions Unknown) 45
Figure 3.3 Hypothetical Sewer Network (Routing Decisions Assumed) 46
Figure 4.1 Part of Karachi City, Pakistan, Outlined for Randall's Study (1992) 62 Figure 4.2 Drainage Basins for the Study Area in Karachi, Pakistan 63
Figure 4.3 Regions for the Karachi Study Area 64
Figure 4.4 Trunk Sewer Network Displayed Within the Study Area of Karachi,
Pakistan 65
Figure 4.5 Hypothetical Sewer Network (Routing Decisions Unknown) 66 Figure 4.6 Hypothetical Sewer Network (Trunk Sewer Routing Decided a Priori) 67 Figure 4.7 Results for the LP Model that Considers Trunk Sewers Costs and Assumes
Trunk Sewer Routing in Advance 68
Figure 4.8 Results for the MIP Model that Considers Trunk Sewers Costs and
Determines Optimal Trunk Sewer Routing Decisions 69
Figure 5.1 Results for the Routing Alternative 1 86
Figure 5.2 Results for the Routing Alternative 2 87
Figure 5.3 Results for the Routing Alternative 3 88
Figure 5.4 Results for the Routing Alternative 4 89
Figure 5.5 Results for the Routing Alternative 5 90
Figure 5.6 Results for the Routing Alternative 6 91
Figure 5.8 Results for the Routing Alternative 8 93
Figure 5.9 Results for the Routing Alternative 9 94
Figure 5.10 Results for the Routing Alternative 10 95
Figure 5.11 Results for the Routing Alternative 11 96
Chapter 1. INTRODUCTION
This report aims to use household demand information to improve the methods
used to plan sewer systems in the urban areas of less developed countries (LDCs). This
chapter first describes the conventional methods typically employed for sewer system
planning and the problems resulting fi-om their use. Then it explains the use of household
demand information such as willingness to pay collected from contingent valuation studies
for potentially overcoming some of the problems. Later the chapter describes the specific
research problem, scope and objectives of the report. An overview of the report is
provided in the last section.
1.1 Conventional Planning Methods
The conventional methods employed for planning sewer systems in LDCs are
similar to those of the industrialized countries. They contain three primary decision steps:
(i) select the geographical regions (or zones) of city to be sewered, (ii) determine the
sewer system layout to serve the selected regions, and (iii) select depths and diameters for
the sewers. This report does not address the topic of selecting depths and diameters of
sewers. Sewer layout requires specification of sewer locations and routing. These
decisions are generally made based on the topography of the city and location of the sewer
outfall. In this report sewer layout refers only to the routing of trunk sewers.
The geographical zones or regions to be sewered are generally selected following
provide sewer systems to only a few regions in which households are predicted to afford
the O&M costs. Planners also assumed that a household would seek a connection to a
sewer system if 3 to 5 percent of its total income is equal to or greater than the fee that is selected to recover the O&M costs (World Bank Water Demand Research Team, 1991). Using this thumb rule, the number of connections and the revenues can be estimated at the selected fee. If the anticipated revenues are greater than the expected O&M costs of the
region, then sewers are offered to the region when sufficient subsidies for the capital costs
are available from government.
In summary, a major characteristic of the conventional approach to sewer system
planning is that planners in developing countries make decisions based on assumptions
about household aflfordability instead of consulting the potential beneficiaries about their
aflfordability and willingness to pay to connect and use the sewer system.
1.2 Problems with Conventional Planning
The conventional methods that have been successful in industrialized countries
have failed in many LDCs. The main problem is due to using erroneous assumptions
about household afFordability that has resulted in low and unsustainable sanitation
coverage and worsening public heahh problems.
The assumption that households can pay only O&M costs has limited the number
of people served with improved sanitation since available subsidies for capital costs are
sufficient only to serve a few cities. When sewer systems were built and offered at a selected fee, in many cases it was found that the fee was too high for many households;
hence only few could afford to connect. The predictions based on the rule of thumb
regarding the number of connections have not been met in many cases, which subsequently
has resulted in insufficient revenues to pay the O&M costs and has threatened the ability
The low and unsustainable sanitation coverage coupled with the rapid growth of
urban populations has left many urban people seeking private solutions. In some urban
areas, many households have adopted expensive "septic" latrines that discharge effluent
along with biodegradable solids into streets or street gutters (Altaf et al., 1993). In the
absence of no better alternative, some poor households have used public lands for defecation and disposal of human waste and wastewater (Whittington et al., 1993a).
These unsafe private sanitation practices lead to gross environmental degradation and have
exposed millions of people to risks of disease.
1.3 Estimating Household Demand for Improved Sanitation
Noticing the failures of many sewer system plans and the potential public health
problems due to bad sanitation, international organizations such as the World Bank started
investigating different approaches for improving sanitation as early as 1976. Instead of
relying on assumptions about household affordability for sewer system design, planners
have attempted in recent years to collect demand information from households, the
primary beneficiaries of the improved sanitation systems (Altaf and Hughes, 1991;
Whittington et al., 1993b).
For goods exchanged in markets, demand information is readily available.
However, since markets for wastewater disposal do not exist, planners are attempting to
estimate household demand for improved sanitation in LDCs using several techniques that
assume a pseudo or fictitious or contingent market. Among these techniques, the
contingent valuation method appears to be promising. The contingent valuation method is
a survey technique in which randomly selected households are asked about their
LDCs (Altaf et al, 1992; Briscoe et al., 1990; Whittington et al. 1987, Whittington et al.,
1993b).
1.4 Using Demand Information for Sanitation Planning
The information needed in order to avoid some of the past mistakes of sewerage
planning includes (1) the number of households that would opt for connections at
specified fee, (2) the expected revenues, (3) needs for subsidies, and (4) whether the
system can be financially self sufficient. Household demand data fi-om contingent
valuation studies can provide much of the important information needed for planning.
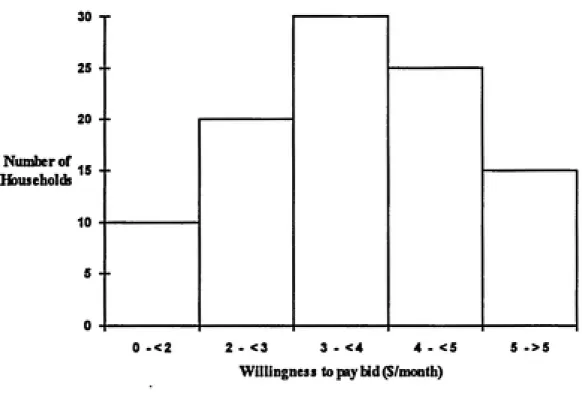
The histogram in Figure 1.1 indicates fictitious household WTP data for 100
randomly selected households. The abscissa and ordinate respectively indicate
willingness-to-pay categories and the corresponding number of households that said they
would pay the amounts. For example, the figure indicates that 20 households would be
willing to pay at least $ 2 per month but less than $ 3.
The information in Figure 1.1 is useful for estimating the number of connections at
a specified monthly fee. Assume that the monthly fee is $ 3 per household. All
households whose indicated WTP is equal to or greater than $ 3 are predicted to seek a
sewer connection. Figure 1.1 indicates that 70 households would opt for sewer
connections at the $ 3 monthly fee. These 70 households would consists of the 30
households that are willing to pay between $ 3 and $ 4, plus the 40 (25+15) households
that are willing to pay $ 4 per month and above.
Once a monthly fee is selected, the total number of households willing to pay it can
be estimated and the total revenue can be calculated by multiplying the total number of
connections by the fee. Annual revenues can be calculated by multiplying the monthly
revenues by twelve months. Assuming that the annual cost of supplying the sanitation
sufficient to cover the annual costs, and if not, the amount of subsidy that would be
required to cover the unmet cost.
1.5 Research Problem
An important step in sewer system planning is to select the regions to be served. A
key question is to determine whether sewers should be provided to all the regions of a city
or only to selected regions of the city. Since the households seeking a connection would
be distributed throughout the city, planners may decide to provide a sewer system for an
entire city to capture the total connection potential. However, such decisions may not be
cost effective. For example, there may be regions in the city where only few households
would seek connections but the cost of supplying sewers might be very high. From a
financial standpoint, the city should exclude sewers from such regions. Therefore, better
planning requires that sewers should be planned by regions rather than for the entire city.
The planning goal in this report is financial self sufficiency. The planning objective
selected to achieve the goal is the maximization of net revenues. This planning objective
not only ensures financial self sufficiency but also provides city governments surplus
money which could be used for socially desirable things such as subsidizing sewers for the
poor regions of the city that cannot afford sewers etc. However, the allocation of surplus
money as subsidies among the poor regions is not dealt with in this report. To maximize
net revenues, a region is provided with sewers only if the annual revenues generated from
the region are equal to or greater than the annual costs of supplying a sewer system.
Hence forth, for simplicity we ignore the term "annual" when addressing revenues, costs,
subsidies or net revenues. Unless specified otherwise, they shall be treated as annual
values.
Revenues for a region depend on the number of household connections in the
region, while the cost of sewers depends on the street and trunk sewers in the region and
"^"j^sif^satf;*;^^-plant. This implies that selection of regions to be served involves simultaneous
consideration of the regions themselves and trunk sewer routing. Chapter 3 provides a
detailed description of the planning problem.
The major assumptions herein are that cities can be divided into zones or regions, and data on household demand and cost functions for sewer systems are available and accurate. It is also assumed that utilities specify a sewer use fee. Users are assumed to incur no costs other than the fees (i.e., no connection fees or initial plumbing costs). It is assumed that each household is eligible for a sewer connection, which implies that each household has a piped water connection but no sewer connection. Sewer systems are planned to serve only the households expected to connect to the system at the time of
planning. In other words, no excess capacity is provided in the sewer system for future
connections.
1.6 Scope and Objectives
The goal of this research is to improve sewer system planning in LDCs using household WTP data. Since this report does not consider depth-diameter selection,
sewer system planning dealt with herein can be summarized as making use of WTP data
for selecting regions to be served and determining the required trunk sewer layout.
To accomplish the goal, the following two objectives are selected:
(1) develop planning models, and (2) illustrate them with an application.
To achieve the first objective, several planning models are developed, beginning with a
simple model and proceeding to more sophisticated optimization models. The purpose of
developing such a range of planning models is to examine the trade off between modeling
complexity and the accuracy of solution. The second objective is accomplished by
demonstrating the reality of the assumptions used in the planning models, and selecting a
1.7 Overview
Chapter 2 begins with a review of literature on least-cost sewer system planning
models, with primary emphasis on layout. Then it considers the quality of household WTP information obtained through the contingent valuation method. The final section describes the sparse literature that involves application of WTP data to sewer system planning.
Chapter 3 describes and develops three planning models that involve different levels of complexity. The simple model ignores trunk sewer costs. It can be solved with a simple calculator, but it may result in poor planning decisions. The other two are
mathematical models. These models tend to represent reality more accurately, and they may provide better planning solutions, although they are relatively complex and difficult to formulate. The first mathematical model is developed assuming that engineers determine trunk sewer routing decisions using judgment. This model can be solved with linear programming techniques. The second mathematical model, the most complicated of the three, does not assume that trunk sewer routing is known a priori; rather it determines
trunk sewer routing and the regions to be served with sewers. This model requires
mixed-integer programming techniques for solution.
Chapter 4 describes the characteristics of a hypothetical case and demonstrates that the modeling assumptions are reasonable (e.g. a city can be divided into regions and
street sewer cost is known for a region). The selected case represents a city of nearly 2
million people. For planning purposes, the city is divided into ten regions. The trunk
sewer network formed from the regions required routing decisions at three locations.
Finally, the three planning models are applied to determine which of the ten regions
8
The final chapter illustrates the effect of assumptions used in the planning models,
such as ignoring trunk sewer costs or assuming trunk sewer routing, on the accuracy of
planning decisions. It also discusses how the plarming models can be extended to address
another planning objective, namely minimization of subsidies while serving a designated
number of people. Finally, this chapter summarizes major conclusions and suggests some
Figure 1.1 Typical Frequency Distribution of Willingness to Pay
Bids for 100 Households
Number of Households
ou
-25 ͣ
20
15
-5 •
0
-0 -<2 2 - <3 3 - <4 4 - <5
Willingness to pay bid ($/month)
10
Chapter!. LITERATURE REVIEW
This chapter reviews the existing models in the literature related to sewer system
planning and identifies their capabilities and deficiencies with respect to the research
problem of this report. This chapter begins with a literature review of sewer system
planning models that do not use WTP data. The second section summarizes literature on
the contingent valuation method for eliciting household WTP. The final section describes
the literature on sewer system planning that uses WTP data.
2.1 Existing Sewer Planning Models
Existing sewer planning models focus only on "supply" side information. A
typical characteristic of these models is that they do not incorporate household preferences
(i.e., demand information) for planning. Rather, engineers or planners make assumptions
about the number of households that would connect to the sewer system. Such
assumptions are usually not unrealistic for the industrialized countries, but they can be
badly flawed for developing countries.
A large literature exists on models that seek to minimize total cost assuming that
all households would connect to the sewer systems (and hence sewers should be provided
to all regions of a city). The literature focuses on two of the main steps in planning, viz.
(i) optimal layout of the sewer system and (ii) optimal design of sewer depths and
diameters. The first step is the problem ofprimary concern in this report.
Layout optimization deals with the problem of transporting wastewater from
various regions of a city to a treatment plant via trunk sewers. In other words, this
problem aims to determine the routing of trunk sewers in a network. Sewer layout is
generally discussed in the context of trunk sewers although similar principles apply for
11
optimize sewer layout while assuming all or some of the sewer design variables such as
depth and diameter are constant, and (ii) simultaneously optimize sewer layout and depth-diameter design. This section reviews the principal models beginning with simple layout
models that assume known depth and diameters.
Thefirst work to address this problem was by Liebman (1967). He proposed an
iterative heuristic technique to obtain a good trunk sewer routing. The heuristics begin
with an initially assumed feasible sewer layout and improve the layout solution with a less
expensive solution through a systematic search procedure that is similar to enumeration.
Even though this model assumes constant diameters and slopes for all sewers, it cannot
guarantee an optimal solution; rather the solution is sub-optimal depending on the initial
solution and the searching procedure.
Lowsley (1973) extended Liebman's work by eliminating the enumeration
procedure and relaxing the assumption of same slopes for all the pipes. He demonstrated
computational superiority of his algorithm over Liebman's while producing nearly the same
solutions. However, as in Liebman's model, this model requires an initial layout solution
and constant diameters for all sewers; it cannot guarantee optimality.
Tekeli and Belkaya (1986) developed a model for the layout of small networks by
using a shortest path algorithm. To handle a large network, the authors suggested
guidelines for dividing a larger network in to smaller networks and then combining the
solutions of the small networks to get solution for the large network. Although these
guidelines produce feasible solutions, they are not guaranteed to be optimal. The primary
limitation of this work is that the model assumes no cost changes due to changes in (i)
pipe diameters, and (ii) total trunk sewer length required for a layout. This limitation is
equivalent to assuming constant diameters for all sewers as assumed by the earlier models.
Argamen et al. (1973) proposed the first model that simuUaneously optimizes both sewer layout and depth-diameter design to obtain the least cost solution for a gravity
12
and downstream elevations of all pipes. The authors used dynamic programming (DP)
techniques to solve for the decision variables. Although these models can produce optimal
layouts, the model is applicable to only small networks due to the inherent limitations of
DP such as the huge requirements of computer space and time. Application of the model
is additionally restricted because the network was defined through isonodel lines which
require that the ground slopes in a single direction.
Mays et al.(1976) suggested another model for determining both the optimal
layout and depth-diameter design of a gravity sewer network. Sewer design is found with
the use of a variant of DP called discrete differential dynamic programming (DDDP).
Under some restrictive assumptions, the authors determined layout by using a binary
integer programming model that made routing choices at junction nodes. Although the
model is very complex, as the authors acknowledge, the solution may not be optimal
because both the routing choice model and DDDP may not produce optimal solutions.
Recently Li and Matthew (1991) proposed another approach which considers both
sewer layout and depth-diameter design including on-line pumping for the optimization of
sewer systems. The authors used two models to solve the problem. The first model
optimizes sewer depth-diameter design for a given layout using DDDP, and the second
model optimizes layout by maintaining all parameters constant except flow. By integrating
these two models, the authors obtained near-optimal solutions. Like the model of Mays et
al.(1976), this model is also complex and may not provide globally optimal solutions.
In summary, the literature has several models for sewer layout, including those that
consider the design of depth and diameter. These models aim to minimize total sewer
system cost, and they assume that sewer systems should be provided to all the regions of a
city. An important limitation of these models is that they cannot necessarily produce
13
2.2 The Contingent Valuation Method
The various planning models discussed in the previous section assume that all the regions of a city are to be served. However, that is not the case in less developed
countries. Rather determination of which regions should be served is an important part of
the planning process. This section describes the literature that deals with determination of
household demand for improved sanitation.
Conventional planning methods generally evaluate the desirability of providing
water and sewer systems to a region based on the ability of the households in the region to pay for the O&M costs of the systems. A household is assumed to afford and opt for the service if the cost of service is less than 3 to 5 percent of the household income (World Bank Water Demand Research Team, 1991). At a selected fee, the number of connections is estimated following the above rule of thumb, and then revenues are calculated. If the
expected revenues are equal to or greater than the expected O&M costs, sewers are
provided to those regions for which sufficient subsidies to cover capital costs are available
from the government.
Since many of the projects in LDCs have failed, planners started questioning the basic assumptions used in conventional planning, particularly the one that a household can afford to pay 3 to 5 percent of its total income towards water and sanitation services. Field studies have recently been conducted to estimate household willingness to pay
(WTP) for improved water and sanitation services using the contingent valuation method. World Bank Water Demand Research Team (1991) provides a summary of WTP studies
based on this method.
The contingent valuation method (CVM) is a survey technique in which a
selected sample of households is asked about their willingness to pay for a good or service
under specified conditions. The results fi"om the sample can be used for either specific
14
al., (1986) and Mitchell and Carson (1986). The main advantage in principle of this method is that it can indicate the WTP of households, which, as will be shown in this report, can be used for deciding which zones to serve with sewers. However, a potential
problem with the CVM is that a household may not know or reveal its actual WTP for an
improved sanitation systems. If WTP data are not accurate, then there is little advantage
in using them for sewer system planning. The rest of this section is devoted to the validity
of WTP data. Although the literature offers a variety of techniques to estimate WTP, only the contingent valuation method (CVM) is considered here.
Although only little work has been done for estimating household demand in the
context of sanitation (Altaf and Hughes, 1991; Whittington et al., 1993b), research has been done on the application of CVM for estimating the demand for improved water
supply in many LDCs (Altaf et al, 1993; Briscoe et al., 1990; Ramasubban et al., 1990; Robinson et al., 1990; Whittington et al., 1987; Whittington et al., 1989). These research
studies demonstrated that CVM results on willingness to pay were not random if proper precautions were taken in the design of questiormaires and field procedures. WASH (1988) provides guidelines for conducting WTP studies for improved water supply in developing countries. In all of these studies, the WTP amounts are consistently and
systematically related to many variables that are suggested by consumer demand theory.
The explanatory power of these models has been found to be high enough to reject the hypothesis that household willingness to pay responses are random. Although many CVM studies have been conducted to estimate WTP for improved water and sanitation facilities,
it appears inconclusive that the elicited WTP values are the actual amounts that household
will in fact pay if oflfered the option of connecting to improved systems.
2.3 Sewer System Planning with WTP Data
15
literature exists on the use of WTP data to plan sewer systems in LDCs. Probably the
most relevant work is the World Bank report titled "Strategic Sanitation: A
Demand-Oriented Approach to Urban Sanitation Services" (World Bank, 1992).
Chapter 3 of this report uses household WTP data collected from a case study and
illustrates how the data can be used for planning an on-site sanitation technology for a
t5^ical city in a less developed country. The number of connections are estimated at a
selected fee from the frequency distribution of household WTP using the procedure
mentioned in Chapter 1. A monthly fee determines the total number of connections, which
subsequently determines the other planning information such as revenues, costs, and waste
quantities. This planning information is calculated at different monthly fees and is shown
graphically.
The revenues and costs are calculated by multiplying the expected number of
connections by (1) the monthly fee, and (2) the cost of serving a household, respectively.
For illustration sake, the authors assumed that WTP represents the actual household
benefits and calculated total benefits by aggregating the WTP of all the households
expected to connect to the sanitation system. Net benefits and net revenues are calculated
by subtracting the costs from the total benefits and revenues respectively.
The authors demonstrated that although the graphical analysis is simple, it can
provide the following valuable planning information:
1. As the monthly fee increases, the number of connections, benefits, and costs of sewer
system decrease. On the other hand, the revenues initially increase and then decrease.
This information allows planners to select the fee corresponding to maximum revenues, if
desired.
2. A graph representing the variation of net benefits, net revenues, and coverage along
with fee provides planning information dealing with single and multiple planning objectives. It helps planners to identify the required monthly fee to achieve various
16
coverage subjected to sewer system financial self sufficiency. The graph presenting the
variations of net revenues and benefits with respect to coverage provides information on
required subsidies to attain a given level of coverage.
The main limitation of this work is that it provides information only on whether or
not the entire city should be served with sewers but not on what specific regions should be
offered sewers. Another limitation of this chapter is that it does not deal with issues such
as trunk sewer layout and depth-diameter design.
Chapter 4 of the same World Bank report and Lauria et al.(1993) makes use of
household WTP in matching household demand with the supply of single and multiple
sanitation technologies for the various regions of a city. For planning sewer systems for a
city, the authors assumed that the data related to household WTP and sewer system cost
are known for each region. From these data, the number of connections in each region at
the selected fee can be estimated and then the cost of serving a household in a region can
be calculated. The authors assume that the monthly cost of serving a household would
normally be greater than the selected monthly fee and that a subsidy would therefore be
required.
The problem addressed deals with the allocation of a subsidy among regions of a
city so as to maximize the total number of households served by the sewer system. The
authors have noted the similarity of this problem to the capital budgeting problem that has
been extensively studied in the operations research literature, and they have modeled the
planning problem with the linear programming (LP) formulation shown below.
Maximize S ^i ^*1- ('^•^)
X (ci-w)Hi < B Eq.(2.2)
i ͣ
17
Hj > 0 for all i Eq. (2.4)
where Hj = Number of households to be served with a sewer system in zone i (decision
variable)
cj = Annual cost per household of a sewer system in zone i w = Annual revenue per household from using the sewer system
cj-w = Required annual subsidy for serving a household in zone i
B = Available annual subsidy
Tj = Number of households in region i, whose willingness to pay is equal to or
greater than the selected fee, w
Equation (2.1) is the objective function that aims to maximize the number of households served with a sewer system. Equations (2.2) to (2.4) constitute the constraint
set for the LP model. Equation (2.2) indicates that the total subsidy required for all
households in the regions should not exceed the available budget. The next constraint
(Eq. 2.3) ensures that the number of households served in a region cannot be greater than the number of households whose WTP is equal to or greater than the proposed sewer fee. The final constraint specifies the non-negativity conditions. Since all the constraints and the objective function of the model are linear, and the decision variables are continuous,
LP can be used to solve it.
The above model can be used to allocate a given subsidy among households in various regions. On the other hand, planners may like to know the amount of subsidy
required to provide service to a fixed number (or percentage) of households. To handle
Minimize
Z (ci-wi)Hi
i
such that
Z Hi > N
Hi < Ti
Hi > 0
18
Eq. (2.5)
Eq. (2.6)
Eq. (2.3)
Eq.(2.4)
where N = minimum number of people required to be served with the sewer system.
The objective fiinction (Eq. 2.5) aims to minimize the total subsidy required for all
regions. The first constraint (Eq. 2.6) requires that the total number of households served
in all regions should not be less than the selected targeted number of households. The
other constraints are the same as in the earlier model. This model can be solved using LP
techniques.
The authors note that the above models do not require LP but can be solved with
marginal analysis. For example, the first model aims to maximize coverage under a budget
constraint. Naturally, the smaller the cost of serving a household, the more households
can be served with the given subsidy. Hence maximum coverage can be achieved if the
subsidy is allocated to the regions in which the per household cost of service is minimum.
To guide investments among regions, the authors proposed a ranking parameter
that indicates the desirability of regions to be provided with sewers, and allows sewer
system planning based on regions. The ranking parameter for the first model is the annual
required subsidy per household. For each zone, the ranking parameter can be calculated
and the subsidies can be allocated to maximize coverage. The same ranking parameter can
also be used to achieve the planning objective specified in the second model, i.e.
minimization of total subsidy subject to providing service to at least a specified number of
households.
Since sewer system planning is simplified with the use of a ranking parameter, and
19
that use spread sheets. The major advantage of the work is that sewer system planning is made simple. However, the major limitation of this work is that it wrongly assumes that the cost of serving a household with a sewer system does not vary with the number of households connected in a region. Basically, it is not possible to obtain accurate numerical
values for Cj.
It is clear that the literature offers very little on the optimal planning of sewer
systems using WTP information. Although the literature has some models related to the
components of the problem, particularly with respect to the optimization of sewer layout, those models have the objective of minimizing sewer cost as opposed to maximizing net
revenues, which is the planning objective in this report. Due to differences in the objective function, the existing models and their solution techniques are not of much help in solving the planning problem of this report. Therefore, the planning problem requires a new
20
Chapters. PLANNING MODELS
This chapter first explains the planning problem and then develops planning models,
starting fi^om simple ones and moving to more complex and realistic ones.
3.1 Planning Problem
Consider a city in which most households are served by piped water systems. Suppose that the city does not have a sewer system, but such a system is to be planned
using household WTP information. Further assume that the city terrain allows a gravity
sewer system to be built. It is assumed that sewers are not to be designed with excess
capacities. Planning a sewer system for the city by making use of household demand
information typically involves the following steps (World Bank, 1992):
1. Select a planning objective
2. Divide the city into a number of regions
3. Collect data on household WTP and sewer system costs
4. Estimate the number of connections, revenues, and costs of the sewer system
in each region
5. Make planning decisions to achieve the selected objective.
Each of these steps is explained below and applied to the hypothetical city.
3.L1 Select a planning objective
Planners use a variety of objectives to allocate society's scarce resources. The
planning objective selected for this report is maximization of the sum of net revenues of
providing sewers to the city. Net revenues for a region are defined as revenues less the
costs of supplying sewers. Typically the cost of a conventional sewer system would be
21
maximization might initially appear unrealistic. However, this report makes the following
arguments to support this planning objective.
Conventional sewer systems are too expensive to be affordable in many cities
without subsidies. Perhaps the limited applicability of conventional sewer systems to
urban areas prompted engineers in various countries to invent a new type of low-cost
off-site sanitation called intermediate sewerage. World Bank (1992) and World Development Report (1992) provide a description of an intermediate type of sewerage that has been
successfully used in many cites in the Third World. The characteristics of these systems
are briefly discussed below.
Essentially, intermediate sewer systems achieve cost savings by modifying the
design standards or changing the components of conventional piped sewerage. For
example, simplified sewerage judiciously manipulates design standards for several design parameters such as minimum depth, minimum slope, and minimum diameter. Such changes
can reduce costs by 20 to 90 percent of conventional sewerage; these systems are now
being used in Brazil, Argentina, Bolivia, Colombia, and Cuba (Bakalian et al. 1991).
Solid-free sewerage collects solids at an intercept tank which facilitates using smaller
diameter sewers at flatter gradients to reduce both excavation and pipe costs. This system
is used in parts of Argentina, Brazil, Colombia, India, Mozambique, Australia and
Zambia. The cost savings with this system are reported to be around 20 %.
Subdivided sewerage and "condominial" systems are some other popular
intermediate sewer systems. Subdivided sewerage divides a sewer system into a number
of smaller independent networks. Each network is connected to a local treatment plant.
These systems are appropriate for flat terrain areas having high ground water tables where
using conventional sewerage would require high pumping and excavation costs. These
systems are used in Minas Gerais, Parana, and Brazil, where considerable cost-savings are
achieved. In a "condominial" system, instead of letting each house directly connect to
22
houses in the block before making a direct connection to a street sewer. Because of its shorter lengths and small diameter pipes, the system costs were reduced by nearly 70% . These systems are also being used in northeast Brazil (Melo, 1985).
Perhaps the most successful innovation is from the Orangi Pilot Project in Karachi,
Pakistan. This project used principles of simplified, solid-free, and condominial sewers.
Coupled to this engineering knowledge, organizational innovations such as community collection and community management of finances and labor dramatically reduced
financial costs by nearly 90% ( Hasan, 1986).
In summary, intermediate sewerage systems are 20 to 90 % less expensive than
conventional sewer systems and are successfully being used in many parts of the world (World Bank, 1992). While the costs of the intermediate sewer systems are lower, the households' ability and willingness to pay have improved in some cities of the world due to
rapid economic development.
Some of the surveys conducted to estimate household WTP for improved water
and sanitation facilities revealed that households in some parts of the world have displayed
their ability to afford the high costs of improved sanitation systems. Altaf et al., (1993)
reported that many households in a Pakistani city, in the absence of sewer system, have
invested huge sums privately to procure a sanitation facility, flush toilets connected to holding ponds. It is estimated that Jakarta in Indonesia has over 80,000 such units (World Development Report, 1992). This report comments on private investments as follows: "
For sanitation, too, particularly in urban areas, households throughout the world make
large investments to compensate for the absence of public infrastructure...Investments in these tanks (septic) are substantial, usually in the order of a few hundred dollars."
These examples indicate households' ability and willingness to pay for improved
23
positive and allow sewer systems to serve at least some regions of many cities abroad.
Hence, maximization of net revenues is not necessarily be impractical planning objective
and thus is adopted for the models of this report.
3.1.2 Divide city into number of regions
Let Figure 3.1 represent the boundaries of a city that plans to build a sewer
system. Chapter 1 suggests that planning decisions would probably improve if planners
designed sewer systems based on regions in a city rather than for the whole city. The criteria selected to divide a city into a number of regions should consider the technical
feasibility of building sewers in the identified regions. Since sewers typically discharge
wastewater under gravity, the regions selected must have ground sloping uniformly in a
single direction, which is often possible if regions are selected based on drainage basins. Figure 3.1 shows the regions and the drainage directions in the city.
If planners decide to serve a region with sewers, then street sewers would
probably have to be built on all streets throughout region. This is because of the following
reasons: (i) the residences of all the households that actually would connect to the sewer
system in each region cannot be known fi-om the type of WTP surveys described in Chapter 2, and (ii) each household that is willing to pay the sewer fee is assumed to be provided access to the sewer system when other households in the region have such
access. However, only one trunk sewer is needed since its purpose is to transport
wastewater (i) generated in the region and (ii) contributed from the upstream regions to
the treatment plant. In other words, if any region is to be served with a sewer system,
then it will need a trunk sewer.
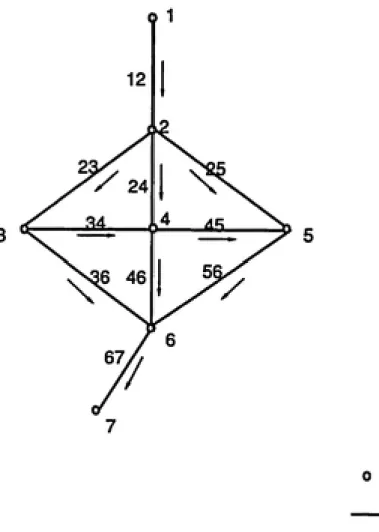
The network with candidate trunk sewer links is shown in Figure 3.2. Note that
each trunk sewer link is designated by a pair of numbers. The same pair of numbers is
used to define the region through which the trunk sewer passes. These numbers represent
the "fi-om node" and the "to node" of the trunk sewer. Although unconventional, such
- ,- 24
downstream nodes; i.e., the numbers specify the direction of flow. For example, arc 24 in
Figure 3.2 represents the trunk sewer in region 24 that connects nodes 2 and 4,
discharging wastewater towards node 4.
3.1.3 Collect data on household WTP and sewer system cost
Chapter 2 describes how information on household willingness to pay can be
collected. Typically, WTP surveys collect data on (i) household WTP for sewer systems
and (ii) households' existing sanitation practices and socioeconomic characteristics that are
used to analyze household WTP data.
Data required to design and estimate the cost of a sewer system should also be
collected during field surveys. Since sewers typically discharge wastewater through the
force of gravity, designing sewers requires a contour map and other regional
topographical information such as a region's area, population density, and trunk sewer
length. To make sure that sewers are not laid below the ground water level, data on
subsurface conditions such as soil type and ground water level are required. Finally, unit
prices of such items as sewer pipe, labor, excavation, and paving are needed to estimate
sewer system costs.
3.1.4 Estimate number of connections, revenues and sewer system cost for
each region
Chapter 1 describes how to estimate the number of connections and revenues for each region based on WTP data of a city. Regarding the cost of street sewers, if a region
is sufficiently small, then a minimum diameter (usually 6 or 8 inches) would be adequate
for all street sewers in the region. Appendix A shows the relationship between a street
sewer and the size of the region it can serve. Using these guidelines, one can calculate how
small a region must be to qualify for using minimum diameter for all street sewers. If a
region is sufficiently large, then an average diameter should be used for the purpose of
estimating street sewer costs. Appendix B provides guidelines for estimating such an
"^ 5^«»^^T»-?r""W(pS33
25
determined for street sewers in a region, the cost of street sewers can be estimated and are
known.
Trunk sewer costs in a region depend mainly on the quantity of wastewater to be
carried and sewer length. Although the required trunk sewer length is typically fixed for a
region, the capacity is not. Required trunk sewer capacity in a region depends on the
quantity of wastewater to be carried fi^om the region plus the wastewater that the
upstream regions contribute. For example, consider region 24 of the network shown in
Figure 3.2. The trunk sewer capacity there depends on the following two terms in addition to the wastewater generated fi^om region 24
(1) the quantity of wastewater collected at node 2, and (2) whether or not the flow is routed through region 24.
The first term is governed by the decision to provide sewers to upstream region 12, since
node 2 can collect wastewater only if region 12 is supplied with sewers. Even if a trunk
sewer is built in region 12, the capacity of trunk sewer 24 may not be affected if
wastewater is not routed through 24. Such a possibility is defined by the second term.
For example, if a trunk sewer is routed through region 23, then upstream flow
contribution to trunk sewer 24 would be zero. The point here is that trunk sewer capacity
and subsequently the cost of a trunk sewer in a region cannot be calculated without the
knowledge of which upstream regions are served with sewers and how their wastewater
is routed. In summary, revenues can be easily estimated for any region but costs cannot.
3.1.5 Make planning decisions to achieve the selected objective
The planning problem of this research deals with using household willingness to
pay information to improve sewer system planning in LDCs, particularly in selecting the
regions to be served by sewers and in transporting the wastewater from these regions to a
treatment plant through an optimal trunk sewer route. Such planning involves
simultaneous consideration of these two planning decisions. In other words, optimal
26
this report henceforth considers this planning problem primarily as involving the selection of regions, for which planning models are presented in the next section.
Net revenues to a city would be maximized if all regions that have non-negative net revenues are served with sewers. In the previous section, it is shown that while revenues can be estimated for a region, costs cannot because they depend on the planning
decisions for upstream regions. Hence the decision on whether to serve a region depends
on planning decisions for upstream regions.
In fact, the decision to provide sewers to a region is even more complicated in that it depends not only on the planning decisions in the upstream regions but also on the
decisions of the downstream regions. This additional complexity is due to the fact that a trunk sewer, if built in a region, must be routed to the treatment plant without
discontinuity. Consider region 24; if a trunk sewer is built there, even if none of the downstream regions are served with sewers, trunk sewers must be built in some of them to transport the wastewater collected from region 24 to the treatment plant. In other words,
building a trunk sewer in region 24 involves additional costs in the downstream regions for
transporting wastewater to the treatment plant.
The magnitude of this additional cost depends on several factors, such as the
distance of the treatment plant from node 4, and the routing direction of wastewater to the
treatment plant. The division of this cost among the regions (or who pays for it) depends on whether the downstream regions are served with sewers. For example, if none of the downstream regions receive sewers, then this costs should be borne by the upstream
regions since they are the sole beneficiaries. If downstream regions are also served with sewers, then both the upstream and downstream regions would bear them. In other words, the additional cost borne by region 24 depends on which of the downstream regions
27
section develops planning models, starting from simple ones and moving to more complex
and realistic ones.
3.2 Planning Models
If trunk sewer costs constitute only a small percentage of total sewerage cost, then it may
be possible to ignore them, which reduces the complexity of planning. If trunk sewer costs can be
ignored, sewer costs in a region would be due to only street sewers. Like revenues, street sewer
costs can often be easily estimated for a given region, making it relatively easy to calculate net
revenues for the region. Net revenues for a city would be maximized if all of the regions with
non-negative net revenues are served. In other words, under the assumption of negligible trunk
sewer costs, planners should provide sewers to all the regions for which revenues are greater than
or equal to the cost of street sewers.
Unfortunately, the literature does not provide any assurance or evidence that trunk
sewer costs generally constitute an insignificant portion of total sewer system cost.
Hence, ignoring the trunk sewer costs might result in erroneous planning decisions; the
following models therefore incorporate trunk sewer costs.
3.2.1 Consider trunk sewer costs and assume routing choice
Once trunk sewer costs need to be considered, problem complexity increases
because planners must determine (i) the regions to be served with sewers and (ii) trunk
sewer routing to the treatment plant. Engineers typically decide routing based on
judgment. They know that the wastewater received by a node should be routed through
only one of its immediate downstream trunk sewers, if several paths are available. This is
due to the observation that sewer systems have a typical tree shape with several branches
at the start of the network that converge into fewer branches as wastewater from
peripheral areas is transported to the treatment plant. The tree shape is due to the fact
that a node routes the wastewater it may receive from several upstream regions to only
28
The routing choice may be obvious at some nodes which have only one
downstream trunk sewer. For example, node 5 must discharge into trunk sewer 56 since
no other choice is possible. However, the routing choice is difFicuh at nodes that can
potentially route in more than one direction. For example, consider node 2. The
wastewater received there can be discharged through trunk sewers 23 or 24 or 25. One
guideline used to decide routing under such circumstances is to transport wastewater to
the treatment plant as quickly as possible to avoid septic conditions that may arise in the
sewer system. Two methods to accomplish this are routing through regions (i) that have
steep drainage directions, and (ii) that are closer to the treatment plant (Tekeli and
Belkaya, 1986). Suppose wastewater at node 2 is routed through trunk sewer 23,
assuming region 23 has a steep slope. Figure 3. 3 represents such a routing decision by
showing trunk sewer continuity through node 2 onto node 3. The discontinuity of the
trunk sewer at node 2 towards nodes 4 and 5 indicates that the trunk sewer is not routed
through regions 24 and 25. Based on the shortest path to the treatment plant, assume that
nodes 3 and 4 route their wastewater through trunk sewers 36 and 46 respectively.
Optimization techniques are used in the following section to solve the planning problem.
First, a simple optimization model is developed assuming that trunk sewer costs are independent
of design flow, and then the model is expanded to consider the more realistic case in which trunk
sewer costs depend on the quantity of flow they carry.
Trunk sewer cost is independent
This model assumes that trunk sewer costs for a given region are known irrespective of
what regions have sewers, how the trunk sewer is routed, and how large is it. This assumption
tends to be unrealistic, and this model may not be too useful for engineering applications.
However, it serves to simplify the modeling problem and enables us to build model complexity
gradually.
A binary decision variable, Xy, is defined to indicate whether region ij is served with
29
Xjj = 1 if region ij is served with sewers
= 0 otherwiseSimilarly, another binary decision variable, Ty, is defined to indicate whether a trunk sewer is
built in region ij.
Tjj = 1 if a trunk sewer is built in region ij
= 0 otherwise
Variable Tjj is required because region ij may not be provided with sewers (i.e., Xij=0), but a
trunk sewer may be built through it to transport wastewater downstream (i.e., Tij=l).
Recall that the planning objective is to maximize net revenues. Net revenues for any region ij are revenues less street sewer costs less trunk sewer costs. Multiplying them by Xj; ensures that net revenues are counted only when a region is served with sewers. Therefore, the objective
function can be represented as
Maximize ^ [Rij - Sij - Cij pCj
>j
where Rj; = Total revenues collected from region ij
Sij = Cost of street sewers in region ij
Cjj = Cost of trunk sewer in region ij
This objective function involves a problem which may be best explained through an
example. Suppose that only region 12 of Figure 3.3 is provided sewers. Trunk sewers would be needed not only in region 12 but also in its connecting downstream regions (23, 36, and 67). Although trunk sewers are built in four regions, the objective function above does not account for
their costs since the values of Xy would be zero for regions 23, 36, and 67. Hence the objective
function must be modified as in Eq. (3.1).
Maximize JI [(^J-Su)Xij-CijTij] Eq. (3.1)
y
The first term above indicates that if sewers are built in region ij (i.e., Xy = 1), then the region
30
trunk sewer is built in a region ij (i e., Tj; = 1), its cost must be incurred. Referring to the above
example, the objective function in Eq. (3.1) accounts for (i) revenues less street sewer costs for
region 12, and (ii) trunk sewer costs for regions 12, 23, 36, and 67.
The following constraints are needed to complete the model.
1. If a region ij is served with street sewers, then a trunk sewer through that region is needed.
i;. > Xij for all ij Eq. (3.2)
This constraint requires building a trunk sewer in region ij when the region is provided with
sewers. Mathematically, when Xjj = 1, Eq.(3.2) requires Tjj > 1. This result combined with an
upper bound of 1 (see below), yields Ty = 1. The constraint allows for the possibility of building
a trunk sewer in a region even if the region does not receive sewers.
2. If a trunk sewer is built in region ij, then another trunk sewer should be built in one of its
immediate downstream regions.
2; Tjk > i;^ for all ij Eq. (3.3)
keDj
where D; is the set of downstream adjacent nodes connected to node j. When trunk sewer is
pre-decided as in the case of Figure 3.3, then D; contains only one node. For example, if a trunk
sewer is buih in region 12, then a trunk sewer must be built in region 23. To be able to write this
type of constraint for region 67, an additional downstream region is necessary. This is made
possible by creating a fictitious region 78 and connecting it to node 7.
3. Both Xy and Tj; are binary variables
Xij = Oorl for all ij Eq. (3.4)
Ty =Oorl for all ij Eq. (3.5)
Equations (3.1) to (3.5) constitute the optimization model for the case where trunk sewer
31
programming problem. However, the following shows that Xy and Ty will be either 1 or 0 even if
they are treated as continuous variables and the problem can be solved by linear programming.
0 < Xij < 1 for all ij Eq. (3.6)
0 < T^j < 1 for all ij Eq. (3.7)
Since the model aims to maximize the objective function, it will assign the highest and lowest values to the variables in the objective function with positive and negative coefficients,
respectively, while satisfying the constraints. For any region ij, since Ty has a negative objective
function coefficient, the model wants to assign zero to it to the extent possible.
For a region ij, Xy can have either a positive or negative coefficient in the objective
function (Ry-Sy) depending on the net value of revenues less street sewer costs. If this value is
negative, then Xy would be zero, since such assignment does not violate the constraints. On the
other hand, if the value is positive, sewers would be provided, but only under certain conditions
explained below.
A small increase in Xy, say 5, adds to the value of the objective function by (Ry-Sy) times
5. As a response, however, the constraint specified in Eq. (3.2) demands an increase in the Ty
value to a minimum of 5. With an increase in the Ty value, another constraint defined by Eq.
(3.3) forces downstream regions of ij to provide trunk sewers of 5 quantity, if not existing
already, to the treatment plant. Therefore, a 5 increase in Xy would affect the objective function
value three different ways, by : (i) increases equal to revenues less street sewer costs, (ii)decreases for the cost of the trunk sewer in region ij, and (iii) decreases for the cost of transporting wastewater from the downstream node of region ij to the treatment plant, as
summarized in the following expression.
6 [(Rij-Sy) - Cy - Vy ]
where Cy = Cost of building trunk sewers in region ij
Vy = Cost of transporting wastewater from the downstream node of region ij to the
32
A positive value for the above expression indicates that the objective function would
further improve with an increase in the value of Xy and vice versa. Hence, defining Xy as a
continuous variable with its upper bound value as 1 would allow Xjj to accept a value of unity if
the above expression is positive or 0 if the value is negative. Hence, Xjj can be treated as
continuous variable, as shown in Eq. (3.6).If Xjj assumes either 1 or 0, then the remaining constraints force either 1 or 0 values for
Tij. Consequently, downstream trunk sewers would be built from region ij to the treatment plant
to satisfy the constraint in Eq. (3.3). If Xy = 0, then Tjj would also be zero unless otherwise
required by Eq. (3.3). Hence, the binary constraints (Equations 3.4 and 3.5) can be replaced with
linear constraints (Equations 3.6 and 3.7) that define Xjj and Tjj as non negative continuous
variables with an upper bound of 1. With such replacement, since (i) the model is linear in all the
constraints and objective function, and (ii) all the decision variables are continuous, LP technique
can be used to get the optimal solution. The complete model is summarized below.
Maximize J][Rij-Sij]Xj-GjTij Eq. (3.1)
TV > Xij fbrallij Eq.(3.2)
^ Tjk > i;. for all ij Eq.(3.3)
k£Dj
0 < Xy < 1 for all ij Eq. (3.6)
0 < T^j < 1 for all ij Eq. (3.7)
Unknown Trunk Sewer Cost
In this section, the cost of trunk sewers is assumed to depend on capacity which further
depends upon the upstream regions that contribute wastewater and how the trunk sewer is routed.
Typically, trunk sewers depict economies of scale with respect to capacity. The literature offers
two relevant cost equations: (i) a fixed charge function, and (ii) a power fianction. This report
33
to its linearity provides easier solution of optimization models than those required if a power
function is used. The assumed fixed charge trunk sewer cost function is as follows.
C^IV =a,l^ +AjQ« Eq.(3.8)
Where ajj = Set-up cost for region ij
Py = Marginal cost for region ij
Qij = Required trunk sewer capacity in region ij
The term on the left hand side of Eq. (3.8) represents trunk sewer costs for region ij: Set-up cost,
the first term on the right-hand side, is incurred when region ij receives a trunk sewer. The
second term represents variable costs, which depends on trunk sewer capacity.
Substituting the right hand side of Eq. (3.8) for the Cij Tij term in Eq. (3.1) results in the
objective function, shown in Eq. (3.9), which treats trunk sewer costs endogenously.
Maximize ^^{[Rij-Sij] Xy- a^^ 1;^ -y^^j Qy} Eq. (3.9)
ij
In addition to the constraints of the earlier model (Eq. 3.2, 3.3, 3.6, and 3.7), the new model
requires the following:
1. Flow continuity : The quantity of wastewater carried by trunk sewer ij, Qy, is the sum of the
wastewater contributed by adjacent upstream regions and the wastewater from region ij. Mathematically,Qij = Z Qhi + qy X, for all ij Eq. (3.10)
heUi
where Ui = the set of upstream adjacent nodes connected to node i, and
qjj = wastewater generated within region ij
Note that if sewers are not built in ij, then Xy = 0 and the second term is zero.
2. The set up cost should be incurred if trunk sewer capacity Q\\ is provided in region ij.
34
where M is a very large number. If Qj; > 0, then Tjj > a positive quantity as defined by Qjj/M.
This result when coupled with the condition that Tjj would be either 0 or 1 requires Tjj = 1.
Notice from the objective function that when Tjj =1, the set up cost would be incurred. In
summary, if Qij > 0 then the set up cost would be incurred. If Qjj = 0, then Tjj > 0. However,
considering the negative coefficient for Tjj in the objective function, Tjj would be zero. That is set
up costs will not be incurred when trunk sewer capacity is zero. For mathematical convenience, Eq.(3.11) is rearranged as follows:
Qij < MTij for all ij Eq. (3.11)
3. Non-negativity constraint for Qjj:
Q-- > 0 for all ij Eq. (3.12)
The complete model is shown below.
Maximize J^ {[R^ - Sij ] X-^ - a,^ i;. -j3,^ Q.j} Eq. (3.9)
T^ ^X, for all ij Eq. (3.2)
IceDj
for all ij Eq.(3.3)
Q, = Z Qh. + Qu X,
heUi
for all ij Eq. (3.10)
Qij < MTij for all ij Eq.(3.11)
0 < X, < 1 for all ij Eq. (3.6)
0 < i;^ < 1 for all ij Eq.(3.7)
Q, ^ 0 for all ij Eq. (3.12)
Since the objective function and the constraints are linear and the decision