Improving Accuracy of
Intrusion Detection Model
Using PCA and Optimized SVM
Sumaiya Thaseen Ikram
1and Aswani Kumar Cherukuri
2 1School of Computing Science and Engineering, VIT University, Chennai, Tamil Nadu, India 2School of Information Technology and Engineering, VIT University, Vellore, Tamil Nadu, IndiaExtended version of the paper “Intrusion Detection Model Using Fusion of PCA and Optimized SVM” previously presented at International Conference on Computing and Informatics (IC3I), held on November 27–29, 2014, in Mysore, India.
Intrusion detection is very essential for providing se-curity to different network domains and is mostly used for locating and tracing the intruders. There are many problems with traditional intrusion detection models (IDS) such as low detection capability against un-known network attack, high false alarm rate and insuf-ficient analysis capability. Hence the major scope of the research in this domain is to develop an intrusion detection model with improved accuracy and reduced training time. This paper proposes a hybrid intrusion detection model by integrating the principal com-ponent analysis (PCA) and support vector machine (SVM). The novelty of the paper is the optimization of kernel parameters of the SVM classifier using au-tomatic parameter selection technique. This technique
optimizes the punishment factor (C) and kernel
param-eter gamma (γ), thereby improving the accuracy of the
classifier and reducing the training and testing time. The experimental results obtained on the NSL-KDD and gurekddcup dataset show that the proposed tech-nique performs better with higher accuracy, faster con-vergence speed and better generalization. Minimum resources are consumed as the classifier input requires reduced feature set for optimum classification. A com-parative analysis of hybrid models with the proposed model is also performed.
ACM CCS (2012) Classification: Security and privacy → Intrusion/anomaly detection and malware mitiga-tion → Intrusion detecmitiga-tion systems
Keywords: cross validation, dimensionality reduction, intrusion detection system, principal component anal-ysis, radial basis function kernel, support vector ma-chine
1. Introduction
Intrusion Detection Systems (IDS) are devel-oped to identify unauthorized attempts to ac-cess or manipulate the computer systems. IDS collects network data to identify different kinds of malware and attacks against services and applications. IDS has been classified into two major categories, namely signature based de-tection and anomaly based dede-tection. In signa-ture based IDS, attack pattern of intruders are modeled and the system will notify once the match is identified. All known attacks are iden-tified with reduced false positive rate. Signature databases have to be updated frequently so as to identify the new attack pattern. However, anomaly detection systems create a profile of normal activity. Any pattern that deviates from the normal profile is treated as an anomaly. Hence even unknown attack patterns are identi-fied without any manual intervention.
have improved the performance of the models that deploy such algorithms. In classification, the features of newly present objects are exam-ined and are assigned to one of the existing set of classes. Classifier models gain knowledge from the training data and identify the class label for the new instances. Many supervised learning models are used to solve classification problems.
Support Vector Machine (SVM) is one of the efficient techniques used as the generalization capability is higher even when the sample train-ing data is small. In the recent years, many hy-brid intelligent systems have been proposed to improve the accuracy in comparison to individ-ual techniques.
Anomaly detection models have the difficulty of “curse of dimensionality” which is a very important issue. To overcome this issue, an op-timal feature subset has to be obtained to im-prove accuracy and remove noise. In the pro-posed model, a SVM classifier is combined with PCA for identifying the anomalies. PCA is one of the extensively used statistical techniques to reduce the dimensionality and SVM has the ad-vantage of achieving fine performance for the classification of abnormal patterns.
The remainder of the paper is organized as follows: Section 2 discusses various machine learning techniques, SVM techniques used in various intrusion detection models and recent hybrid techniques developed integrating SVM and dimensionality reduction. The background of various techniques used in the model is dis-cussed in Section 3.The proposed methodology is discussed in Section 4. The experiments and results of the model are reported in Section 5. Section 6 contains the conclusion.
2. Related Work
In this subdivision, we analyze the literature about traditional intrusion detection models, intrusion models using machine learning tech-niques, intrusion models using SVM classifiers and integrated intrusion models using SVM and dimensionality reduction techniques.
Mahoney and Chan [6] developed an Applica-tion Layer Anomaly Detector that considers low level traffic features and payload for
identify-ing the anomalies. Mahoney and Chan [7] also proposed learning rules for anomaly detection which learns the rules by considering network traffic rather than employing a predetermined set of rules. The system is unique because of the following aspects: the model uses a large num-ber of attributes in addition to user behavior. The system is non stationary in nature, which specifies that the time event is significant but frequency is not. The model efficiently deter-mines less number of rules with huge possibil-ities. The limitation of the model is that it has not been tested on a live environment and it is understood that no attack traffic is present in the training set. This would not be applicable in a real time environment.
Weijun [8] employed SVM with normalization for intrusion detection. Min-Max normalization method was chosen as it produces better perfor-mance, cross validation accuracy and increased number of support vectors. The authors indicate that normalization is a crucial stage in prepro-cessing to reduce calculation time and improve the performance of a classifier. SVM without normalization will increase calculation time and results in many support vectors. Carlos et al. [9] used autonomous labeling approach for normal traffic to deal with imbalance of class distribution which is not appropriate for SVM. The major advantage of this technique is that, under some attack distributions, it has superior results over SNORT [10].
Aswani [11] analyzed different dimensionality reduction techniques in the preprocessing stage. Some of the supervised techniques analyzed are Linear Discriminant Analysis (LDA), Max-imum Margin Criterion (MMC) and Orthogo-nal Centroid (OC). Unsupervised approaches such as singular value decomposition (SVD) assign original data to a new dimension with-out considering label information. Sumaiya and Aswani Kumar [12] analyzed various unsuper-vised tree based classifiers for intrusion detec-tion system wherein different classifier models along with feature selection resulted in an op-timized record set that determined normal or anomaly type of the packet.
Kuang et al. [13] integrated Kernel Principal Component Analysis (KPCA) and Support Vector Machine (SVM) for intrusion detec-tion. Multi-layer classifier model is employed
to determine if any action results in attack. The classification accuracy of the proposed model is superior to the models employing SVM clas-sifiers where parameters are randomly selected and hence better generalization performance. KPCA can investigate higher order original in-put information and obtains large quantity of principal components. Sumaiya and Aswani Kumar [14] [15] [16] integrated various feature selection techniques along with SVM to build a hybrid intrusion detection model which had a better accuracy and reduced false alarm rate. Srinoy [4] employed particle swarm optimiza-tion (PSO) to extract intrusion features and classify using SVM. Horng et al. [17] integrated hierarchical clustering along with SVM to pro-vide few abstracted and high quality training instances. This model reduces training time and improves the performance.
Sandhya et al. [18] developed a hierarchical hybrid intelligent system model integrating de-cision tree, support vector machines and an en-semble of various base classifiers. The hybrid model maximized the detection accuracy and reduced the complexity of computations. The major advantage of the ensemble approach is the fact that information from different classifi-ers is merged to decide whether an intrusion has occurred or not. The effectiveness of the model is based on the diverse nature of the base clas-sifiers. Eskin [19] designed an unsupervised anomaly detection model and implemented it using three unsupervised techniques such as clustering, k-nearest neighbor and Support Vec-tor Machine. The advantage of these algorithms is that they can be applied to any feature space to model diverse kinds of data. The model can be extended to more feature maps with various kinds of data and perform widespread experi-ments on the data. Li et al. [20] proposed an efficient intrusion detection method combining clustering, ant colony algorithm and SVM that resulted in an efficient model that determined whether a network data packet is classified as normal or abnormal. However, the model had a strategy of selecting a small training data set which may not be suitable to multiple classifi-cation problems. Bhavesh et al. [21] developed a hybrid technique to identify anomalies by integrating Latent Dirichlet Allocation (LDA) and genetic algorithm (GA). LDA determines the subset of attributes for anomaly
identifi-cation. GA module computes the initial score of samples and breeding. It then evaluates the fitness criteria to construct a new generation. The hybrid technique was applied on a generic data set which resulted in reduction in accuracy, but if the model had been trained with specific anomaly dataset, then the accuracy could have been higher. Shih et al. [22] constructed an in-telligent intrusion detection model wherein the goal was to combine SVM, Decision Tree (DT) and Simulated Annealing (SA). SVM and SA techniques can identify the optimal selected features to improve the accuracy level of intru-sion detection. The best parameters for both DT and SVM are tuned without human intervention by SA. The intelligent technique can efficiently discover attacks with their appropriate types. Liu et al. [23] built an anomaly model which performed feature selection by PCA and clas-sification by neural networks. Only 22 features were extracted from the 38 feature set. Principal components selected were based on the highest eigenvalues. This technique minimized the total number of features and increased the detection rate. However, the approach of selecting the principal components is not globally optimal as a certain subset of principal components are only investigated. The increased generalization performance of PCA is obtained with the trade--off of large amount of computation time. Han et al. [24] investigated the effective nature of SVM by identifying masquerade behavior us-ing various UNIX commands. Experiments re-vealed that SVM is a successful technique for masquerade identification. However, there is a trade-off between variety and efficiency of features analyzed, including session and time information.
sup-have improved the performance of the models that deploy such algorithms. In classification, the features of newly present objects are exam-ined and are assigned to one of the existing set of classes. Classifier models gain knowledge from the training data and identify the class label for the new instances. Many supervised learning models are used to solve classification problems.
Support Vector Machine (SVM) is one of the efficient techniques used as the generalization capability is higher even when the sample train-ing data is small. In the recent years, many hy-brid intelligent systems have been proposed to improve the accuracy in comparison to individ-ual techniques.
Anomaly detection models have the difficulty of “curse of dimensionality” which is a very important issue. To overcome this issue, an op-timal feature subset has to be obtained to im-prove accuracy and remove noise. In the pro-posed model, a SVM classifier is combined with PCA for identifying the anomalies. PCA is one of the extensively used statistical techniques to reduce the dimensionality and SVM has the ad-vantage of achieving fine performance for the classification of abnormal patterns.
The remainder of the paper is organized as follows: Section 2 discusses various machine learning techniques, SVM techniques used in various intrusion detection models and recent hybrid techniques developed integrating SVM and dimensionality reduction. The background of various techniques used in the model is dis-cussed in Section 3.The proposed methodology is discussed in Section 4. The experiments and results of the model are reported in Section 5. Section 6 contains the conclusion.
2. Related Work
In this subdivision, we analyze the literature about traditional intrusion detection models, intrusion models using machine learning tech-niques, intrusion models using SVM classifiers and integrated intrusion models using SVM and dimensionality reduction techniques.
Mahoney and Chan [6] developed an Applica-tion Layer Anomaly Detector that considers low level traffic features and payload for
identify-ing the anomalies. Mahoney and Chan [7] also proposed learning rules for anomaly detection which learns the rules by considering network traffic rather than employing a predetermined set of rules. The system is unique because of the following aspects: the model uses a large num-ber of attributes in addition to user behavior. The system is non stationary in nature, which specifies that the time event is significant but frequency is not. The model efficiently deter-mines less number of rules with huge possibil-ities. The limitation of the model is that it has not been tested on a live environment and it is understood that no attack traffic is present in the training set. This would not be applicable in a real time environment.
Weijun [8] employed SVM with normalization for intrusion detection. Min-Max normalization method was chosen as it produces better perfor-mance, cross validation accuracy and increased number of support vectors. The authors indicate that normalization is a crucial stage in prepro-cessing to reduce calculation time and improve the performance of a classifier. SVM without normalization will increase calculation time and results in many support vectors. Carlos et al. [9] used autonomous labeling approach for normal traffic to deal with imbalance of class distribution which is not appropriate for SVM. The major advantage of this technique is that, under some attack distributions, it has superior results over SNORT [10].
Aswani [11] analyzed different dimensionality reduction techniques in the preprocessing stage. Some of the supervised techniques analyzed are Linear Discriminant Analysis (LDA), Max-imum Margin Criterion (MMC) and Orthogo-nal Centroid (OC). Unsupervised approaches such as singular value decomposition (SVD) assign original data to a new dimension with-out considering label information. Sumaiya and Aswani Kumar [12] analyzed various unsuper-vised tree based classifiers for intrusion detec-tion system wherein different classifier models along with feature selection resulted in an op-timized record set that determined normal or anomaly type of the packet.
Kuang et al. [13] integrated Kernel Principal Component Analysis (KPCA) and Support Vector Machine (SVM) for intrusion detec-tion. Multi-layer classifier model is employed
to determine if any action results in attack. The classification accuracy of the proposed model is superior to the models employing SVM clas-sifiers where parameters are randomly selected and hence better generalization performance. KPCA can investigate higher order original in-put information and obtains large quantity of principal components. Sumaiya and Aswani Kumar [14] [15] [16] integrated various feature selection techniques along with SVM to build a hybrid intrusion detection model which had a better accuracy and reduced false alarm rate. Srinoy [4] employed particle swarm optimiza-tion (PSO) to extract intrusion features and classify using SVM. Horng et al. [17] integrated hierarchical clustering along with SVM to pro-vide few abstracted and high quality training instances. This model reduces training time and improves the performance.
Sandhya et al. [18] developed a hierarchical hybrid intelligent system model integrating de-cision tree, support vector machines and an en-semble of various base classifiers. The hybrid model maximized the detection accuracy and reduced the complexity of computations. The major advantage of the ensemble approach is the fact that information from different classifi-ers is merged to decide whether an intrusion has occurred or not. The effectiveness of the model is based on the diverse nature of the base clas-sifiers. Eskin [19] designed an unsupervised anomaly detection model and implemented it using three unsupervised techniques such as clustering, k-nearest neighbor and Support Vec-tor Machine. The advantage of these algorithms is that they can be applied to any feature space to model diverse kinds of data. The model can be extended to more feature maps with various kinds of data and perform widespread experi-ments on the data. Li et al. [20] proposed an efficient intrusion detection method combining clustering, ant colony algorithm and SVM that resulted in an efficient model that determined whether a network data packet is classified as normal or abnormal. However, the model had a strategy of selecting a small training data set which may not be suitable to multiple classifi-cation problems. Bhavesh et al. [21] developed a hybrid technique to identify anomalies by integrating Latent Dirichlet Allocation (LDA) and genetic algorithm (GA). LDA determines the subset of attributes for anomaly
identifi-cation. GA module computes the initial score of samples and breeding. It then evaluates the fitness criteria to construct a new generation. The hybrid technique was applied on a generic data set which resulted in reduction in accuracy, but if the model had been trained with specific anomaly dataset, then the accuracy could have been higher. Shih et al. [22] constructed an in-telligent intrusion detection model wherein the goal was to combine SVM, Decision Tree (DT) and Simulated Annealing (SA). SVM and SA techniques can identify the optimal selected features to improve the accuracy level of intru-sion detection. The best parameters for both DT and SVM are tuned without human intervention by SA. The intelligent technique can efficiently discover attacks with their appropriate types. Liu et al. [23] built an anomaly model which performed feature selection by PCA and clas-sification by neural networks. Only 22 features were extracted from the 38 feature set. Principal components selected were based on the highest eigenvalues. This technique minimized the total number of features and increased the detection rate. However, the approach of selecting the principal components is not globally optimal as a certain subset of principal components are only investigated. The increased generalization performance of PCA is obtained with the trade--off of large amount of computation time. Han et al. [24] investigated the effective nature of SVM by identifying masquerade behavior us-ing various UNIX commands. Experiments re-vealed that SVM is a successful technique for masquerade identification. However, there is a trade-off between variety and efficiency of features analyzed, including session and time information.
sup-port vector machine as a classifier technique for intrusion detection. The proposed model achieves better results in terms of detection rate and accuracy. John et al. [27] constructed a net-work intrusion detection model by choosing the Extreme Learning Machine (ELM) as the major learning algorithm and integrated it with mul-tiple kernel boosting. The model was named as MARK-ELM. The IDS was tested on sev-eral machine learning datasets including KD-D-Cup-99 datasets and results indicated that the approach works well for majority of the Uni-versity of California, Irvine (UCI) repository datasets. The model performs better with lower detection rates and lower false alarm rates in comparison with other traditional approaches on intrusion detection data. Eduardo et al. [28] developed an intrusion detection model using Principal Component Analysis (PCA) for fea-ture selection and removal of noise and inte-grated it with Self Organizing Map (SOM) to distinguish between normal and anomalous connections. This resulted in faster implemen-tation of intrusion detection models.
Hence, from the literature, it is very clear that most of the intrusion detection systems de-ployed SVM with feature reduction techniques. Therefore, in this paper, we integrate SVM with dimensionality reduction techniques such as PCA for building an intrusion detection model. The novelty of this approach is to optimize the SVM parameters such as kernel parameter (γ) and punishment factor (C) using an automatic parameter selection technique which can im-prove the classification rate and detect the in-trusions in a faster manner.
Any real time application that requires intru-sion detection monitoring can deploy this ap-proach as these systems are able to identify the intruders on the internet whose purpose is to breach the network and make it vulnerable. The proposed model can be deployed as a net-work based intrusion detection model to secure industrial networks and filter out all the intruder traffic trying to enter the network.
3. Background
In this section we briefly review the data min-ing techniques that are employed in our pro-posed model.
3.1 Scaling
Huge volumes of network traffic have to be pro-cessed for identifying the anomalies and hence classification may not be accurate. Therefore, data packets undergo normalization technique wherein data is sanitized. The purpose of nor-malization is to record the data to a diverse scale. Different techniques used for normaliza-tion are Z-score, Decimal and Min-Max scal-ing. The Min-Max normalization technique is chosen for the proposed model as it has less number of misclassification errors [29] com-pared to other techniques. Min-Max normal-ization achieves a linear modification on the original data. Normalization is carried out for a given range. To perform mapping for a value v of a feature f within range [min f , max f ] to a new range [new_min f , new_max f ], the calcu-lation is given by
v' = ( min )(f _ maxmaxf min_ min )f _ minf f f
v− new −new +new
− (1)
where v' is the new value in the specified range. The benefit of this technique is that all values are concealed within certain ranges.
3.2 Principal Component Analysis (PCA)
PCA is one of the broadly used statistical tech-niques in the field of data mining to reduce di-mensionality and to identify data points with the highest possible variance [30] [31]. Lakhina et al. [32] employed PCA to differentiate network traffic data into normal and anomalous sub re-gions. In this method, the focus is on detection of volume based anomalies in origin-destina-tion flow aggregated in backbone networks and it is a vital component within several IDS sys-tems today. The PCA approach identifies anom-alous traffic volume on a particular link by comparing it with past values. Thus, PCA sepa-rates link traffic measurements into sub regions representing normal and abnormal traffic. The outcome of the PCA is to project a feature space onto a smaller subspace that represents data by reducing the dimensions of feature space. This reduces computational costs and the error of pa-rameter estimation.
The standard PCA approach can be summarized in six simple steps:
(i) Determine the covariance matrix of the normalized d-dimensional dataset.
(ii) Determine the eigenvectors and eigenval-ues of the covariance matrix.
(iii) Sort the eigenvalues in descending order. (iv) Select the k eigenvectors that correspond
to the k largest eigenvalues where k is the number of dimensions of the new feature subspace.
(v) Construct the projection matrix from the k selected eigenvectors.
(vi) Transform the original dataset to build a new k-dimensional feature space.
3.3 Support Vector Machine Classification Model
Support Vector Machines (SVMs) are a set of supervised learning techniques mainly used for classification, outlier detection and regression. The major advantages of SVM are:
● Efficient results in high dimensional spaces
● Helpful wherein the quantity of dimen-sions is higher than the quantity of data samples
● Efficient usage of memory as SVM uses only a subset of training points in the deci-sion making function
● Different kernel functions can be used for the decision function. Common kernels are available, but we can also develop custom kernels [33]
3.3.1 Linear Support Vector Machine
Consider the categorization of two classes that can be separated in a linear fashion as shown in Figure 1 [34]. Figure 1 shows that the hy-perplane for the linear classifier is of the form (w.x + b) = 0 having the maximum margin (both expressions áw,xñ and w.x denote the scalar product of two vectors, i.e. represent the same operation). The classifier is described by the set of pairs (w,b), where w is a weight vector and b is the bias, that can specify the inequality for any sample xi in the training set, while yi
rep-resents the class label:
. 1 if 1
. 1 if ii 1
b y
b y
+ ≥ + = +
+ ≤ − = −
i
i
w x
w x (2)
Here, where w is normalized with respect to a set of points x such that: mini | w.xi| = 1.
Min-imizing || w||2 subject to equation (2) and
rep-resentation of constraints in a compact form are as follows:
) 1
) 1 0
i
i
y b
y b
+ ≥ + + − ≥
i
i
(w.x
(w.x (3)
Figure 1. Linear support vector machine [34].
Every hyperplane (w, b) is a classifier that sep-arates all patterns from the training set.
To deal with non separable case, the problem is rewritten as:
Minimize
2
1
m i i
C
=
+
∑
ξw (4)
(where C is a regularization parameter: small C allows constraints to be easily ignored, large C makes constraints hard to ignore) with respect to
( ) 1 , where 0
i i i
y w.xi+ ≥ − ξb ξ ≥ (5)
Hence the decision function is of the form f(x) = w.x + b (6) The fundamental equation is obtained by
2
1
1
min ( , ) || || ( ( ))
2 i i
port vector machine as a classifier technique for intrusion detection. The proposed model achieves better results in terms of detection rate and accuracy. John et al. [27] constructed a net-work intrusion detection model by choosing the Extreme Learning Machine (ELM) as the major learning algorithm and integrated it with mul-tiple kernel boosting. The model was named as MARK-ELM. The IDS was tested on sev-eral machine learning datasets including KD-D-Cup-99 datasets and results indicated that the approach works well for majority of the Uni-versity of California, Irvine (UCI) repository datasets. The model performs better with lower detection rates and lower false alarm rates in comparison with other traditional approaches on intrusion detection data. Eduardo et al. [28] developed an intrusion detection model using Principal Component Analysis (PCA) for fea-ture selection and removal of noise and inte-grated it with Self Organizing Map (SOM) to distinguish between normal and anomalous connections. This resulted in faster implemen-tation of intrusion detection models.
Hence, from the literature, it is very clear that most of the intrusion detection systems de-ployed SVM with feature reduction techniques. Therefore, in this paper, we integrate SVM with dimensionality reduction techniques such as PCA for building an intrusion detection model. The novelty of this approach is to optimize the SVM parameters such as kernel parameter (γ) and punishment factor (C) using an automatic parameter selection technique which can im-prove the classification rate and detect the in-trusions in a faster manner.
Any real time application that requires intru-sion detection monitoring can deploy this ap-proach as these systems are able to identify the intruders on the internet whose purpose is to breach the network and make it vulnerable. The proposed model can be deployed as a net-work based intrusion detection model to secure industrial networks and filter out all the intruder traffic trying to enter the network.
3. Background
In this section we briefly review the data min-ing techniques that are employed in our pro-posed model.
3.1 Scaling
Huge volumes of network traffic have to be pro-cessed for identifying the anomalies and hence classification may not be accurate. Therefore, data packets undergo normalization technique wherein data is sanitized. The purpose of nor-malization is to record the data to a diverse scale. Different techniques used for normaliza-tion are Z-score, Decimal and Min-Max scal-ing. The Min-Max normalization technique is chosen for the proposed model as it has less number of misclassification errors [29] com-pared to other techniques. Min-Max normal-ization achieves a linear modification on the original data. Normalization is carried out for a given range. To perform mapping for a value v of a feature f within range [min f , max f ] to a new range [new_min f , new_max f ], the calcu-lation is given by
v' = ( min )(f _ maxmaxf min_ min )f _ minf f f
v− new −new +new
− (1)
where v' is the new value in the specified range. The benefit of this technique is that all values are concealed within certain ranges.
3.2 Principal Component Analysis (PCA)
PCA is one of the broadly used statistical tech-niques in the field of data mining to reduce di-mensionality and to identify data points with the highest possible variance [30] [31]. Lakhina et al. [32] employed PCA to differentiate network traffic data into normal and anomalous sub re-gions. In this method, the focus is on detection of volume based anomalies in origin-destina-tion flow aggregated in backbone networks and it is a vital component within several IDS sys-tems today. The PCA approach identifies anom-alous traffic volume on a particular link by comparing it with past values. Thus, PCA sepa-rates link traffic measurements into sub regions representing normal and abnormal traffic. The outcome of the PCA is to project a feature space onto a smaller subspace that represents data by reducing the dimensions of feature space. This reduces computational costs and the error of pa-rameter estimation.
The standard PCA approach can be summarized in six simple steps:
(i) Determine the covariance matrix of the normalized d-dimensional dataset.
(ii) Determine the eigenvectors and eigenval-ues of the covariance matrix.
(iii) Sort the eigenvalues in descending order. (iv) Select the k eigenvectors that correspond
to the k largest eigenvalues where k is the number of dimensions of the new feature subspace.
(v) Construct the projection matrix from the k selected eigenvectors.
(vi) Transform the original dataset to build a new k-dimensional feature space.
3.3 Support Vector Machine Classification Model
Support Vector Machines (SVMs) are a set of supervised learning techniques mainly used for classification, outlier detection and regression. The major advantages of SVM are:
● Efficient results in high dimensional spaces
● Helpful wherein the quantity of dimen-sions is higher than the quantity of data samples
● Efficient usage of memory as SVM uses only a subset of training points in the deci-sion making function
● Different kernel functions can be used for the decision function. Common kernels are available, but we can also develop custom kernels [33]
3.3.1 Linear Support Vector Machine
Consider the categorization of two classes that can be separated in a linear fashion as shown in Figure 1 [34]. Figure 1 shows that the hy-perplane for the linear classifier is of the form (w.x + b) = 0 having the maximum margin (both expressions áw,xñ and w.x denote the scalar product of two vectors, i.e. represent the same operation). The classifier is described by the set of pairs (w,b), where w is a weight vector and b is the bias, that can specify the inequality for any sample xi in the training set, while yi
rep-resents the class label:
. 1 if 1
. 1 if ii 1
b y
b y
+ ≥ + = +
+ ≤ − = −
i
i
w x
w x (2)
Here, where w is normalized with respect to a set of points x such that: mini | w.xi| = 1.
Min-imizing || w||2 subject to equation (2) and
rep-resentation of constraints in a compact form are as follows:
) 1
) 1 0
i
i
y b
y b
+ ≥ + + − ≥
i
i
(w.x
(w.x (3)
Figure 1. Linear support vector machine [34].
Every hyperplane (w, b) is a classifier that sep-arates all patterns from the training set.
To deal with non separable case, the problem is rewritten as:
Minimize
2
1
m i i
C
=
+
∑
ξw (4)
(where C is a regularization parameter: small C allows constraints to be easily ignored, large C makes constraints hard to ignore) with respect to
( ) 1 , where 0
i i i
y w.xi+ ≥ − ξb ξ ≥ (5)
Hence the decision function is of the form f(x) = w.x + b (6) The fundamental equation is obtained by
2
1
1
min ( , ) || || ( ( ))
2 i i
where P(w,b) represents the primal formulation to minimize the training error, and H1 would
identify the number of errors.
3.3.2 Non-linear Support Vector Machine Linear classifers are not complex. The prepro-cessing of data is done with:
x → Φ(x)
Then it changes to the form Φ(x) to y:
f(x) = w.Φ(x) + b (8)
The dimension of Φ(x) can be very large. Thus
w will be hard to represent precisely in memory space and also difficult to solve the quadratic problem.
The theorem shows that
1 ( )
m i i
α
=
=
∑
Φ iw x (9)
We can optimize α (which represents the lagrange multiplier) directly instead of optimizing w. The decision rule is modified as:
1
( ) m i ( ). ( ) i
f α b
=
=
∑
Φ i Φ +x x x (10)
We specify the term K(xi,x) = Φ(xi).Φ(x) as the
kernel function.
We can rewrite all SVM equations with equa-tion (9).
Hence the decision function becomes ( ) i ( ). ( )
i
f x =
∑
α Φ xi Φ x +b(11) K( , )
i i
b
α
=
∑
x xi +(12) The dual formulation is obtained by:
2
1
1
1
min ( , ) || ( )) || 2
[ ( )]
m i i
i i
P b
C H y f
α
=
= Φ
+
∑
∑
i
i
w x
x (13) where P(w,b) represents the primal formulation to minimize the training error of the SVM. Kernel function K(. , .) is used to build implicit non linear feature map,
(i) Polynomial Kernel: K(x, xi) = (x.xi + 1)d
(ii) RBF Kernel: K(x, xi) = exp (– γ ||x – xi ||2)
3.3.3 RBF – SVMs
The RBF Kernel K(x, xi) = exp (– γ ||x – xi ||2)
is one of the most widely used kernel functions.
2
1
( ) m iexp( || || )
i
f α b
=
=
∑
−γ i − +x x x (14)
where || xi – x ||2 is the squared Euclidean
dis-tance between two vectors and σ is an unre -stricted parameter. It is defined as
2
1 2
= γ
σ
3.4 Cross Validation
Cross validation is a model evaluation technique that uses a partial data set for training which will be used by the learner. Certain records are removed before the training begins. The data already removed is used as a test set to measure performance of the model on the new data. In K-fold cross validation, the data set is di-vided into k subsets. In every iteration, one of the k subsets is considered as the test set and the other k – l subsets are considered as the train-ing set. The advantage of this method is that the data point will be in the test set at least once and in the training set k – l times.
4. Proposed Work
In this section we propose a novel hybrid model for intrusion identification.
4.1 Proposed Methodology
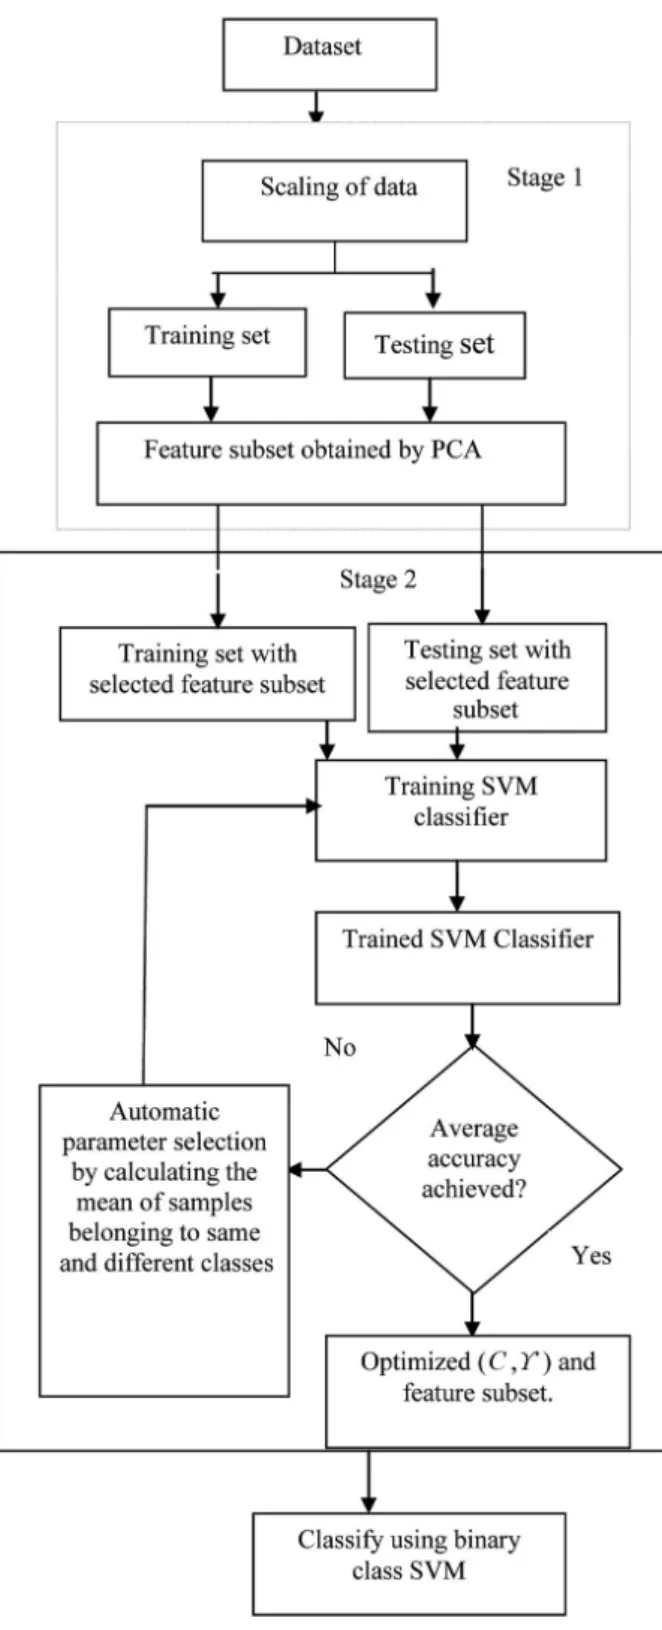
The proposed model integrates PCA with SVM for classification of anomalies in the net-work traffic. The SVM parameters such as the punishment factor (C) and kernel parameter gamma (γ) are optimized to obtain higher lev-els of accuracy. Figure 2 illustrates the block diagram of the proposed system. The proposed approach employs two stages: In the first stage, PCA finds an optimal subset of all attributes by removing noisy information from attributes
that contain it. Variance threshold is usually set to a higher value so that the cumulative vari-ance of the various principal components falls above the threshold and can be selected to form the feature vectors. The second stage uses the optimal subset obtained from PCA as training data set and test data set for SVM to perform classification. RBF kernel is adopted in this
model and the optimal parameters of SVM are obtained using grid search with automatic pa-rameter selection as depicted in Figure 3.
Figure 3. Optimization of SVM parameters using automatic parameter selection technique.
An initial set of C and ϒ values are specified in the objective function to check whether the parameter combination converges to a best op-timal subset. If the subset converges, then the parameter combination is retained; otherwise, the process is repeated to obtain a best optimal subset value.
In the next section, we discuss the methodology for obtaining the optimal subset from PCA and optimization performed to obtain the optimal SVM kernel parameters for classification. 4.2 Preprocessing of Dataset
where P(w,b) represents the primal formulation to minimize the training error, and H1 would
identify the number of errors.
3.3.2 Non-linear Support Vector Machine Linear classifers are not complex. The prepro-cessing of data is done with:
x → Φ(x)
Then it changes to the form Φ(x) to y:
f(x) = w.Φ(x) + b (8)
The dimension of Φ(x) can be very large. Thus
w will be hard to represent precisely in memory space and also difficult to solve the quadratic problem.
The theorem shows that
1 ( )
m i i
α
=
=
∑
Φ iw x (9)
We can optimize α (which represents the lagrange multiplier) directly instead of optimizing w. The decision rule is modified as:
1
( ) m i ( ). ( ) i
f α b
=
=
∑
Φ i Φ +x x x (10)
We specify the term K(xi,x) = Φ(xi).Φ(x) as the
kernel function.
We can rewrite all SVM equations with equa-tion (9).
Hence the decision function becomes ( ) i ( ). ( )
i
f x =
∑
α Φ xi Φ x +b(11) K( , )
i i
b
α
=
∑
x xi +(12) The dual formulation is obtained by:
2
1
1
1
min ( , ) || ( )) || 2
[ ( )]
m i i
i i
P b
C H y f
α
=
= Φ
+
∑
∑
i
i
w x
x (13) where P(w,b) represents the primal formulation to minimize the training error of the SVM. Kernel function K(. , .) is used to build implicit non linear feature map,
(i) Polynomial Kernel: K(x, xi) = (x.xi + 1)d
(ii) RBF Kernel: K(x, xi) = exp (– γ ||x – xi ||2)
3.3.3 RBF – SVMs
The RBF Kernel K(x, xi) = exp (– γ ||x – xi ||2)
is one of the most widely used kernel functions.
2
1
( ) m iexp( || || )
i
f α b
=
=
∑
−γ i − +x x x (14)
where || xi – x ||2 is the squared Euclidean
dis-tance between two vectors and σ is an unre -stricted parameter. It is defined as
2
1 2
= γ
σ
3.4 Cross Validation
Cross validation is a model evaluation technique that uses a partial data set for training which will be used by the learner. Certain records are removed before the training begins. The data already removed is used as a test set to measure performance of the model on the new data. In K-fold cross validation, the data set is di-vided into k subsets. In every iteration, one of the k subsets is considered as the test set and the other k – l subsets are considered as the train-ing set. The advantage of this method is that the data point will be in the test set at least once and in the training set k – l times.
4. Proposed Work
In this section we propose a novel hybrid model for intrusion identification.
4.1 Proposed Methodology
The proposed model integrates PCA with SVM for classification of anomalies in the net-work traffic. The SVM parameters such as the punishment factor (C) and kernel parameter gamma (γ) are optimized to obtain higher lev-els of accuracy. Figure 2 illustrates the block diagram of the proposed system. The proposed approach employs two stages: In the first stage, PCA finds an optimal subset of all attributes by removing noisy information from attributes
that contain it. Variance threshold is usually set to a higher value so that the cumulative vari-ance of the various principal components falls above the threshold and can be selected to form the feature vectors. The second stage uses the optimal subset obtained from PCA as training data set and test data set for SVM to perform classification. RBF kernel is adopted in this
model and the optimal parameters of SVM are obtained using grid search with automatic pa-rameter selection as depicted in Figure 3.
Figure 3. Optimization of SVM parameters using automatic parameter selection technique.
An initial set of C and ϒ values are specified in the objective function to check whether the parameter combination converges to a best op-timal subset. If the subset converges, then the parameter combination is retained; otherwise, the process is repeated to obtain a best optimal subset value.
In the next section, we discuss the methodology for obtaining the optimal subset from PCA and optimization performed to obtain the optimal SVM kernel parameters for classification. 4.2 Preprocessing of Dataset
41 attributes wherein 34 attributes are continu-ous and 7 attributes are discrete in nature. Pre-processing is performed on the dataset and then the data is divided into training and test sets.
4.3 Principal Component Analysis
Figure 4 shows the step by step analysis of fea-ture vector generation using PCA. A normal-ized feature matrix is obtained after preprocess-ing and is fed as input to obtain the mean and covariance of the individual features. Eigen-vectors are generated for every feature and the highest eigenvalues and respective eigenvec-tors are retained (in the vector set) to obtain the optimal feature subset.
Algorithm for obtaining the optimal feature subset using PCA
_________________________________________ Input (Training Set, Test Set)
Output (Optimal Training Set, Optimal Test Set) Step 1: Determine the size of training and test data. Step 2: Scale the training and test data.
Step 3: Subtract from each feature x its respective mean m
1
n k k
x m
n = =
∑
wherein xk specifies the individual element of x and
n denotes the number of elements.
Step 4: Determine the covariance matrix C
( ) ( )m Tm
n =X X C
where X(m) represents the feature matrix after
sub-tracting the respective means, XT( )m is the transpose
matrix, and n is the total number of elements. Step 5: Determine the eigenvectors vj and
eigenval-ues λjof the covariance matrix C
Cvj = λj vj j= 1,..., p, p≤n
Step 6: Obtain a feature vector using a set of eigen-values (λ1, λ2 … λp) and respective eigenvectors,
where λ1 is the highest eigenvalue. Select k such
eigenvectors that match the largest k eigenvalues in the set.
_________________________________________
Algorithm for obtaining the optimal kernel parame-ters of SVM and classification of network data
_________________________________________ Input (C, ϒ, Training set, Test set)
Output (Optimized C, ϒ, predicted test label, accu-racy)
Step 1: Specify an objective metric for calculating score using mean of the attribute values.
Step 2: Build composite estimators whose parame-ter space can be searched.
Step 3: Evaluate the parameter settings after com-puting an objective function on the parameter C and
ϒ. If the objective function converges, then that pa-rameter combination is selected.
Step 4: Train the SVM classifier with optimized C
and ϒ.
Step 5: Predict the test data label.
Step 6: Determine the performance metrics using the equations (15), (16) and (17).
_________________________________________
The computational complexity of the support
vector machine is 2
features samples
( )
O n ⋅n where n
is the number of data elements.
4.5. Optimization of SVM Parameters
The SVM parameters possibly in the kernel can have a major influence on the outcome of the training and misclassification and hence it is very natural that these have to be fine-tuned to improve performance. The basic approach is to control the punishment factor penalty weight (C) and also to identify the best trade-off be-tween misclassification errors and generaliza-tion. A higher value of C leads to hard margin SVM behavior whereas lower value of C in-creases misclassifications. When using kernel other than linear kernel, there might be some tunable parameters. The most common strategy is to use a Radial Basis Function (RBF) kernel and perform optimization on gamma parameter (ϒ) along with C.
As cross validation is very time consuming, the major parameters C and ϒ of RBF kernel of SVM are optimized by a method that includes searching or sampling candidate parameters and calculating a score function. If the score func-tion is higher than the threshold limit, then the parameter combination is selected as the best combination for usage in the SVM classifier. This method is similar to grid search wherein we choose a starting point x and a step size s. The computational complexity of the PCA is
O(p2n + p3) p is the number of features and n
is the number of data points. Covariance matrix computation is O(p2n) and the corresponding
eigenvalue decomposition is O(p3).
Figure 4. Optimal feature subset generation using PCA.
4.4. Support Vector Machines
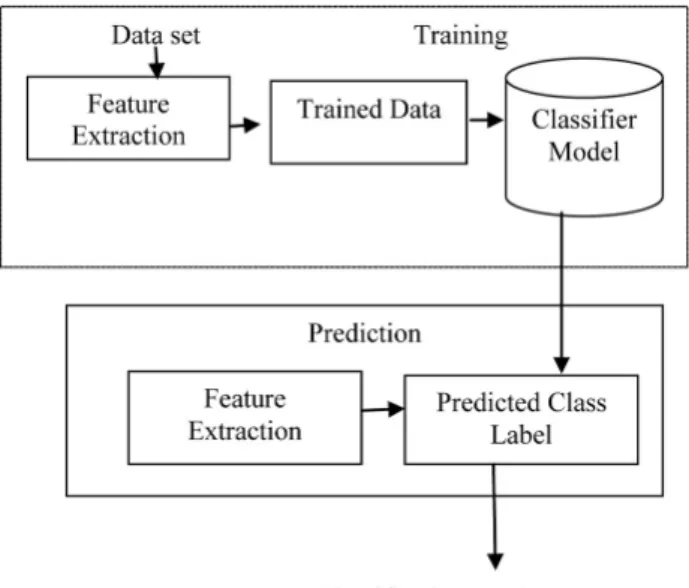
Figure 5 shows the stages of SVM classifier for predicting the class label of the network traffic. The stages are divided into two phases: Train-ing and prediction. In trainTrain-ing phase, the feature matrix is fed in to the classifier model to iden-tify the class label. The testing phase obtains the learning rules from training phase to iden-tify the pattern of the unknown traffic.
Figure 5. Predicting the class label using support vector machine.
Then the optimal parameters are deployed in training the model. This parameter optimization avoids misclassification of training sample.
5. Experiments
5.1. Experimental Setup
5.1.1. Datasets
The standard datasets used for intrusion detec-tion are deployed in the proposed model which are the variants of the KDD-Cup-99 data set namely NSL-KDD data set containing 33,300 samples and 10% of gurekddcup data set con-taining 1,78,810 records. A description of NSL-KDD cup data set and gurekddcup datasets can be obtained from [17] and [32]. NSL-KDD data-set is chosen because of the following advan-tages: i) It does not include redundant records in the training set, hence the classifiers will not be biased towards frequent records. This results in a better detection rate. ii) The number of se-lected records from each group is inverse to the number of records in the dataset. iii) Significant reduction in the redundancy of data records al-lows the experiments to run on the complete set of training and testing data without selecting a random sample data set.
41 attributes wherein 34 attributes are continu-ous and 7 attributes are discrete in nature. Pre-processing is performed on the dataset and then the data is divided into training and test sets.
4.3 Principal Component Analysis
Figure 4 shows the step by step analysis of fea-ture vector generation using PCA. A normal-ized feature matrix is obtained after preprocess-ing and is fed as input to obtain the mean and covariance of the individual features. Eigen-vectors are generated for every feature and the highest eigenvalues and respective eigenvec-tors are retained (in the vector set) to obtain the optimal feature subset.
Algorithm for obtaining the optimal feature subset using PCA
_________________________________________ Input (Training Set, Test Set)
Output (Optimal Training Set, Optimal Test Set) Step 1: Determine the size of training and test data. Step 2: Scale the training and test data.
Step 3: Subtract from each feature x its respective mean m
1
n k k
x m
n = =
∑
wherein xk specifies the individual element of x and
n denotes the number of elements.
Step 4: Determine the covariance matrix C
( ) ( )m Tm
n =X X C
where X(m) represents the feature matrix after
sub-tracting the respective means, XT( )m is the transpose
matrix, and n is the total number of elements. Step 5: Determine the eigenvectors vj and
eigenval-ues λjof the covariance matrix C
Cvj = λj vj j= 1,..., p, p≤n
Step 6: Obtain a feature vector using a set of eigen-values (λ1, λ2 … λp) and respective eigenvectors,
where λ1 is the highest eigenvalue. Select k such
eigenvectors that match the largest k eigenvalues in the set.
_________________________________________
Algorithm for obtaining the optimal kernel parame-ters of SVM and classification of network data
_________________________________________ Input (C, ϒ, Training set, Test set)
Output (Optimized C, ϒ, predicted test label, accu-racy)
Step 1: Specify an objective metric for calculating score using mean of the attribute values.
Step 2: Build composite estimators whose parame-ter space can be searched.
Step 3: Evaluate the parameter settings after com-puting an objective function on the parameter C and
ϒ. If the objective function converges, then that pa-rameter combination is selected.
Step 4: Train the SVM classifier with optimized C
and ϒ.
Step 5: Predict the test data label.
Step 6: Determine the performance metrics using the equations (15), (16) and (17).
_________________________________________
The computational complexity of the support
vector machine is 2
features samples
( )
O n ⋅n where n
is the number of data elements.
4.5. Optimization of SVM Parameters
The SVM parameters possibly in the kernel can have a major influence on the outcome of the training and misclassification and hence it is very natural that these have to be fine-tuned to improve performance. The basic approach is to control the punishment factor penalty weight (C) and also to identify the best trade-off be-tween misclassification errors and generaliza-tion. A higher value of C leads to hard margin SVM behavior whereas lower value of C in-creases misclassifications. When using kernel other than linear kernel, there might be some tunable parameters. The most common strategy is to use a Radial Basis Function (RBF) kernel and perform optimization on gamma parameter (ϒ) along with C.
As cross validation is very time consuming, the major parameters C and ϒ of RBF kernel of SVM are optimized by a method that includes searching or sampling candidate parameters and calculating a score function. If the score func-tion is higher than the threshold limit, then the parameter combination is selected as the best combination for usage in the SVM classifier. This method is similar to grid search wherein we choose a starting point x and a step size s. The computational complexity of the PCA is
O(p2n + p3) p is the number of features and n
is the number of data points. Covariance matrix computation is O(p2n) and the corresponding
eigenvalue decomposition is O(p3).
Figure 4. Optimal feature subset generation using PCA.
4.4. Support Vector Machines
Figure 5 shows the stages of SVM classifier for predicting the class label of the network traffic. The stages are divided into two phases: Train-ing and prediction. In trainTrain-ing phase, the feature matrix is fed in to the classifier model to iden-tify the class label. The testing phase obtains the learning rules from training phase to iden-tify the pattern of the unknown traffic.
Figure 5. Predicting the class label using support vector machine.
Then the optimal parameters are deployed in training the model. This parameter optimization avoids misclassification of training sample.
5. Experiments
5.1. Experimental Setup
5.1.1. Datasets
The standard datasets used for intrusion detec-tion are deployed in the proposed model which are the variants of the KDD-Cup-99 data set namely NSL-KDD data set containing 33,300 samples and 10% of gurekddcup data set con-taining 1,78,810 records. A description of NSL-KDD cup data set and gurekddcup datasets can be obtained from [17] and [32]. NSL-KDD data-set is chosen because of the following advan-tages: i) It does not include redundant records in the training set, hence the classifiers will not be biased towards frequent records. This results in a better detection rate. ii) The number of se-lected records from each group is inverse to the number of records in the dataset. iii) Significant reduction in the redundancy of data records al-lows the experiments to run on the complete set of training and testing data without selecting a random sample data set.
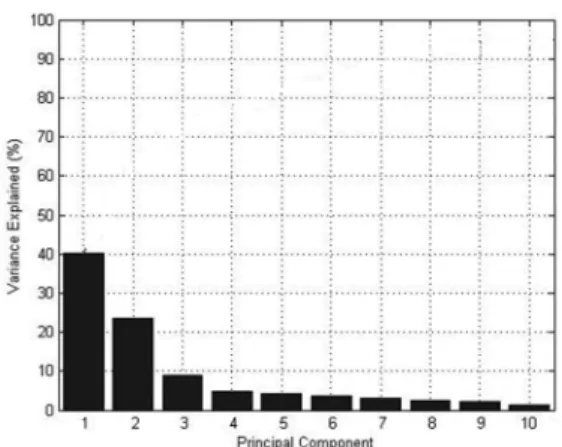
The dataset is very large and high-dimensional in nature. Hence both datasets undergo dimen-sionality reduction using PCA. Figure 6 shows the variance estimation of the ten principal components obtained for both datasets as they contain the same 41 features. The principal components having a cumulative variation of more than 90% are retained and the remaining ones are discarded on the basis of cumulative variation which is more than 90% whereas the remaining components are discarded because of the remaining 8.91% variation which is neg-ligible. The components with higher variance will be retained in the parameter selection re-sults after dimensionality reduction using PCA. Table 2 shows the different attributes selected by the dimensionality reduction technique, namely PCA. The basic ten features removed by PCA contribute to significantly less variance and hence the remaining 31 attributes selected are shown in Table 2.
5.1.2. Classifier Design
The final step of the proposed model is based on the optimization of SVM kernel parameter and punishment factor using the validation set and then training and testing the model to obtain a better accuracy and reduced false positive rate. The datasets are split into 10 non duplicated subsets and any nine of the subsets will be used for training the model and the remaining one for testing. This is termed as 10-fold cross valida-tion. Hence the SVM classifier will be trained and then tested for 10 intervals.
The cross validation accuracy before optimiza-tion is 85%, with an initial value of C and ϒ being 1. After many iterations of varying C and keeping ϒ constant and vice versa, the best accuracy rate of 98% is achieved when C and ϒ is 4.This result is achieved nearly after 600 iterations of modifying the kernel parameter values. Table 3 shows certain iterations of the automatic parameter selection technique. 5.1.3 Evaluation Methods
In this paper, we consider the detection rate (DR), false alarm rate (FAR) and correlation coefficient (CC) which are mostly used in lit-erature to estimate the performance of intrusion detection. They can be determined from the confusion matrix, as given in Table 1. The val-ues obtained in Table 1 are as follows:
True Positives (TP): Total instances of anoma-lies correctly classified as anomaanoma-lies
True Negatives (TN): Total number of normal instances correctly classified as normal
False Positives (FP): Total number of normal instances falsely classified as anomalies
False Negative (FN): Total number of anoma-lies wrongly classified as normal instance
Table 1. Confusion Matrix.
Predicted
(normal) Predicted (attack)
Actual(normal) TP FN
Actual(attack) FP TN
The derived metrics obtained from the confu-sion matrix are as follows:
(i) Detection rate
( )
DR TN TN FP=
+ (15)
(ii) False Alarm rate
(
FAR)
FN TN FP=
+ (16)
(iii) Correlation Coefficient: (CC) =
( )( )( )( )
TP TN FP FN
TP FP TP FN TN FP TN FN
⋅ − ⋅
+ + + + (17)
These parameters are essential in evaluating the performance of the intrusion detection model. The other parameter CC indicates the correla-tion among forecast result and the actual result
ranging from –1 to 1 where 1 specifies the es-timated result and is stable with the real calcu-lation and –1 is based on a random calcucalcu-lation. 5.2 Study I: The 41 and 31 Dimensional
NSL-KDD Cup Dataset
Study I is based on the 41 and 31 attributes se-lected from the NSL-KDD cup dataset. Table 6 shows the confusion matrix of the NSL-KDD cup dataset using the entire dataset without di-mensionality reduction wherein the accuracy levels of the Probe, DoS, R2L, U2R and Nor-mal are 85.65, 46.41, 33.33, 87.19 and 97.38 respectively in terms of percentage. It is evident that the accuracy levels of the various attack categories are very small. Hence dimensionality reduction is performed using PCA and the re-sults are summarized in Table 7. Table 7 shows the confusion matrix of NSL-KDD dataset af-ter optimization wherein the accuracy levels of Probe, DoS, U2R , R2L and Normal are 90.84, 91.22, 80.43, 78.35 and 63.62 respectively in terms of percentage. Hence it is very evident that the accuracy level of majority attacks such as DoS and Probe are high in comparison to the minority attacks such as U2R and R2L. This is due to the fact that the number of training sam-ples of U2R and R2L are very small in compar-ison to Normal, Probe and DoS samples.
Table 4 shows the performance metrics of the proposed model on NSL-KDD dataset after di-mensionality reduction. The performance met-rics of two different experiments on the same data set before and after optimization are ob-tained. It is evident that the accuracy of the classifier improves when the kernel parameter and punishment factor are tuned using auto-matic parameter selection technique. The other metrics evaluated are Precision, Recall and F-Score. Precision is the ratio of the number of relevant records classified to the total number of irrelevant and relevant records. Recall is the ratio of the number of relevant records classi-fied to the total number of records in the data-set. F-Score is a statistical technique for deter-mining accuracy based on both precision and recall. Table 5 shows the extended performance metrics of the proposed model. Figure 7 shows the performance metrics of the proposed model before and after optimization. The metrics ob-tained before optimization have a decreased level of accuracy, precision and recall whereas the metrics after optimization have a constant
increase in accuracy, precision and recall. The x-axis represents the different metrics and y-axis represents the accuracy levels. Hence the values fall in a straight line.
Table 2. Features selected from PCA. Content Hot, num_failed_logins, logged_in, Features Num_compromised, root_shell,
Su_attempted,
num_root, num_file_creation, Num_shells, num_access_files, num_outbound_cmds, is_host_login, is_guest_login
Traffic Count, srv_count, serror_rate,
Features srv_serror_rate, rerror_rate, same_srv_ rate, diff_srv_rate,
srv_diff_host_rate, dst_host_count, dst_host_srv_count, dst_host_same_srv_ rate,
dst_host_diff_srv_rate, dst_host_same_src_port_rate dst_host_srv_diff_host_rate, dst_host_serror_rate, dst_host_srv_serror_rate, dst_host_reeror_rate, dst_host_srv_rerror_rate, dst_host_rerror_rate, dst_host_srv_rerror_rate
Table 3. Accuracy obtained by automatic parameter selection technique.
C Gamma ϒ AccuracyMean Alarm False
Rate
1 0.001 88% 12%
1 0.01 94% 6%
1 0.03 96% 4%
1 0.05 96.3% 3.7%
1 0.07 98.1% 1.9%
10 0.001 97.7% 2.3%
10 0.01 96.3% 3.7%
Table 4. Performance metrics of the model on NSL-KDD dataset.
Datasets CC Accuracy FAR
D1 0.9314 0.9655 0.0012
D2 0.9940 0.9970 0.0030
![Figure 1. Linear support vector machine [34].](https://thumb-us.123doks.com/thumbv2/123dok_us/8038502.2128516/5.1785.918.1605.626.1329/figure-linear-support-vector-machine.webp)