PAPER • OPEN ACCESS
Optimizing the Concrete Materials by Taguchi
Optimization Method
To cite this article: K.V Sabarish et al 2019 IOP Conf. Ser.: Mater. Sci. Eng. 574 012002
View the article online for updates and enhancements.
Recent citations
Encapsulation of Ldopa and catechol in bovine serum albumin nanocarrier using desolvation method and their in vitro release studies
Aysan Rafipour et al
Optimizing the Concrete Materials by Taguchi Optimization
Method
Sabarish K.Va, Akish Remo Mb, Pratheeba Paulc
aVels Institute of Science, Technology & Advanced Studies, Chennai, India bStudent, Department of Civil Engineering, Vels University Chennai, India cHindustan Institute of Technology and Science, Chennai, India
ABSTRACT: This manuscript presents the outcome of an experimental investigation conceded out to optimize the mix proportions of the concrete by the Taguchi method of parameter design. The concrete mix design is done by the L9 orthogonal array that is 34. When a new material is used in the concrete all the mix variables are taken into account so that it may cost so much, it means more need for money, material, personnel and time. In order to reduce the number of mix combination in concrete, the Taguchi method is used. In this project the cement sand and aggregate are partially replaced by cement as fly ash, river sand as M-sand and the compression values are taken and the value is compared with the conventional concrete special concrete compression value is compared with the conventional concrete and S/N value is taken from the compression value and the comparison of the values are done. In order to attain good strength and to avoid cracks, sisal fiber is added in the concrete with a percentage of (1, 1.5, and 2).
1. INTRODUCTION
In this, the Taguchi method are used to optimize the combination of a selected parameters because it has so many numbers of combination that is a full factorial method and it is difficult to do project so that Taguchi method are used to optimize the number of combination to make the project cost-effective.
The concrete mix designs are done by the L9 orthogonal array that is 34. When a new material is used in the concrete all the mix variables are taken into account so that it may cost so much, it means more need for money and material, personnel, time. In order to reduce the number of mix combination in concrete, the Taguchi method is used In this the materials are partially replaced with cement to fly ash, Sand to m-sand, and coarse aggregate is replaced by the selected percentage and sisal fiber is added to avoid the cracks fiber is mixed with the concrete and cubes are casted.
The concrete cube should be properly cast and the compaction should be done properly so that no air bubbles will not be present inside the concrete cube. After the concrete cube are cast. The cubes are cured and they are tested for 7 days, 14 days and 28-day compression test. This test is done in a compression machine. The outcome of an experimental study carried out to optimize the mix size of the concrete by the Taguchi method. The compression values that are conventional concrete and special concrete compression value are compared with the conventional concrete so that we will get a compression graph and S/N value is taken from the compression mean value. The mean value and the S/N values are plotted in the graph so the graphs are compared and we can get a final value.
2 2. MATERIAL PROPERTIES
Cement
Ordinary Portland cement (7.5 Grade) was used in all test specimen. Properties are tested by referring IS 12269-1987. The specific gravity of cement was 3.13. Standard consistency of cement is 34%. The fly ash was used as a partial replacement of cement by different proportions.
Fly ash
Fly ash is one of the binding materials used in this project with cement and it is partially replaced with cement.
Fine Aggregates
The fine aggregate utilized was the normal sand free from pollutions and passing through 4.75 mm IS sieve. The specific gravity was found to be 2.65, and the fine aggregate is partially replaced with M-sand.
Coarse Aggregates
The locally available coarse aggregate passing through 20 mm IS sieve and retained on 10 mm IS sieve was used. The specific gravity of coarse aggregate was found to be 2.8.
Fibers
In this study sisal fiber is used for the project and these fibers are taken from the cactus plant leaf and its fibers are added with the percentage of 1, 1.5 and 2.
3. METHODOLOGY
Taguchi technique is a tool for optimizing the recital characteristic of a process. The aim of the research is to spot and design the method parameters that optimize the chosen quality characteristic and they are least to noise factors. In the current study, the goal of the job is to see the effects of the method parameters on the concert and the optimum blend of control factors that would increase the compressive strength of the concrete which is elected as the quality attribute.
Selection of control factors and their levels are made on the basis of some literature review. Four control factors are in use such as water/binder–ratio, fly ash, M-sand, and Sisal fibers are selected for the project. The elected four control factors are treating at three levels, as exposed in Table 1. The choice of three levels has been concluded because, due to the effect of these factors on the show characteristic may vary.
An orthogonal array is a fractional design which will balance property. By array design, the property of multiple variables on the concert characteristics can be predictable at the same time while minimize the quantity of the test. An L9 (34) orthogonal array is selected for the present examination S/N ratios are three types, i.e. the smaller is better, the higher is better, and the nominal is finest. The formula worn to design for analyzing S/N percentage, it is revealed below.
Smaller is better
It is chosen when the goal is to minimize the response. The S/N can be calculated for smaller the better
= −10 10
1
2
=1 Larger is better
It is chosen when the goal is to maximize the response. The S/N is calculated for larger the better.
= −10 10
1
1
2
=1
Nominal is better
It is chosen when the goal us to target the response and it is required to base the S/N on the standard deviation only. The S/N is calculated for smaller the better.
= −10 10
1
(− 0
=1
)2
4. RESULT AND DISCUSSION
The universal testing machine is used to measure the compressive strength of the concrete cubes. The three compression readings are recorded for each combination as shown in Table 5. These parameters are taken from a designed experiment to analyze the mean function.
Table 1. Parameters and levels
Factors Level 1 Level 2 Level 3
Water/ binder
ratio A 0.40 0.45 0.5
Fly ash (%)
B 20 25 30
M Sand (%)
C 30 35 40
Sisal Fiber (%)
D 1 1.5 2
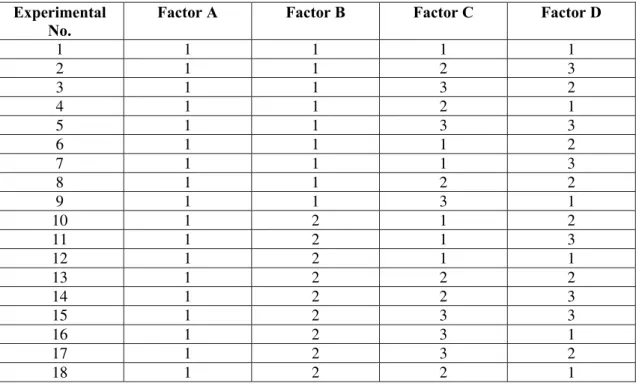
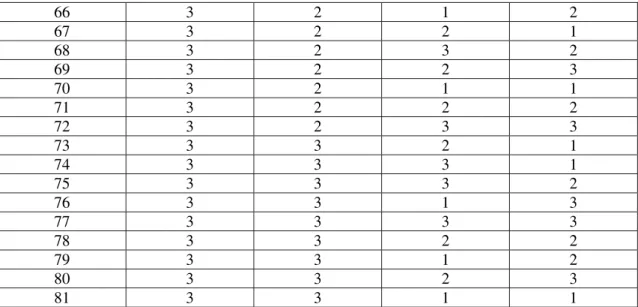
Table 2.Full factorial orthogonal array for L9
Experimental No.
Factor A Factor B Factor C Factor D
1 1 1 1 1
2 1 1 2 3
3 1 1 3 2
4 1 1 2 1
5 1 1 3 3
6 1 1 1 2
7 1 1 1 3
8 1 1 2 2
9 1 1 3 1
10 1 2 1 2
11 1 2 1 3
12 1 2 1 1
13 1 2 2 2
14 1 2 2 3
15 1 2 3 3
16 1 2 3 1
17 1 2 3 2
4
19 1 3 1 1
20 1 3 2 3
21 1 3 3 2
22 1 3 2 1
23 1 3 3 3
24 1 3 1 2
25 1 3 1 3
26 1 3 3 1
27 1 3 2 2
28 2 1 2 3
29 2 1 1 3
30 2 1 3 2
31 2 1 2 2
32 2 1 1 2
33 2 1 2 1
34 2 1 1 1
35 2 1 3 3
36 2 1 3 1
37 2 2 3 1
38 2 2 2 3
39 2 2 1 3
40 2 2 3 2
41 2 2 1 2
42 2 2 2 2
43 2 2 2 1
44 2 2 1 1
45 2 2 3 3
46 2 3 1 1
47 2 3 2 3
48 2 3 1 3
49 2 3 3 2
50 2 3 2 2
51 2 3 1 2
52 2 3 3 3
53 2 3 3 1
54 2 3 2 1
55 3 1 3 1
56 3 1 3 2
57 3 1 1 3
58 3 1 1 2
59 3 1 2 1
60 3 1 1 1
61 3 1 2 2
62 3 1 3 3
63 3 1 2 3
64 3 2 3 1
66 3 2 1 2
67 3 2 2 1
68 3 2 3 2
69 3 2 2 3
70 3 2 1 1
71 3 2 2 2
72 3 2 3 3
73 3 3 2 1
74 3 3 3 1
75 3 3 3 2
76 3 3 1 3
77 3 3 3 3
78 3 3 2 2
79 3 3 1 2
80 3 3 2 3
81 3 3 1 1
Generally, there are three standard S/N equations are widely used to classify the objective function- larger the better, smaller the better or nominal the best.
In the present study compressive strength should be larger so that and our goal is also to maximize the strength. The standard S/N ratio is given below.
= −10 10
1
1
2
=1
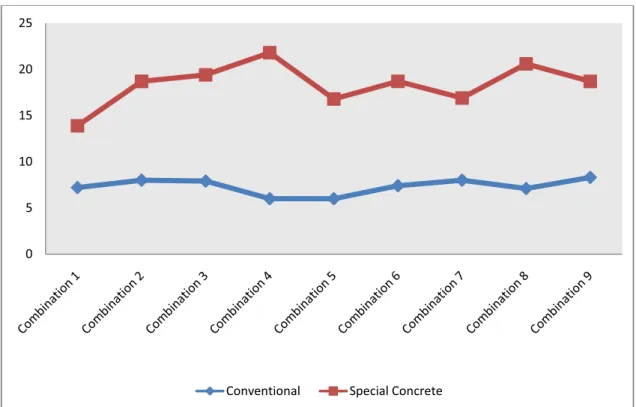
Using the above formula for each of the nine experimental combinations and are reported in Table 6. The comparison between the compression value of conventional concrete and special concrete is plotted in the graph, as shown in figure 1. In the compression graph, the highest value is combination 4which has the highest value of nine combinations. The standardideals of S/N ratios of the four control factors at all of the levels are exposed in Figure 2, and from which the levels resultant to the highest S/N ratio values are chosen for all parameter instead of the optimum circumstance. Here, the optimum condition is the maximization of the compressive strength. In the Figure 2 the optimum levels are: A2 (water/binder ratio: 0.45), B2 (fly ash 25%), C2 (coarse sand: 35%) and D3 (stone dust: 2%) respectively.
Table 3.Standard orthogonal array (L9)34
Experimental No. Factor A Factor B Factor C Factor D
1 1 1 1 1
2 1 2 2 2
3 1 3 3 3
4 2 1 2 3
6
6 2 3 1 2
7 3 1 3 2
8 3 2 1 3
9 3 3 2 1
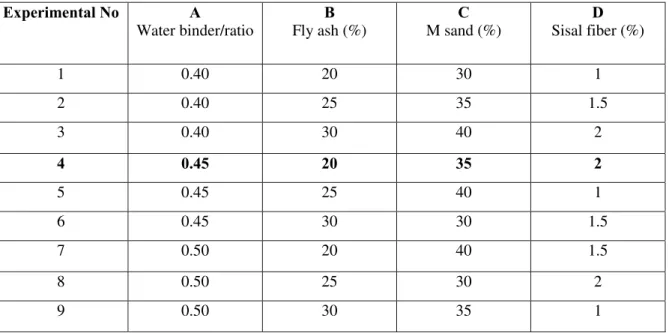
Table 4.Taguchi optimization experimental design (L9)34
Experimental No A
Water binder/ratio
B
Fly ash (%)
C
M sand (%)
D
Sisal fiber (%)
1 0.40 20 30 1
2 0.40 25 35 1.5
3 0.40 30 40 2
4 0.45 20 35 2
5 0.45 25 40 1
6 0.45 30 30 1.5
7 0.50 20 40 1.5
8 0.50 25 30 2
9 0.50 30 35 1
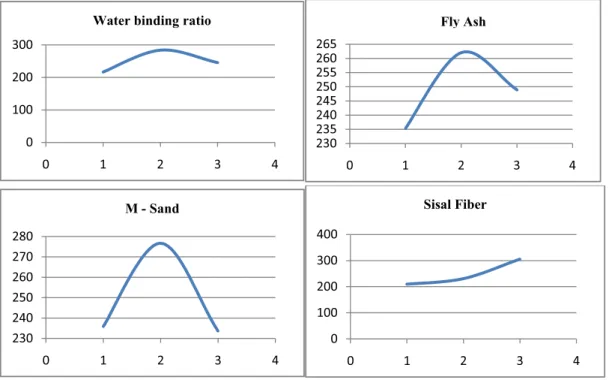
The standard values of the compressive strength for every factor at the three levels have been designedand are plotted in Figure 3. The mean response analysis also indicate the similar optimum level of the parameters (A2, B2, C2, and D3) as is obtain in S/N ratio analysis. So that the strength which is attained is correct.
Table 5. Compression result and S/N ratio value
Experimental No. COMPRESSIVE STRENGTH OF MATERIALS
(KN)
S/N ratio (dB)
Reading 1 Reading 2 Reading 3 Mean
1 130 150 175 151.667 43.584
2 225 255 240 240.000 47.541
3 245 260 270 258.333 48.219
4 340 355 370 355.000 50.970
5 235 250 245 243.333 47.695
6 260 245 255 253.333 48.007
7 183 220 195 199.333 46.000
8 290 303 315 302.667 49.581
Fig 1.Compression graph of conventional vs special concrete
Fig 2.Process parameters on average S/N ratio
0 5 10 15 20 25
Conventional Special Concrete
46.5 47 47.5 48 48.5
0 1 2 3 4
Fly ash
46 46.547 47.548 48.549 49.5
0 1 2 3 4
Water binding ratio
46 47 48 49 50
0 1 2 3 4
Sisal Fiber
46.5 47 47.5 48 48.5 49
0 1 2 3 4
8
Fig 3.Mean response characteristic graph CONCLUSION
The parameters of the mix design are optimized by Taguchi method for an L9 orthogonal array with four control factors and three levels. Selected parameters along with the levels are; water/ binding ratio (0.40, 0.45, 0.50); fly ash (20, 25, 30); M-sand (30, 35, 40); sisal fiber (1, 1.5, 2). In this orthogonal combination(2, 1, 2, 3) gives more strength when compared with other orthogonal combination. The total material cost of the project and the time conception is highly reduced.
REFERENCES
[1] Sabarish.k.v,Experimental Studies On Partial Replacement Of Cement With Fly Ash In Concrete Elements, International Journal of Civil Engineering & Technology (IJCIET), Volume 8, Issue 9, September 2017, pp. 293–298.
[2] Sabarish.k.vUtilization of Sisal Fiber In Portland Cement Concrete Elements, “International Journal of Civil Engineering & Technology (IJCIET), Volume 9, Issue on the 9th of September 2018, page 1682–1686- Scopus Indexed Journal.
[3] Sabarish.k.v, Experimental Investigation on Strength and Durability Properties of Sisal Fiber Reinforced Concrete, International Journal of Chemical Sciences, August & 2016, PP - 241-246.
[4] Chang PK, Hou WM. A study on the hydration properties of high performance slag concrete analysed by SRA. Cement and Concrete Research 2003; 33(2):183-189.
0 100 200 300
0 1 2 3 4
Water binding ratio
230 235 240 245 250 255 260 265
0 1 2 3 4
Fly Ash
230 240 250 260 270 280
0 1 2 3 4
M - Sand
0 100 200 300 400
0 1 2 3 4
[5] Singh H, Kumar P. Tool wear optimization in turning operation by Taguchi method. Indian Journal of Engineering and Material Sciences 2004; 11(1):19-24.
[6] Sabarish, Experimental Investigation on Strength and Durability Properties of Sisal Fiber Reinforced Concrete SSRG International Journal of Civil Engineering – (ICCREST’17) - Special Issue- March 2017,PP-6569.
[7] Nuruddin, M.F., Bayuaji R., Mirha Foamed Concrete For Load Bearing Structures, in International Engineering Convention 2009 (Intec2009). 2009: Damascus Syria.