© The Author 2016. Published by Oxford University Press on behalf of The Gerontological Society of America. All rights reserved.
For permissions, please e-mail: [email protected]. 1437
cite as: J Gerontol A Biol Sci Med Sci,2016, Vol. 71, No. 11, 1437–1443 doi:10.1093/gerona/glw131 Advance Access publication July 5, 2016
Research Article
Relationship of Objectively-Measured Habitual Physical
Activity to Chronic Inflammation and Fatigue in
Middle-Aged and Older Adults
Barbara J. Nicklas,
1Daniel P. Beavers,
2Shannon L. Mihalko,
3Gary D. Miller,
3Richard F. Loeser,
4and Stephen P. Messier
31Section on Gerontology and Geriatric Medicine, J. Paul Sticht Center on Aging, Department of Internal Medicine, and 2Department of
Biostatistical Sciences, Wake Forest School of Medicine, Winston-Salem, North Carolina. 3Department of Health and Exercise Science, Wake Forest University, Winston-Salem, North Carolina. 4Thurston Arthritis Research Center and the Division of Rheumatology, Allergy, and Immunology, University of North Carolina, Chapel Hill.
Address correspondence to Barbara J. Nicklas, PhD, Section on Gerontology and Geriatric Medicine, Department of Internal Medicine, Wake Forest School of Medicine, Medical Center Boulevard, Winston-Salem, NC 27157. E-mail: [email protected]
Received March 24, 2016; Accepted June 22, 2016
Decision Editor: James Goodwin, MD
Abstract
Background: Habitual (non-exercise) physical activity (PA) declines with age, and aging-related increases in inflammation and fatigue may be important contributors to variability in PA.
Methods: This study examined the association of objectively-measured PA (accelerometry over 7 days) with inflammation (plasma interleukin-6 and C-reactive protein) and with self-reported fatigue (SF-36 Vitality) at baseline and 18 months after a diet-induced weight loss, exercise, or diet-induced weight loss plus exercise intervention in 167 overweight/obese, middle-aged, and older adults.
Results: At baseline, individuals with higher plasma interleukin-6, as well as those who reported feeling less energetic (more fatigued), took less steps per day and had lower PA energy expenditure and minutes of light and moderate–vigorous PA (p < .05 for all). At the 18-month follow-up, inflammation was lower in both weight loss groups, fatigue was reduced in all three groups with larger decreases in the combined group, and mean levels of habitual PA were not changed in any group. In longitudinal analyses with all groups combined, we found that participants reporting larger increases in vitality (eg, declines in fatigue) had greater increases in PA (p < .05 for all). Also, changes in steps/d and physical activity energy expenditure were indirectly associated with changes in interleukin-6 (β [SEM] for steps/d = −565 [253]; β [SEM] for physical activity energy expenditure = −22.4 [10.17]; p < .05).
Conclusions: Levels of habitual PA are lower in middle-aged and older adults with higher levels of chronic inflammation and greater self-reported fatigue. In addition, participants who experienced greater declines in inflammation during the interventions had greater declines in fatigue and larger increases in PA.
Keywords: Accelerometry—C-reactive protein—Interleukin-6—SF-36 Vitality subscale
Physical activity (PA) is comprised of both “purposeful” exercise, as well as non-exercise movement comprised primarily of mobility-related activities occurring throughout the day. This habitual (non-exercise) activity declines across the lifespan (1), an observation that is biologically inherent to aging, as it is evident even among highly fit older exercisers (2) and is observed across species (3). Habitual PA is inversely related to sedentary behavior (sitting or lying down), and more sedentary behavior is associated with worse physical function
and loss of mobility in older adults, even independent of structured exercise (4–6).
Fatigue also increase with age (8,9), and some studies report an asso-ciation between fatigue and low levels of PA and greater sedentary behavior (10–17). However, the biological link between fatigue and sedentary behavior is not known. Acute inflammation from infection results in fatigue (ie, “sickness behavior”) and chronic inflammation underlies fatigue symptoms common to specific diseases (18–21). Aging is characterized by an increasingly elevated pro-inflammatory state, but one that is far below that observed during acute infections or disease states (22–24). This persistent, low-grade inflammation is likely a contributing factor to loss of muscle function and onset of disability with age (25,26); however, its role in fatigue and reduced PA is less studied (14,15,27,28).
The purpose of this study was to determine the cross-sectional and longitudinal relationships of objectively-measured habitual PA to biomarkers of inflammation and self-reported fatigue in mid-dle-aged and older adults. We examined these relationships using baseline and follow-up data collected from participants before and 18 months after either: diet-induced weight loss alone, exercise alone, or diet-induced weight loss plus exercise. We hypothesized that individuals with higher inflammation would report feeling more fatigued and have lower levels of PA at baseline; and that individual changes in habitual PA over the 18 months of intervention would be associated with individual changes in inflammation and fatigue, independent of treatment arm.
Methods
Study Design and Participants
This analysis used data from a random sub-sample (n = 167) of 454 total participants enrolled in the Intensive Diet and Exercise for Arthritis study (IDEA; conducted between July 2006 and April 2011), an 18-month, randomized, controlled trial of the effects of three interventions: Diet-induced weight loss only (Diet, N = 49); Exercise only (Exercise, N = 60); and Exercise in combination with diet-induced weight loss (Diet+Exercise, N = 58). The participants in the sub-sample were those randomly assigned at baseline to addi-tional/ancillary assessments outside the primary outcomes, includ-ing accelerometer measurement of PA. Complete details of the trial design, methodology, and main results are published (29).
Briefly, ambulatory, middle-aged and older (≥55 years), over-weight or obese (body mass index [BMI] = 27–41 kg/m2) men and
women were enrolled if they met all inclusion/exclusion criteria, including: (a) Kellgren Lawrence grade II-III (mild to moderate) radiographic tibiofemoral osteoarthritis of one or both knees; (b) not performing more than 30 min/wk of exercise in past 6 months; (c) no cognitive impairment or depression; (d) no knee surgery in prior 6 months; and (e) no clinically relevant comorbid disease that would pose a safety threat or impair ability to participate. The Wake Forest University Health Sciences Institutional Review Board approved the study and all participants gave written informed con-sent to participate.
Interventions
Details of the interventions are published (29). The diet-induced weight loss intervention consisted of group and individual nutri-tion educanutri-tion and behavioral sessions, as well as an individualized dietary prescription plan providing an energy-intake deficit of 800– 1,000 kcals/d to reach an average weight loss goal of 10% of base-line weight. The prescribed diet provided an energy intake deficit of 800 to 1,000 kcal/d as predicted by estimated weight-maintenance energy expenditure (estimated resting metabolic rate × 1.2 activity
factor) with at least 1,100 kcal/d for women and 1,200 kcal/d for men. There was one individual session and three group sessions per month for the first 6 months. From months 7–18, participants attended biweekly group sessions, with an individual appointment every 2 months. The Exercise-only group was not counseled to restrict caloric intake during the study.
The exercise intervention took place 3 days per week. Each ses-sion consisted of a 5-minute dynamic warm-up, an aerobic phase (over ground walking) for 15 minutes, followed by light strength training (20 minutes) and a second aerobic phase of over ground walking for 15 minutes, and then a cool-down with stretching (10 minutes). During the first 6 months, each session was supervised and center-based. Starting at month 7, participants could continue to exercise in the research center for all 3 d/wk (chosen by 67% of participants), or could opt for a home-based program (11%), or a combination of center- and home-based (22%). Exercise prescrip-tions were individualized based on a participant’s ability. Briefly, the walking intensity prescription progressed from 50% to 60% of heart rate reserve initially to 75%–85% of HRR; the strength train-ing workload was also progressive with participants increastrain-ing the weight lifted every fifth to sixth session during the first 6 months, and then maintained that weight for 12 months.
Measurements
Demographic characteristics were obtained through self-report ques-tionnaires, and included age, sex, race, and years of education. Body height and weight were assessed in the clinic without shoes or heavy clothing on a calibrated scale using standard techniques. Self-reported
pain and function were assessed using the Western Ontario McMasters Universities Osteoarthritis Index (WOMAC). Perception of fatigue was assessed using the Vitality domain on the original Medical Outcomes Study 36-item short-form (SF-36) measure (30). The Vitality sub-scale consists of four items assessing vitality/fatigue levels in the past month on a 6-point scale from 1 (“all of the time”) to 6 (“none of the time”). The questions are: (a) Did you feel tired?; (b) Did you feel worn out?; (c) Did you feel full of pep?; and (d) Did you have a lot of energy? Scores are linearly transformed to a scale of 0 to 100, with higher scores indicating higher vitality (ie, less fatigue). A summary vitality/ fatigue score was calculated by averaging the four scores.
Physical activity
analysis and outcome variables included: total steps/d, PAEE, min-utes of light physical activity (Light PA), and minmin-utes of moderate or vigorous physical activity (Mod–Vig PA).
Inflammatory biomarkers
Blood samples were collected in the early morning after a 12-hour fast. All follow-up samples were collected at least 24 hours after an exercise session and blood sampling was postponed (1–2 weeks after recovery of all symptoms) in the event of an acute respiratory, urinary tract, or other infection. Plasma interleukin-6 (IL-6) assays were run using Quantikine enzyme-linked immunosorbent kits from R&D systems (Minneapolis, MN) and high-sensitivity CRP was assessed using an automated immunoanalyzer (IMMULITE; Diagnostics Products Corporation, Los Angeles, CA) (31).
Statistical Analysis
Baseline characteristics are presented overall using descriptive meas-ures. Inflammatory biomarkers were assessed on the log-scale due to right skewness. Pearson partial correlations were estimated between baseline PA measures and both fatigue and inflammation at baseline, adjusted for age, gender, race, and BMI. Treatment effects on PA, inflammation, and fatigue at 6 and 18 months was assessed using mixed linear models adjusted for visit, visit-by-treatment interac-tion, gender, baseline BMI, and baseline values of the outcome; visit-specific means and p-values were estimated using contrast statements, assuming an AR (1) covariance. Associations between 6- and 18-month changes in PA and 6- and 18-month changes in fatigue and inflammation were analyzed using Pearson partial cor-relations, adjusted for baseline age, sex, race, and baseline BMI. We also analyzed these associations averaging across time points using mixed linear models to account for repeated measures. One model of the association between change in PA and change in vitality/fatigue, and another model between change in PA and change in inflamma-tory biomarker, were adjusted for randomization group, visit, group-by-visit interaction, sex, baseline BMI, and baseline value of the PA outcome.
All tests were performed assuming a 2-sided alternative hypoth-esis at a .05 level of significance. Due to the exploratory nature of the substudy, no adjustment for multiplicity was performed. All analyses were conducted using SAS v9.4.
Results
Participant Baseline Characteristics
Demographic and other characteristics of the study sample at base-line are shown in Table 1. Briefly, participants were predominantly women, college-educated, and white. All were either overweight or obese and the average number of comorbidities was 1.8 ± 1.1. The CRP and IL-6 levels in this overweight/obese sample of middle-aged/ older adults are considered to be elevated compared to the general population (33); however, there was large variability in these inflam-matory markers. The SF-36 Vitality (fatigue) scores, as well as the PA data, also indicate large inter-individual variability among the study sample.
Cross-sectional Associations Among Inflammation, Fatigue, and PA at Baseline
To determine whether individuals with higher chronic inflammation and greater fatigue have lower levels of habitual PA, we calculated Pearson correlation coefficients (adjusting for age, sex, race, and
BMI) among all variables at baseline. There was a significant inverse relationship between IL-6 concentrations and PA, such that those with higher plasma IL-6 were less active across each measure of PA (steps/d: r = −.20; PAEE: r = −.21; light PA: r = −.16; Mod–Vig PA:
r = −.19; all p < .05). CRP concentrations only correlated with PAEE (r = −.16, p < .05). In addition, there were small, but significant, positive correlations between PA and the SF-36 Vitality score, such that those who reported feeling more energetic (less fatigued) were more active (steps/d: r = .19, p < .05; PAEE: r = .16, p < .05; light PA:
r = .18, p < .05; Mod–Vig PA: r = .14, p = .07). Self-reported vital-ity/fatigue levels did not correlate with CRP or IL-6 concentrations.
Treatment Effects on Inflammation, Fatigue, and PA
By design, there was a significant loss of body mass in both Diet and Diet+Exercise compared to Exercise, but no difference in weight lost between weight loss groups (Diet = −10.7 ± 7.3 kg, 14.1%; Diet+Exercise = −11.0 ± 9.5 kg, 14.3%; Exercise = 0.1 ± 3.6 kg, 0.2%; p < .0001). Table 2 shows the 6-month and 18-month treat-ment effects on the inflammation, vitality/fatigue, and PA variables, adjusted for baseline BMI, sex, and baseline value of each meas-ure. Treatment effects on inflammation showed that both Diet and Diet+Exercise had lower CRP and IL-6 than Exercise at both 6- and
Table 1. Baseline Demographic and Health Characteristics of the Study Sample
Mean ± SD or # (%)
Age (y) 66.2 ± 6.4
Female, n (%) 116 (70%)
White, n (%) 135 (81%)
Weight (kg) 92.9 ± 14.5
Education
Less than High School 49 (29%)
College or Grad school 118 (71%)
Body mass index (kg/m2) 33.5 ± 3.7
Percentage body fat (%) 39.6 ± 7.0
Self-reported comorbidities, n (%)
Hypertension 105 (64%)
Cardiovascular disease 13 (8%)
Diabetes 24 (15%)
Osteoporosis 18 (11%)
Any Cancer 35 (22%)
WOMAC pain score 5.9 ± 2.8
WOMAC function score 22.3 ± 10.3
Inflammation
CRP (mg/L) 8.2 ± 10.1
IL-6 (pg/mL) 3.1 ± 2.0
SF-36 Vitality questions
Feeling tired 59.3 ± 23.0
Feeling worn-out 69.0 ± 22.7
Feeling energetic 44.3 ± 25.0
Feeling peppy 46.5 ± 24.0
SF-36 Vitality summary score 54.8 ± 19.5 Accelerometer-measured physical activity (PA)
Steps/d 6,143 ± 2,558
PA energy expenditure (kcal/d) 234 ± 125
Light PA (min/d) 130 ± 39
Mod–Vig PA (min/d) 10.5 ± 9.3
18-months; this is consistent with what was reported in the entire cohort previously (29,31). The treatment effects on self-reported vitality/fatigue are shown in Table 2 and Figure 1. Overall, there were significant increases across all three groups in their SF-36 Vitality score (eg, decrease in fatigue). By the 18-month time point, the combined group of Diet+Exercise reported feeling more energetic (less fatigued) than either Exercise or Diet (p < .05). The number of minutes of Mod–Vig PA was greater in the Exercise groups (Exercise and Diet+Exercise); however, there were no group differences in any of the other PA measures at 6 or 18 months.
Longitudinal Associations Among Inflammation, Fatigue, and PA
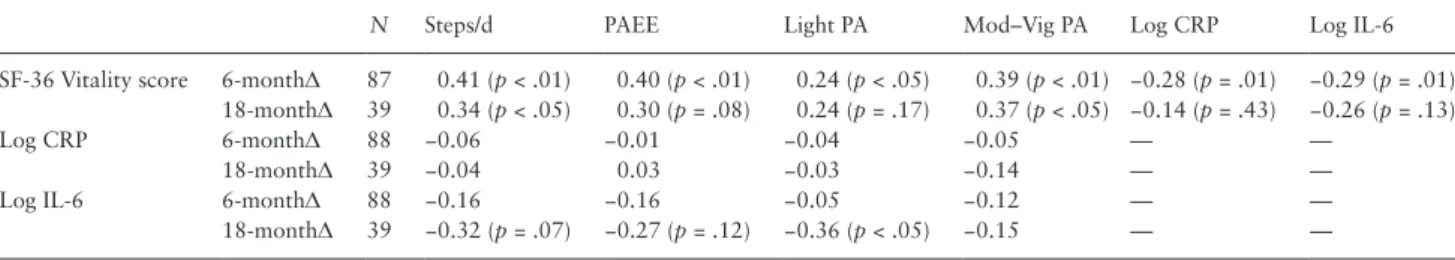
Pearson correlation coefficients (adjusted for baseline age, sex, race, and BMI) among changes in inflammation, fatigue and PA are shown in Table 3. Changes in all of the PA variables correlated positively with changes in the SF-36 Vitality score, especially at the 6-month time point, whereby individuals with a larger increase in vitality (ie, greater reduction in fatigue) exhibited greater increases in PA. There were negative correlations between changes in both CRP and IL-6 and changes in the SF-36 Vitality score, such that greater increases in vitality (ie, greater reductions in fatigue) correlated with larger declines in inflammation. Changes in PA were not related to changes in CRP at either time point; however, changes in steps per day and light PA correlated negatively with changes in IL-6 at 18-months.
We also determined whether longitudinal changes in PA were associated with changes in vitality/fatigue or inflammation using mixed model linear regression. Modeling the associations between changes in vitality/fatigue and the PA variables showed there were positive associations among changes in each PA variable and changes in the SF-36 Vitality score (β [SEM] for steps/d = 38.31 [9.74];
PAEE = 1.61 [0.40]; light PA = 0.44 [0.19]; Mod–Vig PA = 0.13 [0.03]; p < .05 for all). Modeling associations between change in inflammation and the PA variables showed changes in PA were not associated with changes in CRP, but changes in steps/d and PAEE were indirectly associated with changes in IL-6 levels (steps/d = −565 [253]; PAEE = −22.4 [10.17]; p < .05).
Discussion
This paper took advantage of existing data from a lifestyle inter-vention trial to examine the cross-sectional and longitudinal
Table 2. Inflammation, SF-36 Vitality Score, and Physical Activity by Treatment Group
Diet Only Exercise Only Diet+Exercise Overall
Mean (95% CI) Mean (95% CI) Mean (95% CI) p-value
Log CRP (mg/L) Baseline 1.48 (1.14; 1.83) 1.72 (1.46; 1.97) 1.39 (1.08; 1.69)
6-month 1.10 (0.94; 1.26) 1.51 (1.36; 1.67) 1.15 (1.00; 1.30) <.001 18-month 0.90 (0.74; 1.06) 1.37 (1.21; 1.53) 0.88 (0.73; 1.04) <.0001 Log IL-6 (pg/mL) Baseline 0.82 (0.62; 1.01) 0.92 (0.77; 1.06) 1.09 (0.93; 1.26)
6-month 0.75 (0.65; 0.85) 0.91 (0.82; 1.01) 0.79 (0.70; 0.88) .04
18-month 0.72 (0.62; 0.82) 0.96 (0.86; 1.06) 0.72 (0.63; 0.82) <.001 SF-36 Vitality score Baseline 57.0 (51.4; 62.7) 53.6 (48.5; 58.7) 54.1 (49.0; 59.1)
6-month 62.1 (59.3; 64.9) 62.2 (59.5; 65.0) 65.4 (62.7; 68.0) .14
18-month 61.3 (58.6; 64.0) 61.7 (59.0; 64.4) 66.4 (63.7; 69.1) .01
Steps/d Baseline 5,886 (5,198; 6,573) 6,548 (5,914; 7,182) 5,942 (5,211; 6,673)
6-month 6,258 (5,462; 7,053) 5,521 (4,755; 6,287) 6,207 (5,475; 6,939) .29 18-month 5,252 (4,176; 6,329) 4,686 (3,745; 5,627) 5,963 (4,775; 7,151) .23
PAEE (kcal/d) Baseline 219 (187; 251) 252 (220; 285) 228 (193; 264)
6-month 223 (189; 258) 213 (179; 246) 223 (191; 255) .86
18-month 182 (136; 228) 164 (123; 204) 206 (156; 257) .40
Light PA (min/d) Baseline 135 (123; 147) 132 (123; 142) 124 (115; 134)
6-month 133 (118; 148) 119 (104; 134) 126 (112; 140) .39
18-month 109 (87; 131) 107 (88; 126) 131 (107; 155) .23
Mod–Vig PA (min/d) Baseline 7.9 (5.8; 10.0) 12.1 (9.7; 14.6) 11.1 (8.4; 13.8)
6-month 9.8 (7.2; 12.4) 8.8 (6.2; 11.3) 12.4 (10.0; 14.7) .09
18-month 7.9 (4.1; 11.7) 6.3 (3.1; 9.6) 15.7 (11.6; 19.9) <.01
Note: No differences between groups at baseline: Diet (Baseline N = 49, 18-month N = 41); Exercise (Baseline N = 60, 18-month N = 41); Diet+Exercise (Base-line N = 58, 18-month N = 43). SF-36 Vitality scale (higher scores indicate feeling more energetic/less fatigued); CI = confidence interval; CRP = C-reactive protein; IL-6 = interleukin-6; Mod–Vig PA = moderate or vigorous physical activity; PAEE = physical activity energy expenditure.
relationships of objectively-measured habitual PA with biomark-ers of chronic inflammation and levels of perceived fatigue, two factors likely to contribute to one’s propensity to move through-out the day. In cross-sectional analyses with baseline data, we found relatively weak, but statistically significant, correlations between inflammation and PA, and between fatigue and activity. Participants with higher inflammation (especially IL-6) had fewer steps per day and fewer minutes of light, moderate and vigorous activity, independent of age, sex, race, and baseline BMI. These results are consistent with several prior observational studies reporting an inverse relationship between inflammation and PA (34–36). However, the premise of most of these studies was that PA is the predictor variable, and conclusions drawn suggest engag-ing in more activity, especially that of a higher-intensity, lowers inflammation (37,38). Our premise is that the converse is also true, that inflammation contributes to lowering of activity, pos-sibly through increasing fatigue, as we (in this study), and others (10–17), find that those who report more fatigue are less active. Though in our data from overweight/obese older adults with prev-alent knee osteoarthritis, there was no cross-sectional association between inflammation and fatigue using the Vitality domain of the SF-36, a few other studies do show a link between inflam-mation and fatigue in healthy (15,27,28) and diseased (18–21) populations.
The link between habitual PA and inflammation may be a “vicious cycle” whereby elevated chronic inflammation leads to fatigue and less activity throughout the day (eg, more time spent lying or sitting or in sedentary behavior), and in turn, inactivity leads to higher inflammation, making it difficult to decipher exact causal links between them. This idea is supported by recent work showing individuals who spend more time sit-ting have an elevated inflammatory profile, independent of time spent in moderate or vigorous PA (39–41). Disrupting this cycle with experimental studies that decrease inflammation are needed to definitively confirm the idea that not only acute, but also chronic, inflammation is a risk factor for sedentary behavior and reduced habitual activity.
Although not the primary purpose of our study, we also reported mean effects of the interventions on inflammation, fatigue, and habitual PA. These analyses confirmed the already known effects of weight loss for lowering inflammation (35,42) as both CRP and IL-6 levels were much lower in the diet groups after treatment, compared to exercise only. However, despite greater weight loss and less inflam-mation in both diet groups, the combined diet and exercise group reported less fatigue at 18-months compared to either exercise or diet alone. The positive effects of the diet and exercise combination
on the SF-36 Vitality domain is in line with the overall conclusion of a recent systematic review (of studies in younger and middle-aged individuals) which found vitality was the most responsive sub-scale of the SF-36 to small decreases in body weight in response to life-style interventions (43). Notably, there were no group differences in habitual PA, although the combined treatment group engaged in approximately 8–9 more minutes of Mod–Vig activity per day at the 18-month follow-up compared to the other treatment arms.
We took advantage of the 18-month interventions to examine temporal relationships between PA and inflammation and fatigue. In correlation analyses, using data collapsed across treatment groups, participants with larger individual declines in both CRP and IL-6 had greater improvements in their SF-36 Vitality score (indicative of less fatigue), independent of treatment group and demographic charac-teristics. Importantly, those with larger declines in IL-6 and greater decreases in fatigue were those that exhibited a greater increase in number of steps/d and PAEE. Thus, it appears that the cycle between inflammation and propensity to move throughout the day may have been “disrupted” in those who experienced a larger decrease in inflam-mation. Of course, since, to our knowledge, these are the first data to show a longitudinal association of individual changes in habitual PA with changes in inflammation, additional research is needed to con-firm that treating or lowering inflammation per se will result in less fatigue and greater habitual movement among older adults.
The results of this study need to be interpreted in light of the limitations to our study design, subject sample, and assessments. First, this was a retrospective analysis of existing data from a study that was designed for a separate purpose. Therefore, the findings are limited to middle-aged and older adults who were overweight or obese and had knee osteoarthritis, but were otherwise fairly healthy and functional. Also, there was no non-intervention control group that did not undergo either a diet or exercise intervention. Thus, we are not able to definitively determine the effects of either the dietary weight loss or exercise intervention on study outcomes; but can only determine the effects of the combination of diet plus exercise compared to either treatment alone. The measures of inflammation were limited to two biomarkers. The fatigue measure available in this study, the SF-36 Vitality sub-score, is a commonly used meas-ure, but is not specific for older adults. Also, it does not incorporate the construct of fatigability, or fatigue in the context of a standard-ized task, that accounts for the concept of self-pacing in order to lower exertion or activity to reduce perceived fatigue. Finally, there are other factors that we were unable to measure, including diet, comorbid disease, medication use, etc., which can affect PA, inflam-mation and fatigue and may have confounded the associations we observed.
Table 3. Pearson Correlations Among 6- and 18-Month Changes in the SF-36 Vitality Score, Inflammation, and Physical Activity
N Steps/d PAEE Light PA Mod–Vig PA Log CRP Log IL-6
SF-36 Vitality score 6-monthΔ 87 0.41 (p < .01) 0.40 (p < .01) 0.24 (p < .05) 0.39 (p < .01) −0.28 (p = .01) −0.29 (p = .01) 18-monthΔ 39 0.34(p < .05) 0.30 (p = .08) 0.24 (p = .17) 0.37 (p < .05) −0.14 (p = .43) −0.26 (p = .13)
Log CRP 6-monthΔ 88 −0.06 −0.01 −0.04 −0.05 — —
18-monthΔ 39 −0.04 0.03 −0.03 −0.14 — —
Log IL-6 6-monthΔ 88 −0.16 −0.16 −0.05 −0.12 — —
18-monthΔ 39 −0.32 (p = .07) −0.27 (p = .12) −0.36 (p < .05) −0.15 — —
Taken together, the results of this study advance our under-standing of the biological and psychosocial correlates of individ-ual variation in habitindivid-ual PA among middle-aged and older adults with obesity. Additional work is needed to determine whether increases in chronic inflammation with aging and chronic dis-ease directly contribute to aging-related incrdis-eases in fatigue, which in turn lead to less propensity to move and greater time spent in sedentary behavior with aging. Additional research is also needed to determine whether intervening to lower inflam-mation will result in less fatigue and sedentary behavior which would have major relevance for maintaining health and function in older adults.
Funding
This work was supported by an independent research grant from the National Institutes of Health (R01 AR052528), as well as the Wake Forest University Claude D. Pepper Center Older Americas Independence Center (P30-AG21332) and Wake Forest University General Clinical Research Center (M01-RR07122); and General Nutrition Centers, Inc.
Conflict of Interest
None to declare.
References
1. Westerterp KR. Daily physical activity and ageing. Curr Opin Clin Nutr Metab Care. 2000;3:485–488.
2. Madden KM, Ashe MC, Chase JM. Activity profile and energy expenditure among active older adults, British Columbia, 2011-2012. Prev Chronic Dis. 2015;12:E112. doi:10.5888/pcd12.150100
3. Ingram DK. Age-related decline in physical activity: generalization to non-humans. Med Sci Sports Exerc. 2000;32:1623–1629.
4. Chmelo E, Nicklas B, Davis C, Miller GD, Legault C, Messier S. Physical activity and physical function in older adults with knee osteoarthritis. J Phys Act Health. 2013;10:777–783.
5. Gennuso KP, Gangnon RE, Matthews CE, Thraen-Borowski KM, Col-bert LH. Sedentary behavior, physical activity, and markers of health in older adults. Med Sci Sports Exerc. 2013;45:1493–1500. doi:10.1249/ MSS.0b013e318288a1e5
6. Santos DA, Silva AM, Baptista F, et al. Sedentary behavior and physical activity are independently related to functional fitness in older adults. Exp Gerontol. 2012;47:908–912. doi:10.1016/j.exger.2012.07.011
7. Avlund K. Fatigue in older adults: an early indicator of the aging process?
Aging Clin Exp Res. 2010;22:100–115.
8. Cheng H, Gurland BJ, Maurer MS. Self-reported lack of energy (anergia) among elders in a multiethnic community. J Gerontol A Biol Sci Med Sci. 2008;63:707–714.
9. Junghaenel DU, Christodoulou C, Lai JS, Stone AA. Demographic cor-relates of fatigue in the US general population: results from the patient-reported outcomes measurement information system (PROMIS) initiative. J Psychosom Res. 2011;71:117–123. doi:10.1016/j.jpsychores.2011.04.007 10. O’Connor PJ, Puetz TW. Chronic physical activity and feelings of energy
and fatigue. Med Sci Sports Exerc. 2005;37:299–305.
11. Puetz TW. Physical activity and feelings of energy and fatigue: epidemio-logical evidence. Sports Med. 2006;36:767–780.
12. Moreh E, Jacobs JM, Stessman J. Fatigue, function, and mortality in older adults. J Gerontol A Biol Sci Med Sci. 2010;65:887–895. doi:10.1093/ gerona/glq064
13. Resnick HE, Carter EA, Aloia M, Phillips B. Cross-sectional relationship of reported fatigue to obesity, diet, and physical activity: results from the third national health and nutrition examination survey. J Clin Sleep Med. 2006;2:163–169.
14. Silva JP, Pereira DS, Coelho FM, Lustosa LP, Dias JM, Pereira LS. Clinical, functional and inflammatory factors associated with muscle fatigue and self-perceived fatigue in elderly community-dwelling women. Rev Bras Fisioter. 2011;15:241–248.
15. Valentine RJ, Woods JA, McAuley E, Dantzer R, Evans EM. The associations of adiposity, physical activity and inflammation with fatigue in older adults.
Brain Behav Immun. 2011;25:1482–1490. doi:10.1016/j.bbi.2011.06.002 16. Egerton T, Chastin SF, Stensvold D, Helbostad JL. Fatigue may contribute
to reduced physical activity among older people: an observational study. J Gerontol A Biol Sci Med Sci. 2016;71:670–676. doi:10.1093/gerona/glv150 17. Ward-Ritacco CL, Adrian AL, O’Connor PJ, et al. Feelings of energy are
associated with physical activity and sleep quality, but not adiposity, in middle-aged postmenopausal women. Menopause. 2015;22:304–311. doi:10.1097/GME.0000000000000315
18. Dantzer R, Heijnen CJ, Kavelaars A, Laye S, Capuron L. The neuroim-mune basis of fatigue. Trends Neurosci. 2014;37:39–46. doi:10.1016/j. tins.2013.10.003
19. Bower JE, Lamkin DM. Inflammation and cancer-related fatigue: mecha-nisms, contributing factors, and treatment implications. Brain Behav Immun. 2013;30(Suppl):S48–S57. doi:10.1016/j.bbi.2012.06.011 20. Johansson P, Riegel B, Svensson E, et al. Sickness behavior in
community-dwelling elderly: associations with impaired cardiac function and inflamma-tion. Biol Res Nurs. 2014;16:105–113. doi:10.1177/1099800412466170 21. Lasselin J, Layé S, Dexpert S, et al. Fatigue symptoms relate to systemic
inflammation in patients with type 2 diabetes. Brain Behav Immun. 2012;26:1211–1219. doi:10.1016/j.bbi.2012.03.003
22. Nash SD, Cruickshanks KJ, Klein R, et al. Long-term variability of inflam-matory markers and associated factors in a population-based cohort. J Am Geriatr Soc. 2013;61:1269–1276. doi:10.1111/jgs.12382
23. Ferrucci L, Corsi A, Lauretani F, et al. The origins of age-related proinflam-matory state. Blood. 2005;105:2294–2299.
24. Franceschi C, Capri M, Monti D, et al. Inflammaging and anti-inflammag-ing: a systemic perspective on aging and longevity emerged from studies in humans. Mech Ageing Dev. 2007;128:92–105.
25. Singh T, Newman AB. Inflammatory markers in population studies of aging. Ageing Res Rev. 2011;10:319–329. doi:10.1016/j.arr.2010.11.002 26. Penninx BW, Kritchevsky SB, Newman AB, et al. Inflammatory mark-ers and incident mobility limitation in the elderly. J Am Geriatr Soc. 2004;52:1105–1113.
27. Cho HJ, Kivimäki M, Bower JE, Irwin MR. Association of C-reactive protein and interleukin-6 with new-onset fatigue in the Whitehall II pro-spective cohort study. Psychol Med. 2013;43:1773–1783. doi:10.1017/ S0033291712002437
28. Bautmans I, Gorus E, Njemini R, Mets T. Handgrip performance in rela-tion to self-perceived fatigue, physical funcrela-tioning and circulating IL-6 in elderly persons without inflammation. BMC Geriatr. 2007;7:5.
29. Messier SP, Mihalko SL, Legault C, et al. Effects of intensive diet and exercise on knee joint loads, inflammation, and clinical outcomes among overweight and obese adults with knee osteoarthritis: the IDEA randomized clinical trial. JAMA. 2013;310:1263–1273. doi:10.1001/ jama.2013.277669
30. Ware JE Jr, Sherbourne CD. The MOS 36-item short-form health sur-vey (SF-36). I. Conceptual framework and item selection. Med Care. 1992;30:473–483.
31. Van RH, Giavedoni S, Raste Y, et al. Validity of activity monitors in health and chronic disease: a systematic review. Int J Behav Nutr Phys Act. 2012;9:84. doi:10.1186/1479-5868-9-84
32. Kumahara H, Schutz Y, Ayabe M, et al. The use of uniaxial accelerom-etry for the assessment of physical-activity-related energy expenditure: a validation study against whole-body indirect calorimetry. Br J Nutr. 2004;91:235–243.
33. Woloshin S, Schwartz LM. Distribution of C-reactive protein values in the United States. N Engl J Med. 2005;352:1611–1613.
34. Abramson JL, Vaccarino V. Relationship between physical activity and inflammation among apparently healthy middle-aged and older US adults.
35. Nicklas BJ, You T, Pahor M. Behavioural treatments for chronic systemic inflammation: effects of dietary weight loss and exercise training. CMAJ. 2005;172:1199–1209.
36. Adams SA, Wirth MD, Khan S, et al. The association of C-reactive protein and physical activity among a church-based population of African Ameri-cans. Prev Med. 2015;77:137–140. doi:10.1016/j.ypmed.2015.05.010 37. Plaisance EP, Grandjean PW. Physical activity and high-sensitivity
C-reac-tive protein. Sports Med. 2006;36:443–458.
38. Hawkins M, Belalcazar LM, Schelbert KB, Richardson C, Ballantyne CM, Kriska A. The effect of various intensities of physical activity and chronic inflammation in men and women by diabetes status in a national sample. Diabetes Res Clin Pract. 2012;97:e6–e8. doi:10.1016/j.dia-bres.2012.03.019
39. Henson J, Yates T, Biddle SJ, et al. Associations of objectively measured sedentary behaviour and physical activity with markers of cardiometabolic health. Diabetologia. 2013;56:1012–1020. doi:10.1007/s00125-013-2845-9
40. Gennuso KP, Gangnon RE, Matthews CE, Thraen-Borowski KM, Col-bert LH. Sedentary behavior, physical activity, and markers of health in older adults. Med Sci Sports Exerc. 2013;45:1493–1500. doi:10.1249/ MSS.0b013e318288a1e5
41. Leon-Latre M, Moreno-Franco B, Andres-Esteban EM, et al. Sedentary lifestyle and its relation to cardiovascular risk factors, insulin resistance and inflammatory profile. Rev Esp Cardiol (Engl Ed). 2014;67:449– 455. doi:10.1016/j.rec.2013.10.015
42. Beavers KM, Beavers DP, Newman JJ, et al. Effects of total and regional fat loss on plasma CRP and IL-6 in overweight and obese, older adults with knee osteoarthritis. Osteoarthritis Cartilage. 2015;23:249–256. doi:10.1016/j.joca.2014.11.005