ARTICLE
Exome Genotyping Identifies Pleiotropic Variants
Associated with Red Blood Cell Traits
Nathalie Chami,1,2,91 Ming-Huei Chen,3,91 Andrew J. Slater,4,5,91 John D. Eicher,3
Evangelos Evangelou,6,7 Salman M. Tajuddin,8 Latisha Love-Gregory,9 Tim Kacprowski,10,11
Ursula M. Schick,12 Akihiro Nomura,13,14,15,16,17 Ayush Giri,18 Samuel Lessard,1,2 Jennifer A. Brody,19 Claudia Schurmann,12,20 Nathan Pankratz,21 Lisa R. Yanek,22 Ani Manichaikul,23 Raha Pazoki,24 Evelin Mihailov,25 W. David Hill,26,27 Laura M. Raffield,28 Amber Burt,29 Traci M. Bartz,30
Diane M. Becker,22 Lewis C. Becker,31 Eric Boerwinkle,32,33 Jette Bork-Jensen,34 Erwin P. Bottinger,12 Michelle L. O’Donoghue,35David R. Crosslin,36 Simon de Denus,2,37 Marie-Pierre Dube´,1,2 Paul Elliott,6 Gunnar Engstro¨m,38,39 Michele K. Evans,8 James S. Floyd,19 Myriam Fornage,40 He Gao,6
Andreas Greinacher,41 Vilmundur Gudnason,42,43 Torben Hansen,34 Tamara B. Harris,44 Caroline Hayward,45 Jussi Hernesniemi,46,47,48 Heather M. Highland,32,49
(Author list continued on next page)
Red blood cell (RBC) traits are important heritable clinical biomarkers and modifiers of disease severity. To identify coding genetic variants associated with these traits, we conducted meta-analyses of seven RBC phenotypes in 130,273 multi-ethnic individuals from studies genotyped on an exome array. After conditional analyses and replication in 27,480 independent individuals, we identified 16 new RBC variants. We found low-frequency missense variants inMAP1A(rs55707100, minor allele frequency [MAF]¼3.3%, p¼ 231010for hemoglobin [HGB]) andHNF4A(rs1800961, MAF¼2.4%, p<33108for hematocrit [HCT] and HGB). In African Amer-icans, we identified a nonsense variant inCD36associated with higher RBC distribution width (rs3211938, MAF¼8.7%, p¼731011) and showed that it is associated with lowerCD36expression and strong allelic imbalance in ex vivo differentiated human erythroblasts. We also identified a rare missense variant inALAS2(rs201062903, MAF¼0.2%) associated with lower mean corpuscular volume and mean corpuscular hemoglobin (p<83109). Mendelian mutations inALAS2are a cause of sideroblastic anemia and erythropoietic protoporphyria. Gene-based testing highlighted three rare missense variants inPKLR, a gene mutated in Mendelian non-spherocytic hemolytic anemia, associated with HGB and HCT (SKAT p<83107). These rare, low-frequency, and common RBC variants showed pleiotropy, being also associated with platelet, white blood cell, and lipid traits. Our association results and functional annotation sug-gest the involvement of new genes in human erythropoiesis. We also confirm that rare and low-frequency variants play a role in the architecture of complex human traits, although their phenotypic effect is generally smaller than originally anticipated.
Introduction
One in four cells in the human body is a mature enucleated red blood cell (RBC), also called an erythrocyte. RBC mean
lifespan in adults is 100–120 days, requiring constant renewal. To that end, we produce on average 2.4 million RBCs per second in the bone marrow. This massive yet well-orchestrated cell proliferation process is necessary to
1Department of Medicine, Universite´ de Montre´al, Montre´al, QC H3T 1J4, Canada;2Montreal Heart Institute, Montre´al, QC H1T 1C8, Canada;3Population Sciences Branch, National Heart, Lung, and Blood Institute, The Framingham Heart Study, Framingham, MA 01702, USA;4Genetics Target Sciences, GlaxoSmithKline, Research Triangle Park, NC 27709, USA;5OmicSoft Corporation, Cary, NC 27513, USA;6Department of Epidemiology and Biostatistics, MRC-PHE Centre for Environment and Health, School of Public Health, Imperial College London, London W2 1PG, UK;7Department of Hygiene and Epidemiology, University of Ioannina Medical School, Ioannina 45110, Greece;8Laboratory of Epidemiology and Population Sciences, National Institute on Aging, NIH, Baltimore, MD 21224, USA;9Department of Medicine, Center of Human Nutrition, Washington University School of Medicine, St Louis, MO 63110, USA;10Department of Functional Genomics, Interfaculty Institute for Genetics and Functional Genomics, University Medicine, Greifswald and Ernst-Mortiz-Arndt University Greifswald, Greifswald 17475, Germany;11DZHK (German Centre for Cardiovascular Research), partner site Greifswald, Greifswald QA, Germany;12The Charles Bronfman Institute for Personalized Medicine, Icahn School of Medicine at Mount Sinai, New York, NY 10069, USA;13Center for Human Genetic Research, Massachusetts General Hospital, Boston, MA 02114, USA;14Program in Medical and Population Genetics, Broad Institute, Cambridge, MA 02142, USA;15Cardiovascular Research Center, Massachusetts General Hospital, Boston, MA 02114, USA;16Department of Medicine, Harvard Medical School, Boston, MA 02115, USA;17Division of Cardiovascular Medicine, Kanazawa University, Graduate School of Medical Science, Kanazawa, Ishikawa 9200942, Japan;18Division of Epidemiology, Department of Medicine, Institute for Medicine and Public Health, Vanderbilt Genetics Institute, Vanderbilt University, Nashville, TN 37235, USA;19Department of Medicine, University of Washington, Seattle, WA 98101, USA; 20The Genetics of Obesity and Related Metabolic Traits Program, Icahn School of Medicine at Mount Sinai, New York, NY 10069, USA;21Department of Laboratory Medicine and Pathology, University of Minnesota, Minneapolis, MN 55454, USA;22Department of Medicine/Division of General Internal Med-icine, Johns Hopkins University, School of MedMed-icine, Baltimore, MD 21205, USA;23Center for Public Health Genomics, University of Virginia, Charlottes-ville, VA 22908, USA;24Department of Epidemiology, Erasmus, MC Rotterdam 3000, the Netherlands;25Estonian Genome Center, University of Tartu, Tartu 51010, Estonia;26Centre for Cognitive Ageing and Cognitive Epidemiology, University of Edinburgh, Edinburgh EH8 9JZ, UK;27Department of Psychology, University of Edinburgh, Edinburgh EH8 9JZ, UK;28Department of Genetics, University of North Carolina, Chapel Hill, NC 27514, USA;29Division of Med-ical Genetics, Department of Medicine, University of Washington, Seattle, WA 98195, USA;30Department of Biostatistics, University of Washington,
(Affiliations continued on next page)
8 The American Journal of Human Genetics99, 8–21, July 7, 2016
accommodate RBCs’ main function: to transport oxygen from the lungs to the peripheral organs, and carbon diox-ide from the organs to the lungs. Hemoglobin (HGB), the metalloprotein that constitutes by far the most abundant
biomolecule found in mature RBCs, is responsible for oxygen transport. In addition to their critical role in the circulatory system, RBCs also have secondary, often less-appreciated, functions. Within blood vessels, they respond
Seattle, WA 98195, USA;31Department of Medicine/Divisions of Cardiology and General Internal Medicine, Johns Hopkins University School of Medicine, Baltimore, MD 21205, USA;32Human Genetics Center, School of Public Health, University of Texas Health Science Center at Houston, Houston, TX 77030, USA;33Human Genome Sequencing Center, Baylor College of Medicine, Houston, TX 77030, USA;34The Novo Nordisk Foundation, Center for Basic Meta-bolic Research, Faculty of Health and Medical Sciences, University of Copenhagen, Copenhagen 2100, Denmark;35TIMI Study Group, Cardiovascular Division, Brigham and Women’s Hospital, Boston, MA 02115, USA;36Department of Biomedical Informatics and Medical Education, University of Wash-ington, Seattle, WA 98195, USA;37Faculty of Pharmacy, Universite´ de Montre´al, Montre´al, QC H3T 1J4, Canada;38Department of Clinical Sciences, Malmo¨, Lund University, Malmo¨ 221 00, Sweden;39Ska˚ne University Hospital, Malmo¨ 222 41, Sweden;40Institute of Molecular Medicine, The University of Texas Health Science Center at Houston, Houston, TX 77030, USA;41Institute for Immunology and Transfusion Medicine, University Medicine Greifswald, Greifswald 17475, Germany;42Icelandic Heart Association, 201 Kopavogur, Iceland;43Faculty of Medicine, University of Iceland, 101 Reykjavik, Iceland; 44Laboratory of Epidemiology, Demography, and Biometry, National Institute on Aging, Intramural Research Program, NIH, Bethesda, MD 20892, USA; 45MRC Human Genetics Unit, Institute of Genetics and Molecular Medicine, University of Edinburgh, Edinburgh EH4 2XU, UK;46Department of Clinical Chemistry, Fimlab Laboratories, Tampere 33520, Finland;47Department of Clinical Chemistry, University of Tampere School of Medicine, Tampere 33014, Finland;48University of Tampere, School of Medicine, Tampere 33014, Finland;49Department of Epidemiology, University of North Carolina at Chapel Hill, Chapel Hill, NC 27514, USA;50Department of Endocrinology, Boston Children’s Hospital, Boston, MA 02115, USA;51Department of Epidemiology, Harvard TH Chan School of Public Health, Boston, MA 02115, USA;52Department of Epidemiology, School of Public Health, University of Alabama at Bir-mingham, BirBir-mingham, AL 35233, USA;53Department of Clinical Physiology, Tampere University Hospital, Tampere 33521, Finland;54Department of Clinical Physiology, University of Tampere School of Medicine, Tampere 33014, Finland;55Departments of Genetics and Biostatistics, University of North Carolina at Chapel Hill, Chapel Hill, NC 27599, USA;56Department of Medicine, Division of Cardiovascular Medicine, Stanford University, School of Med-icine, Palo Alto, CA 94305, USA;57Research Centre for Prevention and Health, The Capital Region of Denmark, Copenhagen 2600, Denmark;58Department of Clinical Experimental Research, Rigshospitalet, Glostrup 2100, Denmark;59Department of Clinical Medicine, Faculty of Health and Medical Sciences, University of Copenhagen, Copenhagen 2200, Denmark;60Center for Human Genetics, Division of Public Health Sciences, Wake Forest School of Medi-cine, Winston-Salem, NC 27157, USA;61Department of Medicine, Divisions of Allergy and Clinical Immunology and General Internal Medicine, Johns Hopkins University School of Medicine, Baltimore, MD 21205, USA;62Laboratory of Neurogenetics, National Institute on Aging, NIH, Bethesda, MD 20892, USA;63Department of Genome Sciences, University of Washington, Seattle, WA 98105, USA;64Department of Cardiology, Heart Center, Tam-pere University Hospital, TamTam-pere 33521, Finland;65Cardiology Section and Center for Population Genomics, Boston Veteran’s Administration (VA) Healthcare, Boston, MA 02118, USA;66Institute of Clinical Chemistry and Laboratory Medicine, University Medicine Greifswald, Greifswald 17475, Germany;67Cardiovascular Health Research Unit, Departments of Medicine Epidemiology and Health Services, University of Washington, Seattle, WA 98101, USA;68Group Health Research Institute, Group Health Cooperative, Seattle, WA 98101, USA;69Department of Clinical Physiology and Nuclear Med-icine, Turku University Hospital, Turku 20521, Finland;70Research Centre of Applied and Preventive Cardiovascular Medicine, University of Turku, Turku 20520, Finland;71Department of Internal Medicine, Erasmus MC, Rotterdam 3000, the Netherlands;72Netherlands Consortium for Healthy Ageing (NCHA), Rotterdam 3015, the Netherlands;73Institute for Translational Genomics and Population Sciences, Los Angeles Biomedical Research Institute, Tor-rance, CA 90502, USA;74Department of Pediatrics, Harbor-UCLA Medical Center, Torrance, CA 90502, USA;75Alzheimer Scotland Research Centre, Edin-burgh EH8 9JZ, UK;76Institute for Community Medicine, University Medicine Greifswald, Greifswald 17475, Germany;77Departments of Pathology and Laboratory Medicine and Biochemistry, University of Vermont College of Medicine, Colchester, VT 05446, USA;78Departments of Medicine and Pathology, University of Vermont College of Medicine, Burlington, VT 05405, USA;79Department of Family Population and Preventive Medicine, Stony Brook Uni-versity, Stony Brook, NY 11794, USA;80Vanderbilt Epidemiology Center, Department of Obstetrics & Gynecology, Institute for Medicine and Public Health, Vanderbilt Genetics Institute, Vanderbilt University, Nashville, TN 37203, USA;81Department of Medical Sciences, Cardiology and Uppsala Clinical Research Center, Uppsala University, Uppsala 751 85, Sweden;82Genetics Target Sciences, GlaxoSmithKline, King of Prussia, PA 19406, USA;83Green Lane Cardiovascular Service, Auckland City Hospital and University of Auckland, Auckland 1142, New Zealand;84Department of Physiology and Biophysics, University of Mississippi Medical Center, Jackson, MS 39216, USA;85The Mindich Child Health and Development Institute, Icahn School of Medicine at Mount Sinai, New York, NY 10069, USA;86Department of Anesthesiology & Critical Care Medicine, Johns Hopkins University School of Medicine, Baltimore, MD 21205, USA;87Departments of Internal Medicine and Human Genetics, University of Michigan, Ann Arbor, MI 48108, USA; 88Zilber School of Public Health, University of Wisconsin-Milwaukee, Milwaukee, WI 53205, USA;89Department of Epidemiology, University of Washing-ton, Seattle, WA 98195, USA;90Division of Public Health Sciences, Fred Hutchinson Cancer Research Center, Seattle, WA 98109, USA
91These authors contributed equally to this work
*Correspondence:[email protected](A.P.R.),[email protected](G.L.) http://dx.doi.org/10.1016/j.ajhg.2016.05.007.
Joel N. Hirschhorn,14,50Albert Hofman,24,51Marguerite R. Irvin,52Mika Ka¨ho¨nen,53,54Ethan Lange,55 Lenore J. Launer,44Terho Lehtima¨ki,46,47Jin Li,56David C.M. Liewald,26,27Allan Linneberg,57,58,59 Yongmei Liu,60Yingchang Lu,12,20Leo-Pekka Lyytika¨inen,46,47Reedik Ma¨gi,25Rasika A. Mathias,61 Olle Melander,38,39Andres Metspalu,25Nina Mononen,46,47Mike A. Nalls,62Deborah A. Nickerson,63 Kjell Nikus,48,64Chris J. O’Donnell,3,65Marju Orho-Melander,38,39Oluf Pedersen,34Astrid Petersmann,66 Linda Polfus,32Bruce M. Psaty,67,68Olli T. Raitakari,69,70Emma Raitoharju,46,47Melissa Richard,40 Kenneth M. Rice,30Fernando Rivadeneira,24,71,72Jerome I. Rotter,73,74Frank Schmidt,10
Albert Vernon Smith,42,43John M. Starr,26,75Kent D. Taylor,73,74Alexander Teumer,76Betina H. Thuesen,57 Eric S. Torstenson,18Russell P. Tracy,77Ioanna Tzoulaki,6,7Neil A. Zakai,78Caterina Vacchi-Suzzi,79
Cornelia M. van Duijn,24Frank J.A. van Rooij,24Mary Cushman,78Ian J. Deary,26,27
Digna R. Velez Edwards,80Anne-Claire Vergnaud,6Lars Wallentin,81Dawn M. Waterworth,82
Harvey D. White,83James G. Wilson,84Alan B. Zonderman,8Sekar Kathiresan,13,14,15,16Niels Grarup,34 To˜nu Esko,14,25Ruth J.F. Loos,12,20,85Leslie A. Lange,28Nauder Faraday,86Nada A. Abumrad,9
Todd L. Edwards,18Santhi K. Ganesh,87,91Paul L. Auer,88,91Andrew D. Johnson,3,91 Alexander P. Reiner,89,90,91,*and Guillaume Lettre1,2,91,*
to shear stress and produce the vasodilator nitric oxide to regulate vascular tonus.1RBCs participate in antimicrobial strategies to fight hemolytic pathogens2and in the inflam-matory response, acting as a reservoir for multiple chemo-kines.3 Furthermore, the direct involvement of RBCs in adhering to the vascular endothelium or supporting thrombin generation may help to promote blood coagula-tion or thrombosis.4,5
Given the paramount importance of RBCs in physi-ology, it is not surprising that monitoring their features is common practice in medicine to assess the overall health of patients. An excessive number of circulating RBCs (erythrocytosis [MIM: 133100]) can suggest a pri-mary bone marrow disease, a myeloproliferative neoplasm such as polycythemia vera (MIM: 263300), or chronic hypoxemia due to congenital heart defects. Low HGB concentration and hematocrit (HCT) levels (anemia) can indicate inherited HGB or RBC structural gene mutations, malnutrition, or kidney diseases. By considering the vol-ume (mean corpuscular volvol-ume [MCV]), hemoglobin con-tent (mean corpuscular hemoglobin [MCH] and mean corpuscular hemoglobin concentration [MCHC]) or the distribution width (RDW) of RBCs, a physician can distin-guish between the different causes of anemia (e.g., micro-cytic/hypochromic due to iron deficiency6). In addition, epidemiological studies have correlated high RDW values with a worse prognosis in heart failure patients.7RDW is also an independent predictor of overall mortality in healthy individuals, as well as a predictor of mortality in patients with various conditions such as cardiovascular diseases, obesity, malignancies, and chronic kidney dis-ease.8–12
RBC count and indices vary among individuals, and 40%–90% of this phenotypic variation is heritable.13–16 Identifying the genes and biological pathways that contribute to this inter-individual variation in RBC traits could highlight modifiers of severity and/or therapeutic options for several hematological diseases. Already, large-scale genome-wide association studies (GWASs) have found dozens of SNPs associated with one or more of these RBC traits.17,18 However, owing to their design, GWASs are largely insensitive to rare (minor allele fre-quency [MAF]< 1%) and low-frequency (1% % MAF < 5%) genetic variants. Using an exome array, we previously performed an association study for HGB and HCT in 31,340 European-ancestry individuals and identified rare coding or splice site variants in the erythropoietin and
b-globin genes.19 Within the framework of the Blood-Cell Consortium (BCX),20,21we now report a larger geno-typing-based exome survey of seven RBC traits conducted in up to 130,273 individuals, including 23,896 partici-pants of non-European ancestry. With this experiment, our initial goals were to expand the list of rare and low-frequency coding or splice site variants associated with RBC traits and to explore whether the exome array can complement the GWAS approach to fine map RBC causal genes.
Subjects and Methods
Study Participants
The Blood-Cell Consortium (BCX) aims to identify novel common and rare variants associated with blood-cell traits using an exome array. BCX is comprised of more than 134,021 participants from 24 discovery cohorts and five ancestries: European, African Amer-ican, Hispanic, East Asian, and South Asian. Detailed description of the participating cohorts is provided inTable S1. BCX is inter-ested in the genetics of all main hematological measures and is divided into three main working groups: RBC, white blood cell (WBC),21 and platelet (PLT).20For the RBC working group, we
analyzed seven traits available in up to 130,273 individuals: RBC count (31012/L), HGB (g/dL), HCT (%), MCV (fL), MCH (pg), MCHC (g/dL), and RDW (%) (Table S2). The BCX procedures were in accordance with the institutional and national ethical standards of the responsible committees and proper informed consent was obtained.
Genotyping and Quality-Control Steps
Participants from the different studies were genotyped on one of the following exome chip genotyping arrays: Illumina Exome-Chip v.1.0, Illumina ExomeExome-Chip v.1.1_A, Illumina ExomeExome-Chip- ExomeChip-12 v.1.1, Affymetrix Axiom Biobank Plus GSKBB1, or Illumina HumanOmniExpressExome Chip. Genotypes were then called either (1) with the Illumina GenomeStudio GENCALL and subse-quently recalled using zCALL or (2) by the Cohorts for Heart and Aging Research in Genomic Epidemiology (CHARGE) Consortium Exome Chip effort22(Table S3). The same quality-control steps
were followed by each participating study. We excluded variants with low genotyping success rate (<95%, except for WHI that used a cutoff<90%) (Table S3). Samples with call rate <95% (except for SOLID-TIMI 52 and STABILITY that used 94.5% and 93.5% cutoffs, respectively) after joint or zCALL calling and with outlying heterozygosity rate were also excluded. Other exclusions were deviation from Hardy-Weinberg equilibrium (p<13106) and gender mismatch. We performed principal-component anal-ysis (PCA) or multidimensional scaling (MDS) and excluded sam-ple outliers from the resulting plots through visual inspection, using populations from the 1000 Genomes Project to anchor these analyses. Keeping only autosomal and X chromosome variants for the analysis, we aligned all variants on the forward strand and created a uniform list of reference alleles using the --force alleles command in PLINK.23Finally, an indexed variant call format file (VCF) was created by each study and checked for allele alignment and any allele or strand flips using the checkVCF package.24Prior to performing meta-analyses of the association results provided by each participating study, we ran the EasyQC protocol25to check for population allele frequency deviations and proper trait trans-formation in each cohort.
Phenotype Modeling and Association Analyses
When possible, we excluded individuals with blood cancer, leuke-mia, lymphoma, bone marrow transplant, congenital or heredi-tary anemia, HIV, end-stage kidney disease, dialysis, splenectomy, or cirrhosis and those with extreme measurements of RBC traits
(Table S1). We also excluded individuals on erythropoietin
treat-ment or chemotherapy. Additionally, we excluded pregnant women and individuals with acute medical illness at the time the complete blood count (CBC) was done. For the seven RBC traits, within each study, we adjusted for age, age-squared, gender,
the first ten principal components, and, where applicable, other study-specific covariates such as study center via a linear regres-sion model. Within each study, we then applied inverse normal transformation on the residuals and tested the phenotypes for as-sociation with the ExomeChip variants using either RVtests (v.20140416)26or RAREMETALWORKER.0.4.9.27
Discovery Meta-analyses
Score files generated by RVtests or RAREMETALWORKER from each participating study were used to carry out meta-analyses of the single variant association results using RareMETALS v.5.9.28
All analyses were performed separately in each of European American (EA) and African American (AA) ancestries. In the multi-ancestry meta-analyses, we combined individuals of Euro-pean, African American, Hispanic, East-Asian, and South-Asian an-cestries (All). We included variants with allele frequency difference between the highest and lowest MAF<0.3 for EA and AA ances-tries and<0.6 for the combined ancestry meta-analyses. For the gene-based analyses, we used score files and variance-covariance matrices from the study-specific association results and applied the sequence kernel association test (SKAT)29 and variable
threshold (VT) algorithms30 in RareMETALS considering only
missense, nonsense, and splice site variants with a MAF<1%. Gene-based analyses were also stratified by ancestry. Significance thresholds were determined using Bonferroni correction assuming ~250,000 independent variants (p< 2 3 107 for the single-variant analyses) and ~17,000 genes tested on the ExomeChip (p<33106for the gene-based tests).
Conditional Analysis and Replication
In order to identify independent signals, we performed tional analyses. In each round of conditional analysis, we condi-tioned on the most significant single variant in a 1 Mb window. These conditional analyses were performed at the meta-analysis level using RareMETALS. We repeated this step until there were no new signals identified in each region, defined as p< 23107. We then checked for linkage disequilibrium (LD) within the list of variants that was retained from the conditional analyses. For variants that were in moderate-to-strong LD (r2R0.3), we kept the most significant. We attempted replication of the final list of independent variants in eight additional studies that contributed a total of 27,480 individuals (n¼21,473 for EA and n¼6,007 for AA) (Table S4). The division of discovery and replication sam-ples was dictated by timing because we collected all groups we were aware of for initial discovery and then found others who could participate only much later and hence were used for replica-tion. These studies followed similar analytical procedures and steps as those followed by the discovery analysis (see above). A joint meta-analysis of the discovery and the replication results was carried out using a fixed-effects model and inverse-variance weighting as implemented in METAL.31We considered as
repli-cated markers those with a nominal preplication<0.05 and an effect on phenotype in the same direction as in the discovery results.
Allelic Imbalance and Expression ofCD36
We checked for allelic imbalance (AI) of the rs3211938 variant in CD36(MIM: 173510) as well as the expression of the gene in 12 samples of fetal liver erythroblasts obtained from anonymous do-nors. Details on the protocol including RNA extraction and sequencing can be found elsewhere.32 We calculated the difference in the ratio of reads of the reference allele (T) and the
alternate allele (G) of rs3211938. In brief, reads overlapping rs3211938 were counted with samtools (v.1.1) mpileup software using genome build hg19. We kept uniquely mapping reads using -q 50 argument (mapping quality > 50) and sites with base quality>10. Statistical significance of the difference in the ratio of reads between the reference allele and the alternate allele was assessed with a binomial test. For each sample, we summed all reads overlapping all heterozygous SNPs and calculated the ex-pected ratio within each SNP allele combination. Reads that fall in the top 25thcoverage percentile were down-sampled so that the highest covered sites do not bias the expected ratio.33 For
rs3211938, the expected T:G ratio was 0.507.
Expression Quantitative Trait Loci Analysis
We cross-referenced our list of RBC novel variants with more than 100 separate expression quantitative trait loci (eQTL) published datasets. Datasets were collected through publications, publically available sources, and private collaborations. A general overview of a subset of>50 eQTL studies has been published,34with specific citations for>100 datasets included in the current query followed here. A complete list of tissues and studies used can be found in the
Supplemental Data. We considered SNPs that are themselves
expression SNPs (eSNP) when they meet a p<0.0001 threshold or when they are in LD (r2>0.3) with the best eSNP (p<0.0001).
Results
Single-Variant Meta-analyses
We meta-analyzed ExomeChip results for seven RBC-related phenotypes (RBC count, HCT, HGB, MCH, MCHC, MCV, and RDW) available in up to 130,273 indi-viduals from 24 studies and 5 ancestries (Tables S1–S3
andFigure S1). Across these different phenotypes, a total of 226 variants reached exome-wide significance (p < 2 3 107) in the combined ancestry analyses (Figures 1
andS2). Given that some of these RBC traits are correlated (Figure S3), these associated variants highlight 71 different loci (defined using a 1 Mb interval). Overall, we observed only modest inflation of the test statistics (lGC¼ 1.03– 1.05), consistent with little confounding due to technical artifacts, population stratification, or cryptic relatedness.
In order to identify independent variants, we performed conditional analyses at the meta-analysis level adjusting for the effect of the most significant variant in a 1 Mb region in a stepwise manner (Subjects and Methods). After this analysis, we obtained a list of 126 indepen-dent variants associated with at least one RBC trait at p< 23107(Table S5). Selecting only variants that lie more than 1 Mb away from a known GWAS locus resulted in 23 independent variants located within 20 novel RBC loci, where novel is used to define loci not found in the ex-isting literature (Table 1). We attempted to replicate these 126 variants in 8 independent cohorts totaling 27,480 participants (Table S5). Overall, we observed a strong repli-cation, with 94 of the 126 variants showing consistent direction of effect between the discovery and replication analyses (binomial p¼33108;Table S5). Of the 23 novel RBC variants, we replicated 16 at nominal p<0.05 for at
least one RBC trait (binomial p¼331016;Table 1). Out of these 16 novel and replicated RBC variants, there are five missense variants, including two variants with MAF<5%
inMAP1A(MIM: 600178) andHNF4A(MIM: 600281) and
one nonsense variant inCD36 (Table 1). Among the re-maining nine novel and replicated RBC variants, there are five intronic, one synonymous, one 50UTR, and one in-tergenic marker (Table 1).
Prioritization of Candidate Genes and Genetic Variants
Our single-variant analyses in EA samples identified one rare missense variant inALAS2(MIM: 301300) associated with MCV and MCH (rs201062903, p.Pro507Leu [c.1559C>T], MAF ¼ 0.2%) (Table 1). The association with this variant did not replicate, potentially because of limited statistical power (the replication sample size for this rare marker was 5,044; see alsoDiscussion).ALAS2 en-codes 5-aminolevulinate synthase 2, the rate-controlling enzyme of erythroid heme synthesis. Additionally, rare mutations inALAS2 cause X-linked sideroblastic anemia (MIM: 300751) and erythropoietic protoporphyria (MIM: 300752). Thus, despite the lack of replication, ALAS2
remains an excellent candidate gene to modulate RBC traits. TheALAS2 p.Pro507Leu variant, which is not re-ported in the ClinVar database, maps between two amino acids (Tyr506 and Thr508) that are important for catalytic activity and known to be mutated in cases of sideroblastic anemia.35
Two low-frequency missense variants identified in our analyses implicate MAP1A and HNF4A in RBC biology (Table 1).MAP1Aencodes microtubule-associated protein 1A, a gene highly expressed in the nervous system and mostly studied in the context of neuronal diseases, although it is expressed in many additional tissues,
including hematopoietic cells.36 Deletion of MAP1A in the mouse causes defects in synaptic plasticity.37 This observation is interesting given that inactivation of
ANK1(MIM: 612641), another gene that encodes a cyto-skeleton protein and is expressed in neurons and RBCs, is associated with neurological dysfunction in the mouse and spherocytosis and hemolytic anemia in humans (MIM: 182900). Our meta-analyses confirmed two known independentANK1variants associated with MCHC: an in-tronic SNP (rs4737009, MAF ¼ 19.8%, p ¼ 1.3 3 108) and a low-frequency missense variant (rs34664882, p.Ala1462Val, MAF ¼ 2.9%, p¼ 1.7 31016) (Table S5; N.P., U.M.S., J.B.-J., and M.-H.C., unpublished data).17
In the accompanying BCX PLT article,20we report that
the same MAP1A rs55707100 allele (p.Pro2349Leu
[c.7046C>T]) associated here with decreased HGB concen-tration is also associated with increased PLT count. Further-more, recent studies have identified associations between rs55707100 and HDL-cholesterol and triglyceride levels (S. Mukherjee, 2015, ASHG, conference). Adding to the complexity, the GTEx dataset indicates that rs55707100 is an expression quantitative trait locus (eQTL) forADAL
(peQTL¼931011) but not forMAP1A.38ADALis a poorly characterized adenosine deaminase-like protein that is highly expressed in human erythroblasts. However, the eQTL association between rs55707100 and ADAL could simply reflect ‘‘LD shadowing’’ from nearby markers that are much stronger eQTL variants for ADAL. Indeed, rs3742971 (a common variant located inADAL’s 50UTR) is in partial LD with rs55707100 (r2 ¼ 0.18 in Eu-ropean populations from the 1000 Genomes Pro-ject) and strongly associated withADALexpression levels (peQTL¼631049).
The second low-frequency missense variant associated with HGB and HCT maps within the coding sequence of
Figure 1. Quantile-Quantile Plots of Single-Variant Association Results in the All Ancestry Meta-analyses for the Seven Red Blood Cell Traits Analyzed
(A) Distribution of the single variant results for all variants tested on the exome array. (B) Only markers with a minor allele frequency<5% are shown here.
(C) Variants outside of known RBC GWAS regions. Variants that are within 1 Mb from a previously published RBC GWAS locus were excluded for this QQ plot.
Abbreviations are as follows: HCT, hematocrit; HGB, hemoglobin; RBC, red blood cell count; MCV, mean corpuscular volume; MCHC, mean corpuscular hemoglobin concentration; MCH, mean corpuscular hemoglobin; RDW, red blood cell distribution width.
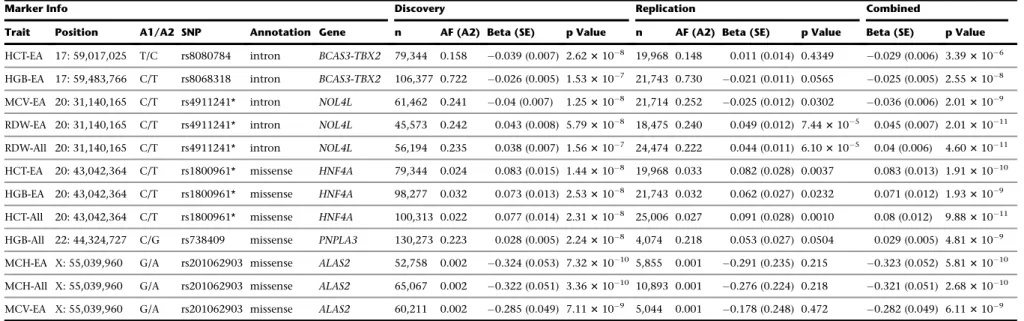
Table 1. Association Results of Variants in Novel Loci Associated with Red Blood Cell Traits
Marker Info Discovery Replication Combined
Trait Position A1/A2 SNP Annotation Gene n AF (A2) Beta (SE) p Value n AF (A2) Beta (SE) p Value Beta (SE) p Value
RDW-EA 1: 25,768,937 A/G rs10903129* intron TMEM57-RHD 45,573 0.544 0.037 (0.007) 1.193107 18,475 0.560 0.023 (0.011) 0.0373 0.033 (0.006) 2.413108 RDW-All 1: 25,768,937 A/G rs10903129* intron TMEM57-RHD 56,194 0.568 0.034 (0.006) 9.583108 24,474 0.600 0.021 (0.01) 0.0252 0.03 (0.005) 1.323108 HCT-All 1: 155,162,067 C/T rs4072037* synonymous MUC1 109,875 0.554 0.025 (0.005) 5.823108 25,006 0.563 0.038 (0.009) 5.963105 0.027 (0.004) 3.4731011 HGB-All 2: 27,741,237 T/C rs780094 intron GCKR 130,273 0.626 0.024 (0.004) 7.143108 3,162 0.626 0.012 (0.026) 0.6410 0.023 (0.044) 1.683107 RBC-All 2: 219,509,618 C/A rs2230115* missense ZNF142 74,488 0.509 0.033 (0.006) 9.743109 27,442 0.477 0.024 (0.01) 0.0167 0.031 (0.005) 7.1131010 HCT-All 3: 56,771,251 A/C rs3772219* missense ARHGEF3 109,875 0.338 0.028 (0.005) 2.383109 25,006 0.366 0.021 (0.01) 0.0292 0.027 (0.004) 2.5631010 HGB-All 3: 56,771,251 A/C rs3772219* missense ARHGEF3 130,273 0.336 0.026 (0.004) 3.763109 27,749 0.367 0.02 (0.009) 0.0331 0.025 (0.004) 4.3331010 HCT-EA 4: 88,008,782 G/A rs236985 intron AFF1 87,444 0.394 0.032 (0.005) 3.8931010 19,968 0.405 0.02 (0.011) 0.0626 0.03 (0.005) 1.1431010 RBC-EA 4: 88,008,782 G/A rs236985* intron AFF1 60,231 0.393 0.034 (0.006) 3.503108 21,435 0.405 0.023 (0.011) 0.0273 0.031 (0.005) 4.223109 HGB-EA 4: 88,030,261 G/T rs442177* intron AFF1 106,377 0.595 0.034 (0.005) 3.9731013 21,743 0.586 0.029 (0.01) 0.0052 0.033 (0.004) 8.2331015 RDW-EA 5: 127,371,588 A/G rs10063647* intron
LINC01184-SLC12A2
45,573 0.463 0.05 (0.007) 1.7231013 18,475 0.480 0.033 (0.011) 0.0018 0.045 (0.006) 2.8831015
RDW-All 5: 127,371,588 A/G rs10063647* intron LINC01184-SLC12A2
56,194 0.506 0.044 (0.006) 2.1131012 24,474 0.545 0.03 (0.01) 0.0014 0.04 (0.005) 2.3731014
RDW-EA 5: 127,522,543 C/T rs10089* utr_5p LINC01184-SLC12A2
45,573 0.21 0.051 (0.008) 8.4531010 16,692 0.215 0.058 (0.014) 2.713105 0.053 (0.007) 1.1531013
RDW-All 5: 127,522,543 C/T rs10089* utr_5p LINC01184-SLC12A2
56,194 0.207 0.044 (0.008) 4.083109 22,691 0.208 0.045 (0.012) 0.0001 0.044 (0.006) 2.7331012
HGB-All 6: 7,247,344 C/A rs35742417* missense RREB1 130,273 0.174 0.030 (0.005) 1.173108 4,074 0.207 0.065 (0.028) 0.0190 0.032 (0.005) 1.503109 RDW-AA 7: 80,300,449 T/G rs3211938* nonsense CD36 6,666 0.087 0.174 (0.031) 2.363108 5,999 0.086 0.139 (0.032) 1.833105 0.161 (0.025) 7.0931011 RDW-All 7: 80,300,449 T/G rs3211938* nonsense CD36 55,510 0.012 0.171 (0.029) 5.293109 22,691 0.023 0.139 (0.032) 1.613105 0.157 (0.022) 5.1231013 RDW-EA 8: 126,490,972 A/T rs2954029* intergenic TRIB1 45,573 0.46 0.036 (0.007) 1.533107 16,692 0.466 0.026 (0.011) 0.0210 0.034 (0.006) 1.293108 RDW-All 8: 126,490,972 A/T rs2954029* intergenic TRIB1 56,194 0.439 0.032 (0.006) 1.833107 22,691 0.432 0.021 (0.01) 0.0298 0.029 (0.005) 2.543108 MCH-All 10: 105,659,826 T/C rs2487999 missense OBFC1 66,318 0.869 0.047 (0.009) 4.123108 26,749 0.861 0.025 (0.013) 0.0601 0.041 (0.007) 1.753108 MCH-AA 11: 92,722,761 G/A rs1447352 intergenic MTNR1B 8,273 0.557 0.089 (0.016) 1.853108 5,038 0.562 0.022 (0.02) 0.2713 0.07 (0.014) 1.083106 HGB-EA 15: 43,820,717 C/T rs55707100* missense MAP1A 106,377 0.033 0.071 (0.013) 1.653108 21,743 0.0223 0.099 (0.033) 0.0028 0.075 (0.012) 2.3131010 MCV-AA 16: 1,551,082 A/G rs2667662* intron TELO2 10,849 0.725 0.099 (0.015) 1.7931010 5,034 0.724 0.093 (0.022) 3.023105 0.098 (0.014) 7.3231012 MCV-AA 16: 2,812,939 C/A rs2240140* missense SRRM2 8,525 0.118 0.134 (0.025) 7.083108 6,002 0.124 0.106 (0.027) 0.0001 0.128 (0.022) 5.243109
(Continued on next page)
The
American
Journal
of
Human
Genetics
99
,
8–21,
July
7,
2016
Table 1. Continued
Marker Info Discovery Replication Combined
Trait Position A1/A2 SNP Annotation Gene n AF (A2) Beta (SE) p Value n AF (A2) Beta (SE) p Value Beta (SE) p Value
HCT-EA 17: 59,017,025 T/C rs8080784 intron BCAS3-TBX2 79,344 0.158 0.039 (0.007) 2.623108 19,968 0.148 0.011 (0.014) 0.4349 0.029 (0.006) 3.393106 HGB-EA 17: 59,483,766 C/T rs8068318 intron BCAS3-TBX2 106,377 0.722 0.026 (0.005) 1.533107 21,743 0.730 0.021 (0.011) 0.0565 0.025 (0.005) 2.553108 MCV-EA 20: 31,140,165 C/T rs4911241* intron NOL4L 61,462 0.241 0.04 (0.007) 1.253108 21,714 0.252 0.025 (0.012) 0.0302 0.036 (0.006) 2.013109 RDW-EA 20: 31,140,165 C/T rs4911241* intron NOL4L 45,573 0.242 0.043 (0.008) 5.793108 18,475 0.240 0.049 (0.012) 7.443105 0.045 (0.007) 2.0131011 RDW-All 20: 31,140,165 C/T rs4911241* intron NOL4L 56,194 0.235 0.038 (0.007) 1.563107 24,474 0.222 0.044 (0.011) 6.103105 0.04 (0.006) 4.6031011 HCT-EA 20: 43,042,364 C/T rs1800961* missense HNF4A 79,344 0.024 0.083 (0.015) 1.443108 19,968 0.033 0.082 (0.028) 0.0037 0.083 (0.013) 1.9131010 HGB-EA 20: 43,042,364 C/T rs1800961* missense HNF4A 98,277 0.032 0.073 (0.013) 2.533108 21,743 0.032 0.062 (0.027) 0.0232 0.071 (0.012) 1.933109 HCT-All 20: 43,042,364 C/T rs1800961* missense HNF4A 100,313 0.022 0.077 (0.014) 2.313108 25,006 0.027 0.091 (0.028) 0.0010 0.08 (0.012) 9.8831011 HGB-All 22: 44,324,727 C/G rs738409 missense PNPLA3 130,273 0.223 0.028 (0.005) 2.243108 4,074 0.218 0.053 (0.027) 0.0504 0.029 (0.005) 4.813109 MCH-EA X: 55,039,960 G/A rs201062903 missense ALAS2 52,758 0.002 0.324 (0.053) 7.3231010 5,855 0.001 0.291 (0.235) 0.215 0.323 (0.052) 5.8131010 MCH-All X: 55,039,960 G/A rs201062903 missense ALAS2 65,067 0.002 0.322 (0.051) 3.3631010 10,893 0.001 0.276 (0.224) 0.218 0.321 (0.051) 2.6831010 MCV-EA X: 55,039,960 G/A rs201062903 missense ALAS2 60,211 0.002 0.285 (0.049) 7.113109 5,044 0.001 0.178 (0.248) 0.472 0.282 (0.049) 6.113109 Variants in novel loci with p<23107and that were retained after conditional analyses are presented here. All variants are>1 Mb apart from a known GWAS signal for RBC traits. Chromosome positions are given on human genome build hg19. Allele frequency and effect size are given for the alternate (A2) allele. Replication was carried out in six cohorts for EA and two cohorts for AA and was performed in RareMetals; meta-analyses of the discovery and replication cohorts are presented under ‘‘Combined’’ and were carried out in METAL. Asterisks (*) indicate variants that replicated with a nominal p<0.05. Abbreviations are as follows: EA, European American; AA, African American; All, combined ancestry (EAþAAþAsiansþHispanics); A1, reference allele; A2, alternate allele; N, sample size; AF, allele frequency; SE, standard error; HCT, hematocrit; HGB, hemoglobin; RBC, red blood cell count; MCV, mean corpuscular volume; MCHC, mean corpuscular hemoglobin concentration; MCH, mean corpuscular hemoglobin; RDW, red blood cell distribution width.
14
The
American
Journal
of
Human
Genetics
99
,
8–21,
July
7,
the transcription factor HNF4A (Table 1). This marker, rs1800961 (p.Thr117Ile [c.350C>T]), has previously been associated with HDL and total cholesterol, C-reactive pro-tein, fibrinogen, and coagulation factor VII levels.39–42 Mu-tations in HNF4A cause maturity-onset diabetes of the young (MODY [MIM: 125851]) and a common intronic SNP in HNF4A (rs4812829) has been associated with type 2 diabetes (MIM: 125853) risk.43 The missense rs1800961 associated with HGB and HCT is only in weak LD with rs4812829 (r2 ¼ 0.021 in EA populations from the 1000 Genomes Project). Querying recently released ExomeChip data from Type 2 Diabetes Genetics (Web Re-sources), we found that rs1800961 is also associated with T2D risk in ~82,000 participants (p¼ 9.5 3 107, odds ratio¼1.16).HNF4Ais expressed in the kidney and could influence HGB and HCT through the regulation of erythro-poietin production.44It is also abundantly expressed in the liver, where it could indirectly affect HGB and HCT levels through an effect on blood lipid levels (see Discussion).
HNF4A is detectable at low levels in erythroblasts, and
the BLUEPRINT Project has found that someHNF4A iso-forms may be more highly expressed in this cell type (Figure S4).45
In AA, we identified a nonsense variant (rs3211938, p.Tyr325Ter [c.975T>G], MAF¼ 8.7%, p¼7.1 31011) in CD36 associated with RDW. This variant displays a wide variation in allele frequency between AA and EA (MAFEA¼0.01%). The association is slightly improved in the ancestry-combined meta-analysis (p ¼ 5.1 3 1013) because there is also evidence of association in Hispanics (MAF¼1.9%, p¼0.022) (Table 1). We examined a dataset of ex vivo differentiated human erythroblasts to determine whether thisCD36nonsense variant shows allelic imbal-ance (AI).32All samples were homozygous at rs3211938 for the reference allele with the exception of one heterozy-gous sample (FL11). FL11 had the lowest level of CD36
expression among the 12 samples tested and demonstrated strong AI where we observe 705 sequence reads for the reference allele (T) versus 126 for the alternate allele (G) (p¼4.931095;Figure 2). To confirm this finding in inde-pendent samples, we queried the GTEx dataset, which has
compiled RNA-sequencing and genotype information from multiple human tissues.38 GTEx does not include data for human erythroblasts. However, it detected a strong eQTL effect of rs3211938 on CD36 expression in whole blood (peQTL ¼ 1.1 3 1015), with carriers of the G-allele expressing less CD36 (Figure S5). Furthermore, GTEx reported evidence for moderate AI in multiple tissues forCD36-rs3211938, with the G-allele being under-repre-sented among sequence reads (Figure S5). These results strongly support our observations in human erythroblasts.
eQTL Analysis
To prioritize additional causal genes at RBC loci that contain non-coding variants, we cross-referenced our list of novel variants with more than 100 published eQTL data-sets (Subjects and Methods). Overall, 12 variants were sig-nificant eQTLs in a wide variety of tissues (Table S6). The most interesting eQTL finding is the association between rs10903129, a common marker associated with RDW in our analyses and located within an intron of TMEM57
(MIM: 610301), and the expression of RHD (MIM: 111680) in whole blood. RHD is located 112 kb down-stream ofTMEM57and encodes the D antigen of the clin-ically significant Rhesus (Rh) blood group. rs10903129 has also been associated with total cholesterol levels and eryth-rocyte sedimentation rate (ESR).46,47The association with ESR is particularly intriguing given that it is considered a non-specific indicator of inflammation. As described above, RDW is also abnormal in chronic diseases, such as atherosclerosis and diabetes, which have an important inflammation component.
Gene-Based Association Testing
Despite our large sample size, statistical power remains limited for rare variants of weak-to-moderate phenotypic ef-fect. To try to capture these genetic factors, we performed gene-based testing by aggregating coding and splice site var-iants with MAF < 1% within each gene (Subjects and Methods). The SKAT analyses identified two genes:ALAS2
associated with MCH andPKLR(MIM: 609712) associated with HGB and HCT (Table 2). TheALAS2signal was driven
Figure 2. CD36 Expression in Human Erythroblasts
(A) In a dataset of 12 human fetal liver erythroblasts, all samples were homozy-gous at rs3211938 for the reference T-allele with the exception of one heterozygous sample (FL11). FL11 demonstrated strong allelic imbalance: we observed 705 reads for the reference allele (T) and 126 reads for the alternate allele (G) (binomial p¼4.931095).
(B) FL11 (in green) shows the lowest CD36expression level when compared to the other 11 samples. Abbreviation is as follows: FPKM, fragments per kilobase of transcript per million mapped reads.
by a single rare missense variant (rs201062903) and was described above.PKLRencodes the erythrocyte pyruvate ki-nase (PK) that catalyzes the last step of glycolysis. PK defi-ciency, usually caused by recessive mutations, is one of the main causes of non-spherocytic hemolytic anemia (MIM: 266200). In fact, one of the variants identified in our meta-analysis (rs116100695, p.Arg486Trp [c.1456T>G], MAF¼ 0.3%, betaHGB ¼ 0.242 g/dl, pHGB ¼ 1.2 3 105) is a frequent cause of PK deficiency in Italian and Spanish sub-jects.48,49This variant was confirmed in the replication co-horts (preplication ¼0.039;Table S7). Two additionalPKLR rare missense variants contribute to the gene-based associa-tion statistic with HGB and HCT: rs61755431 (p.Arg569Gln [c.1706G>A], MAF¼0.2%, betaHGB¼ 0.179 g/dl, pHGB¼ 0.006) and rs8177988 (p.Val506Ile [c.1516G>A], MAF ¼ 0.6%, betaHGB ¼ þ0.116 g/dl, pHGB ¼ 0.003). It is note-worthy that the p.Val506Ile substitution is associated with increased HGB concentration given that this amino acid maps to a PKLR structural domain necessary for protein interaction.50This heterogeneity of effect among thePKLR missense variants might explain why SKAT’s result is more significant than VT’s for this gene (Table 2). A third gene, ALPK3, was identified only in the VT analysis for association with MCHC (Table 2).ALPK3encodes a kinase previously implicated in cardiomyocyte differentiation.51 We could not test for replication because of the rarity of
ALPK3’s coding alleles (Table S7).
RBC Variants and Pleiotropic Effects
Besides the overlap within the RBC traits themselves, we identified seven novel RBC variants associated with other blood-cell type traits or with lipid levels (Figure 3and Ta-ble 3). To assess whether the genetic associations with RBC traits are independent of lipid levels, we performed additional analyses in a subset of BCX participants from three of our studies (FHS, MHIBB, and WHI) ranging from ~10,000 to 23,000 individuals. We repeated the association analyses for five RBC loci (TMEM57-RHD
rs10903129, AFF1 rs442177, TRIB1 rs2954029, MAP1A
rs55707100, andHNF4Ars1800961) additionally adjusting for the respective lipid trait and combined the results across the three studies using fixed-effect meta-analysis
(Table S8). There was little or no change in the effect size or p values associated with the five RBC trait loci upon adjustment for the corresponding lipid trait, suggesting that the RBC and lipid associations are independent of one another and thus represent true ‘‘pleiotropic’’ genetic effects.
A correlated response to or role in inflammation might explain why some of the RBC variants are also associated with WBC, PLT, or lipid traits. Another plausible explana-tion for the concomitant associaexplana-tion of several markers with RBC, WBC, and PLT phenotypes could be a more gen-eral effect of these genes on the proliferation or differentia-tion of hematopoietic progenitor cells. This is most likely the case for JAK2 (MIM: 147796) and SH2B3
(MIM: 605093), two key regulators of hematopoietic cells (Figure 3). In this category, we also observed two novel find-ings,AFF1(MIM: 159557) andNOL4L, which are associated with RBC and WBC phenotypes and have been previously implicated in leukemia.53,54Finally, we identified a novel missense variant in ARHGEF3(MIM: 612115) associated with HGB and HCT. In addition to its association with PLT traits,ARHGEF3plays a role in the regulation of iron uptake and erythroid cell maturation.55
Discussion
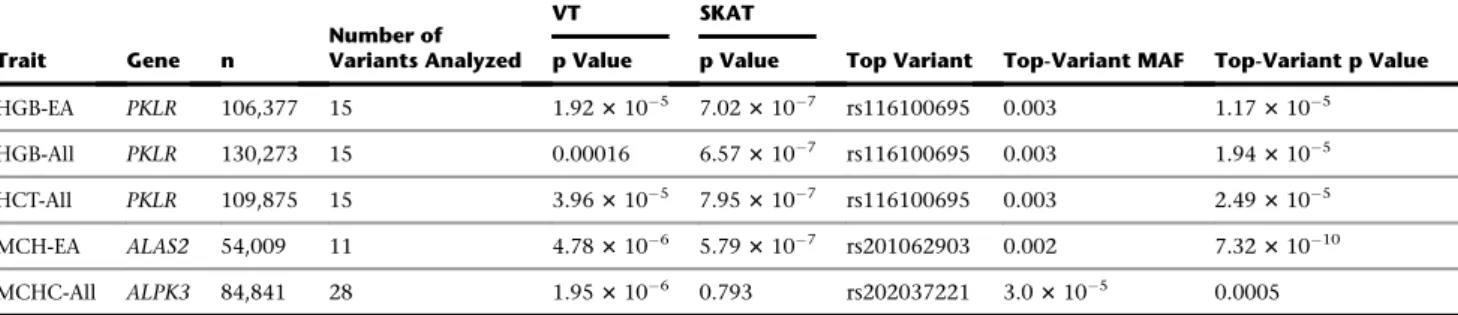
We present multi-ethnic meta-analyses of seven RBC traits using ExomeChip results of 130,273 individuals. Our sta-tistical thresholds to declare significance at the discovery stage (p < 2 3 107in the single-variant analyses) was adjusted for the approximate number of variants geno-typed on the ExomeChip (Bonferroni correction for 250,000 variants), but we decided not to adjust it for the seven RBC phenotypes tested because of the high correla-tion between some of these traits (Figure S3). Instead, we relied on independent replication to distinguish true from probably false positive associations. Despite the limited size of our replication set (27,480 individuals), it was encouraging to detect a strong replication of direction of effect for known and novel RBC variants, suggesting a low false discovery rate. In total, we identified 23 novel Table 2. Gene-Based Association Results
Trait Gene n
Number of Variants Analyzed
VT SKAT
Top Variant Top-Variant MAF Top-Variant p Value p Value p Value
HGB-EA PKLR 106,377 15 1.923105 7.023107 rs116100695 0.003 1.173105 HGB-All PKLR 130,273 15 0.00016 6.573107 rs116100695 0.003 1.943105 HCT-All PKLR 109,875 15 3.963105 7.953107 rs116100695 0.003 2.493105 MCH-EA ALAS2 54,009 11 4.783106 5.793107 rs201062903 0.002 7.3231010 MCHC-All ALPK3 84,841 28 1.953106 0.793 rs202037221 3.03105 0.0005
Gene-based results of the VT and SKAT algorithms for genes associated with RBC traits at p<33106. We analyzed non-synonymous coding (nonsense, missense) and splice site variants with a minor allele frequency (MAF)<1%. Abbreviations are as follows: EA, European American; All, combined ancestry (EAþAAþAsiansþHispanics); n, sample size; HCT, hematocrit; HGB, hemoglobin; MCHC, mean corpuscular hemoglobin concentration; MCH, mean corpus-cular hemoglobin.
variants associated with RBC traits in the single-variant an-alyses and a collection of three rare missense variants in
PKLRassociated with HGB and HCT in the gene-based an-alyses. Out of the 23 novel RBC variants, 16 were replicated at p < 0.05 in the independent samples (Table 1). To inform our replication criteria, we conducted a power anal-ysis using a sample size of 20,000 and considering multiple combinations of allele frequencies and effect sizes. Based on allele frequency and effect size, one of our most difficult to replicate variants was rs1800961 (MAF¼0.022, Beta¼ 0.028). However, we still had approximately 56% power to detect this association in the replication stage.
We identified a nonsense variant in CD36 associated with RDW in African Americans. CD36 is a type B scav-enger receptor located on the surface of many cell types, including endothelial cells, platelets, monocytes, and erythrocytes. CD36 is a marker of erythroid progenitor dif-ferentiation56and might also be involved in macrophage-mediated clearance of red blood cells.57 Furthermore, CD36 plays a role in many biological pathways such as lipid metabolism/transport and atherosclerosis, hemosta-sis, and inflammation.58The nonsenseCD36variant iden-tified in our RDW meta-analysis (rs3211938,Table 1) has previously been associated with platelet count, HDL cholesterol, and C-reactive protein levels in African Amer-icans59,60and malaria resistance in Africans.61,62TheCD36
locus shows a signature of natural selection in AA popula-tions63and the MAF of rs3211938 varies widely between
continents: in the 1000 Genomes Project, the minor allele is absent from European populations but reaches fre-quency of 24%–29% in some African populations.64 To characterize the molecular mechanism by which rs3211938 can impact RDW, we identified one heterozy-gous sample among a collection of ex vivo differentiated human erythroblasts.32In erythroblasts from this donor, we noted a strong allelic imbalance (Figure 2). Importantly, this result was confirmed in independent samples from the GTex dataset (Figure S5). At the molecular level, thisCD36
expression phenotype could be explained by nonsense-mediated mRNA decay or the regulatory effect of non-cod-ing genetic variants in LD with rs3211938.
We observed that many new RBC variants are pleio-tropic, being often associated with more than one RBC in-dex as well as with WBC, PLT, and lipid traits (Figure 3). These shared effects could imply that the underlying causal genes at these RBC loci generally controlled blood cell proliferation or modulate inflammatory responses. An additional explanation for the link between RBC traits and lipid variants might be the cholesterol content of RBC membranes. As mentioned earlier, RBC corresponds to a large fraction (~25%) of the cells found in the human body. Genetic variation that modulates RBC count or vol-ume could impact circulating lipid levels. In support of this hypothesis, it has been observed that a thalassemia allele is strongly associated with cholesterol levels in the Sardinian population.65In total, we found ten loci associated with lipid levels and RBC indices, including four novel RBC var-iants (AFF1,TMEM57-RHD,TRIB1,HNF4A) (Figure 3).
In summary, our multi-ethnic meta-analyses have expanded the genetic knowledge of erythrocyte biology and identified new common, low-frequency, and rare RBC variants. Many of the new RBC variants are pleiotropic, affecting other complex traits such as WBC, PLT, and blood lipid levels. Although our report demonstrates the utility of the ExomeChip for genetic discovery, it also highlights the challenge to attribute gene causality based only on associa-tion results. This is particularly evident for loci with com-mon variants, for which coding and non-coding markers are often statistically equivalent. For instance, we found no examples of RBC coding variants that entirely explain RBC GWAS signals among the seven loci that had both a sentinel GWAS variant and ExomeChip coding markers. Although increasing sample sizes will continue to yield additional RBC loci, it has become incredibly clear that only a combination of well-powered genetic studies, tran-scriptomic and epigenomic surveys, and functional experi-ments (e.g., using genome editing) will ultimately pinpoint causal variants and genes that control RBC phenotypes.
Supplemental Data
Supplemental Data include a note on the eQTL analyses, informa-tion on supplementary funding, five figures, and eight tables and can be found with this article online athttp://dx.doi.org/10.1016/
j.ajhg.2016.05.007.
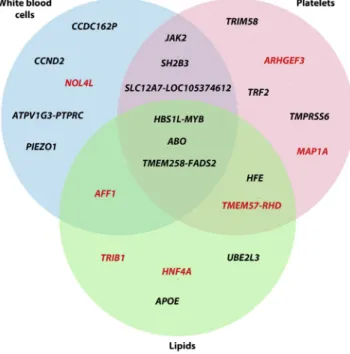
Figure 3. Venn Diagram Summarizing Pleiotropic Effects for Genetic Variants Associated with Red Blood Cell Traits
We considered variants only if their association p values with white blood cell (WBC) traits, platelet (PLT) traits, or with lipid levels was p<13104. Results for WBC and PLT are from the accompanying Blood-Cell Consortium articles.20,21 Results for lipids have previously been published (Table 3). Genes highlighted in red are novel RBC trait findings.
Acknowledgments
We thank all participants, staff, and study coordinating centers. We also thank Raymond Doty and Jan Abkowitz for discussion of theALAS2finding. We would like to thank Liling Warren for contributions to the genetic analysis of the SOLID-TIMI-52 and STABILITY datasets. Young Finns Study (YFS) acknowledges the expert technical assistance in the statistical analyses by Ville Aalto and Irina Lisinen. Estonian Genome Center, University of Tartu (EGCUT) thanks co-workers at the Estonian Biobank, espe-cially Mr. V. Soo, Mr. S. Smith, and Dr. L. Milani. Airwave thanks Louisa Cavaliero who assisted in data collection and manage-ment as well as Peter McFarlane and the Glasgow CARE, Patricia Munroe at Queen Mary University of London, and Joanna Sarnecka and Ania Zawodniak at Northwick Park for their contri-butions to the study. This work was supported by the Fonds de Recherche du Quee´bec-Santee´ (FRQS, scholarship to N.C.), the Canadian Institute of Health Research (Banting-CIHR, scholar-ship to S.L. and operating grant MOP#123382 to G.L.), and the Canada Research Chair program (to G.L.). P.L.A. was supported by NHLBI R21 HL121422-02. N.A.A. is funded by NIH DK060022. A.N. was supported by the Yoshida Scholarship Foun-dation. S.K. was supported by a Research Scholar award from the
Massachusetts General Hospital (MGH), the Howard Goodman Fellowship from MGH, the Donovan Family Foundation, R01HL107816, and a grant from Fondation Leducq. Additional acknowledgments and funding information is provided in the
Supplemental Data.
Received: February 18, 2016 Accepted: May 3, 2016 Published: June 23, 2016
Web Resources
BCX ExomeChip association results, http://www.mhi-humangenetics.org/en/resources
CheckVCF,https://github.com/zhanxw/checkVCF ClinVar,https://www.ncbi.nlm.nih.gov/clinvar/ OMIM,http://www.omim.org/
RareMETALS,http://genome.sph.umich.edu/wiki/RareMETALS RareMetalWorker, http://genome.sph.umich.edu/wiki/
RAREMETALWORKER
RvTests,http://genome.sph.umich.edu/wiki/RvTests
Type 2 Diabetes Genetics,http://www.type2diabetesgenetics.org/
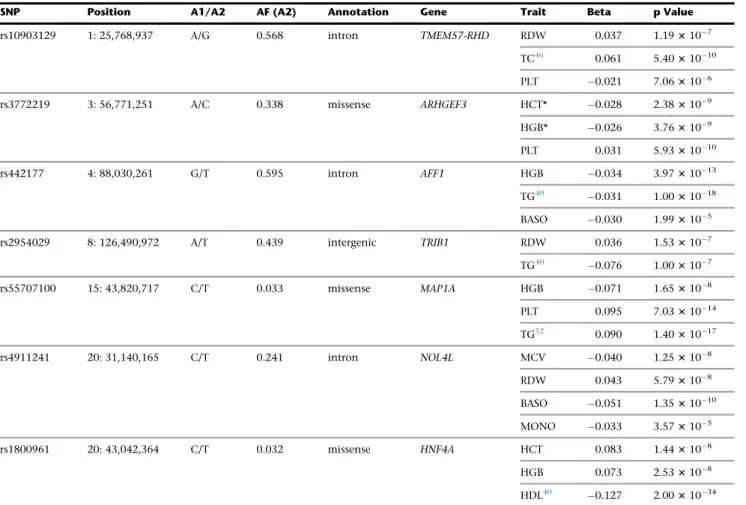
Table 3. Overlap of Red Blood Cell Markers with Other Blood Cell Traits and/or Lipid
SNP Position A1/A2 AF (A2) Annotation Gene Trait Beta p Value
rs10903129 1: 25,768,937 A/G 0.568 intron TMEM57-RHD RDW 0.037 1.193107 TC46 0.061 5.4031010 PLT 0.021 7.063106 rs3772219 3: 56,771,251 A/C 0.338 missense ARHGEF3 HCT* 0.028 2.383109 HGB* 0.026 3.763109 PLT 0.031 5.9331010
rs442177 4: 88,030,261 G/T 0.595 intron AFF1 HGB 0.034 3.9731013
TG40 0.031 1.0031018 BASO 0.030 1.993105
rs2954029 8: 126,490,972 A/T 0.439 intergenic TRIB1 RDW 0.036 1.533107
TG40 0.076 1.003107
rs55707100 15: 43,820,717 C/T 0.033 missense MAP1A HGB 0.071 1.653108
PLT 0.095 7.0331014 TG52 0.090 1.4031017
rs4911241 20: 31,140,165 C/T 0.241 intron NOL4L MCV 0.040 1.253108
RDW 0.043 5.793108 BASO 0.051 1.3531010 MONO 0.033 3.573105
rs1800961 20: 43,042,364 C/T 0.032 missense HNF4A HCT 0.083 1.443108
HGB 0.073 2.533108 HDL40 0.127 2.0031034 Shown here are significant novel variants from the RBC traits association analyses that overlap with other blood-cell traits or with lipids. Results for the white blood cell and platelet traits are from the Blood Cell Consortium, and results for lipids are from the published literature. Results are presented for European-ancestry individuals, except in the presence of an asterisk (*), which stands for result from ‘‘All’’ ancestry. The allele frequency and direction of the effect (beta) is given for the A2 allele. Abbreviations are as follows: A1, reference allele; A2, alternate allele; AF, allele frequency; HCT, hematocrit; HGB, hemoglobin; MCV, mean corpuscular volume; RDW, red blood cell distribution width; TC, total cholesterol; PLT, platelet; TG, triglycerides; WBC, white blood cells; BASO, basophils; MONO, monocytes; HDL, HDL cholesterol.
References
1. Ulker, P., Sati, L., Celik-Ozenci, C., Meiselman, H.J., and
Baskurt, O.K. (2009). Mechanical stimulation of nitric oxide
synthesizing mechanisms in erythrocytes. Biorheology 46,
121–132.
2. Jiang, N., Tan, N.S., Ho, B., and Ding, J.L. (2007). Respiratory
protein-generated reactive oxygen species as an antimicrobial
strategy. Nat. Immunol.8, 1114–1122.
3. Schnabel, R.B., Baumert, J., Barbalic, M., Dupuis, J., Ellinor,
P.T., Durda, P., Dehghan, A., Bis, J.C., Illig, T., Morrison, A.C., et al. (2010). Duffy antigen receptor for chemokines (Darc) polymorphism regulates circulating concentrations of mono-cyte chemoattractant protein-1 and other inflammatory
medi-ators. Blood115, 5289–5299.
4. Colin, Y., Le Van Kim, C., and El Nemer, W. (2014). Red
cell adhesion in human diseases. Curr. Opin. Hematol.21,
186–192.
5. Whelihan, M.F., and Mann, K.G. (2013). The role of the red
cell membrane in thrombin generation. Thromb. Res.131,
377–382.
6. Brugnara, C. (2003). Iron deficiency and erythropoiesis: new
diagnostic approaches. Clin. Chem.49, 1573–1578.
7. Huang, Y.L., Hu, Z.D., Liu, S.J., Sun, Y., Qin, Q., Qin, B.D.,
Zhang, W.W., Zhang, J.R., Zhong, R.Q., and Deng, A.M. (2014). Prognostic value of red blood cell distribution width for patients with heart failure: a systematic review and
meta-analysis of cohort studies. PLoS ONE9, e104861.
8. Nada, A.M. (2015). Red cell distribution width in type 2
dia-betic patients. Diabetes Metab. Syndr. Obes.8, 525–533.
9. Zalawadiya, S.K., Zmily, H., Farah, J., Daifallah, S., Ali, O., and
Ghali, J.K. (2011). Red cell distribution width and mortality in predominantly African-American population with
decompen-sated heart failure. J. Card. Fail.17, 292–298.
10. Zalawadiya, S.K., Veeranna, V., Panaich, S.S., and Afonso, L.
(2012). Red cell distribution width and risk of peripheral ar-tery disease: analysis of National Health and Nutrition
Exam-ination Survey 1999-2004. Vasc. Med.17, 155–163.
11. Patel, K.V., Semba, R.D., Ferrucci, L., Newman, A.B., Fried, L.P.,
Wallace, R.B., Bandinelli, S., Phillips, C.S., Yu, B., Connelly, S., et al. (2010). Red cell distribution width and mortality in older
adults: a meta-analysis. J. Gerontol. A Biol. Sci. Med. Sci.65,
258–265.
12. Patel, H.H., Patel, H.R., and Higgins, J.M. (2015). Modulation
of red blood cell population dynamics is a fundamental
ho-meostatic response to disease. Am. J. Hematol.90, 422–428.
13. Whitfield, J.B., and Martin, N.G. (1985). Genetic and
environ-mental influences on the size and number of cells in the
blood. Genet. Epidemiol.2, 133–144.
14. Pilia, G., Chen, W.M., Scuteri, A., Orru´, M., Albai, G., Dei, M.,
Lai, S., Usala, G., Lai, M., Loi, P., et al. (2006). Heritability of cardiovascular and personality traits in 6,148 Sardinians.
PLoS Genet.2, e132.
15. Evans, D.M., Frazer, I.H., and Martin, N.G. (1999). Genetic
and environmental causes of variation in basal levels of blood
cells. Twin Res.2, 250–257.
16. Lin, J.P., O’Donnell, C.J., Jin, L., Fox, C., Yang, Q., and
Cup-ples, L.A. (2007). Evidence for linkage of red blood cell size and count: genome-wide scans in the Framingham Heart
Study. Am. J. Hematol.82, 605–610.
17. van der Harst, P., Zhang, W., Mateo Leach, I., Rendon, A.,
Ver-weij, N., Sehmi, J., Paul, D.S., Elling, U., Allayee, H., Li, X.,
et al. (2012). Seventy-five genetic loci influencing the human
red blood cell. Nature492, 369–375.
18. Chen, Z., Tang, H., Qayyum, R., Schick, U.M., Nalls, M.A.,
Handsaker, R., Li, J., Lu, Y., Yanek, L.R., Keating, B., et al.;
BioBank Japan Project; CHARGE Consortium (2013).
Genome-wide association analysis of red blood cell traits in African Americans: the COGENT Network. Hum. Mol. Genet.
22, 2529–2538.
19. Auer, P.L., Teumer, A., Schick, U., O’Shaughnessy, A., Lo, K.S.,
Chami, N., Carlson, C., de Denus, S., Dube´, M.P., Haessler, J., et al. (2014). Rare and low-frequency coding variants in CXCR2 and other genes are associated with hematological
traits. Nat. Genet.46, 629–634.
20. Eicher, J.D., Chami, N., Kacprowski, T., Nomura, A., Chen,
M.-H., Yanek, L.R., Tajuddin, S.M., Schick, U.M., Slater, A.J., Pankratz, N., et al. (2016). Platelet-related variants identified by exomechip meta-analysis in 157,293 individuals. Am. J.
Hum. Genet.99, this issue, 40–55.
21. Tajuddin, S.M., Schick, U.M., Eicher, J.D., Chami, N., Giri, A.,
Brody, J.A., Hill, W.D., Kacprowski, T., Li, J., Lyytika¨inen, L.-P., et al. (2016). Large-scale exome-wide association analysis identifies loci for white blood cell traits and pleiotropy with
immune-mediated diseases. Am. J. Hum. Genet.99, this issue,
22–39.
22. Grove, M.L., Yu, B., Cochran, B.J., Haritunians, T., Bis, J.C.,
Taylor, K.D., Hansen, M., Borecki, I.B., Cupples, L.A., Fornage, M., et al. (2013). Best practices and joint calling of the HumanExome BeadChip: the CHARGE Consortium. PLoS
ONE8, e68095.
23. Purcell, S., Neale, B., Todd-Brown, K., Thomas, L., Ferreira,
M.A., Bender, D., Maller, J., Sklar, P., de Bakker, P.I., Daly, M.J., and Sham, P.C. (2007). PLINK: a tool set for whole-genome association and population-based linkage analyses.
Am. J. Hum. Genet.81, 559–575.
24. Wells, Q.S., Becker, J.R., Su, Y.R., Mosley, J.D., Weeke, P.,
D’Aoust, L., Ausborn, N.L., Ramirez, A.H., Pfotenhauer, J.P., Naftilan, A.J., et al. (2013). Whole exome sequencing iden-tifies a causal RBM20 mutation in a large pedigree with
familial dilated cardiomyopathy. Circ Cardiovasc Genet 6,
317–326.
25. Winkler, T.W., Day, F.R., Croteau-Chonka, D.C., Wood, A.R.,
Locke, A.E., Ma¨gi, R., Ferreira, T., Fall, T., Graff, M., Justice, A.E., et al.; Genetic Investigation of Anthropometric Traits (GIANT) Consortium (2014). Quality control and conduct of
genome-wide association meta-analyses. Nat. Protoc. 9,
1192–1212.
26. Limongelli, G., Elliott, P., Charron, P., Mogensen, J., and
McKeown, P.P. (2012). Approaching genetic testing in
cardio-myopathies (ESC Council for Cardiology Practice).
27. Olson, T.M., Michels, V.V., Thibodeau, S.N., Tai, Y.S., and
Keat-ing, M.T. (1998). Actin mutations in dilated cardiomyopathy,
a heritable form of heart failure. Science280, 750–752.
28. Liu, D.J., Peloso, G.M., Zhan, X., Holmen, O.L., Zawistowski,
M., Feng, S., Nikpay, M., Auer, P.L., Goel, A., Zhang, H., et al. (2014). Meta-analysis of gene-level tests for rare variant
associ-ation. Nat. Genet.46, 200–204.
29. Wu, M.C., Lee, S., Cai, T., Li, Y., Boehnke, M., and Lin, X.
(2011). Rare-variant association testing for sequencing data with the sequence kernel association test. Am. J. Hum. Genet.
89, 82–93.
30. Price, A.L., Kryukov, G.V., de Bakker, P.I., Purcell, S.M., Staples,
J., Wei, L.J., and Sunyaev, S.R. (2010). Pooled association tests