LOW CALORIE-‐ AND CALORIC-‐SWEETENERS: DIET QUALITY, FOOD INTAKE AND PURCHASE PATTERNS OF U.S. HOUSEHOLD CONSUMERS
Carmen M. Piernas Sanchez
A dissertation submitted to the faculty of the University of North Carolina at Chapel Hill in partial fulfillment of the requirements
for the degree of Doctor of Philosophy in the Department of Nutrition, Gillings School of Global Public Health.
Chapel Hill 2013
Approved by:
Barry Popkin, PhD
Penny Gordon-‐Larsen, PhD
David Guilkey, PhD
Michelle Ann Mendez, PhD
ii
© 2013
Abstract
CARMEN M. PIERNAS SANCHEZ: Low Calorie-‐ and Caloric-‐Sweeteners: Diet Quality, Food Intake and Purchase Patterns of
U.S. Household Consumers
(Under the direction of Barry M. Popkin)
Although most food and beverage products consumed in the U.S.
contain caloric-‐sweeteners (CS), consumption of low calorie
sweeteners (LCS) such as aspartame, saccharin or stevia in foods and
beverages has increased rapidly over the past 30 years. However,
there is limited knowledge about the long-‐term determinants and
consequences of LCS and CS consumption. This dissertation aimed to
specifically examine consumption of products containing LCS and CS
over the last decade and investigate the dietary quality and food
patterns of consumers in the U.S. This research used measures of
foods as purchased from the Homescan dataset 2000-‐2010, and dietary
intake data from the National Health and Nutrition Examination
Surveys (NHANES) 2003-‐2010. Aim 1 implemented an innovative approach
based on ingredient and nutrition facts panel information to
identify sweeteners in food products. Coincident with declining
purchases and consumption of CS products over the last decade, we
iv
and a previously unexplored trend in products with both LCS and CS,
especially important among households with children. In aim 2, we
examined the dietary quality and food patterns of consumers of
beverages with LCS and CS from 2000-‐10. Compared to non/low
consumers of LCS-‐ and CS-‐beverages, consumers had a significantly
lower probability of adherence to a “Prudent” dietary pattern and
higher average energy from purchases or intake of high calorie food
groups such as salty snacks, fast food meals or desserts. LCS-‐
beverage consumers also followed another different pattern of
purchases consisting in fruits, vegetables, nuts and also snacks and
desserts. Aim 3 used a dynamic panel model and instrumental
variables to investigate the long-‐term effect of CS-‐ and LCS-‐
beverages on dietary quality and food purchasing patterns from 2000-‐
2010. Despite overall declines in calories from all sources, we
found that increasing one daily serving of either CS-‐ or LCS-‐
beverages is associated with significantly increased total daily
energy, energy from food, and also increased daily energy from
carbohydrates, total sugar, and total fat. We also found that
increasing one serving of either beverage per day was mainly
associated with increased purchases of caloric desserts and
sweeteners. In conclusion, as consumers appear to be turning to LCS
for their sweet options, our study opens up new pathways that relate
and increased purchases of overall energy, carbohydrates, sugar, and
caloric desserts and sweeteners. It is essential to understand if
sweetener consumption translates into a better or worse dietary
quality before continuing with more complex studies that relate
sweetener intake to health outcomes. Our findings suggest that any
type of sweetened beverage consumption could have a negative effect
on diet, which can potentially inform future intervention strategies
and nutrition policy recommendations aimed at improving diet and
nutrition in the U.S.
vi
Dedication
To my advisor Barry Popkin, who helped me and guided me
throughout my entire stay in the U.S. I learned from him to be
productive and not be afraid of taking risks. He has an incredible
way to look at the big picture of anything and know if something is
important in seconds. He opened up his research group to me and gave
me all kinds of resources to be successful. Most importantly, he
trusted me in all circumstances, from speaking to the media and
newspapers to giving an oral presentation. During these 4 years, he
was always there to provide fast guidance and help. I would also
like to acknowledge my dissertation committee, Shu Wen Ng, Michelle
A Mendez, Penny Gordon Larsen and David Guilkey. They all have been
very helpful and have spent a lot of time reviewing my work. Shu Wen
has been much more than a committee member and I will miss her a
lot. I met her when she was finishing her dissertation and she has
been always there to listen to me and help me in any ways. Shu Wen
is that kind of person that anybody wants to have in their research
I also want to thank many other fellows from the UNC Food
Research Program. First, Phil Bardsley, who taught me everything
that I know about Stata. He had an incredible patience to listen to
me and understand what I wanted. Donna Miles was a crucial person
in my dissertation research. She helped creating all my datasets
and I will always be grateful for all her time and effort. I would
also like to thank the rest of the UNCFRP team, especially to Meghan
Slining, Emily Ford, Dan Blanchette (in memoriam) and Izabela Annis.
Finally, I thank my fellow students, Jennifer Poti, Kevin Mathias,
Chris Ford, Dalia Stern, Lindsey Smith and Lauren Butler. I will
miss them all because each of them have taught me something unique
and important.
To my “Tres Morenas”, Carolina Batis, Niha Zubair and Lee Kaye.
They have demonstrated me how good friends they are. Together, we
traveled, we laughed, we cried, etc… but most importantly, we
trusted and supported each other, and that is something that I will
always remember from them. Also, I would like to remember all the
other students that I have met during the program, especially to
Amanda, Beth Widen, Heather Paich, Verne, and Justin.
To my Spanish group in Chapel Hill. They have been my family
over these 5 years. Each of them have had a unique role in the
viii
They made life after work funnier and fuller. I already miss them
all.
To my parents and the rest of my family, including my brother,
my grandparents and my in laws. My family is the core of my life.
Everything I do is for them. They are always present in any aspect
of my life because with them all of this make sense. My parents not
only gave me the best education but have been role models for me in
every aspect of life. Also, I would like to thank my best friends,
especially to Puri, with which I started being a scientist. She has
been supporting me from distance and I will never forget all the
good moments together.
To Jose, my husband. He has been there in every single second
of my life during this dissertation. He continues teaching me
every day and offering me all his kindness and support. He
understood any problem I had and was always willing to sacrifice
anything for me. I am grateful for his never ending love.
To anyone else that made this dissertation possible.
Table of Contents
List of Tables ... vii
List of Figures ... x
List of Abbreviations and Symbols ... xi
Chapter 1. Introduction ... 1
Background ... 1
Research Aims ... 3
Chapter 2. Literature review ... 5
The relationship between low-‐calorie sweetener consumption and health outcomes is unclear ... 5
Dietary patterns potentially mediate the relationship between LCS and energy intake and obesity ... 7
Longitudinal observational data is needed to understand long-‐term dietary patterns ... 8
Identification of sweeteners in foods and beverages in the U.S. marketplace is challenging ... 9
Consumer awareness might affect sweetener consumption and dietary patterns ... 11
Studying measures of foods as purchased (Homescan) and foods as consumed (NHANES) ... 12
vi
Overview ... 14
Introduction ... 15
Methods ... 17
Results ... 25
Discussion ... 27
Tables and Figures ... 34
Chapter 4. Low Calorie-‐ and Caloric-‐Sweetened Beverages: Diet Quality, Food Intake and Purchase Patterns of U.S. Household Consumers ... 46
Overview ... 46
Introduction ... 47
Methods ... 50
Results ... 58
Discussion ... 62
Tables and Figures ... 69
Chapter 5. Dynamic Modeling of the Effect of Low Calorie-‐ and Caloric-‐Sweetened Beverages on Dietary Quality and Food Purchasing Patterns ... 83
Overview ... 83
Introduction ... 84
Methods ... 87
Results ... 97
Discussion ... 100
Tables and Figures ... 108
Chapter 6. Synthesis ... 121
Strengths and Limitations ... 126
Significance and public health impact ... 130
Future directions ... 132
References ... 136
vii
List of Tables
Table 3.1. Demographic characteristics of the populations of HOMESCAN (household and per capita purchase
data) and NHANES (per capita dietary intake data)* ... 34
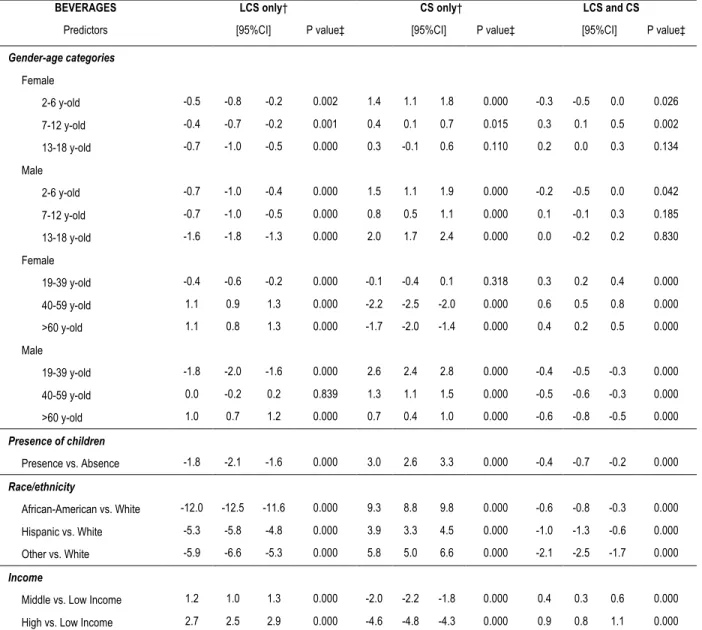
Table 3.2. Change in percent volume (mL/day) purchased
from each type of beverage using estimated average
marginal effects from random-‐effects longitudinal regression models, among U.S. households from the
Homescan Longitudinal dataset, 2000-‐2010*. ... 35
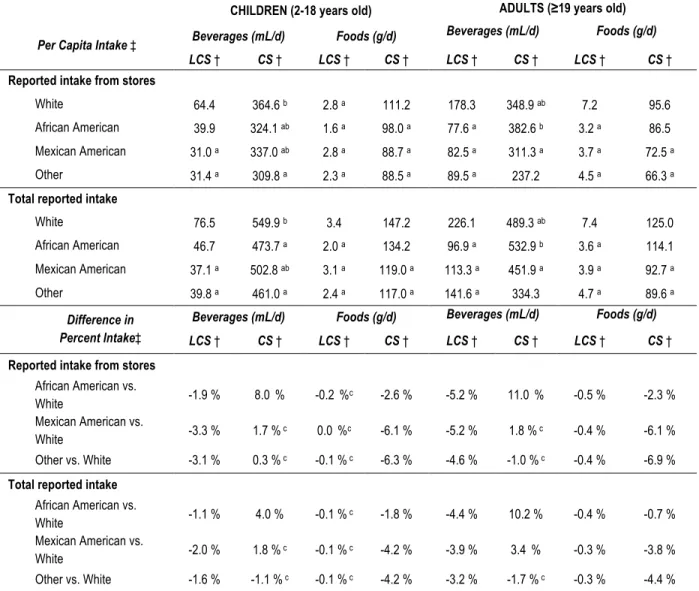
Table 3.3. Race/ethnic differences in consumption of foods
and beverages by sweetener type, NHANES 2003-‐2010*. .... 36
Supplemental Table 3.1. Trends in per capita purchases and % household purchasing foods and
beverages by sweetener type, Homescan 2000-‐ 2010*. ... 37
Supplemental Table 3.2. Trends in prevalence and per capita intake of beverages and foods by
sweetener type, NHANES 2003-‐2010*. ... 38
Supplemental Table 3.3. Change in percent volume (mL/day) purchased from each type of beverage using estimated average marginal
effects from random-‐effects longitudinal regression models, among U.S. households from the Nielsen Homescan Longitudinal
dataset, 2000-‐2010. ... 39
Supplemental Table 3.4. Change in percent volume (gr/day)
purchased from each type of food using estimated average marginal effects
from random-‐effects longitudinal regression models, among U.S.
households from the Nielsen Homescan
Longitudinal dataset, 2000-‐2010. ... 41
by consumer profile in Homescan 2000-‐2010
and NHANES 2003-‐2010. ... 69
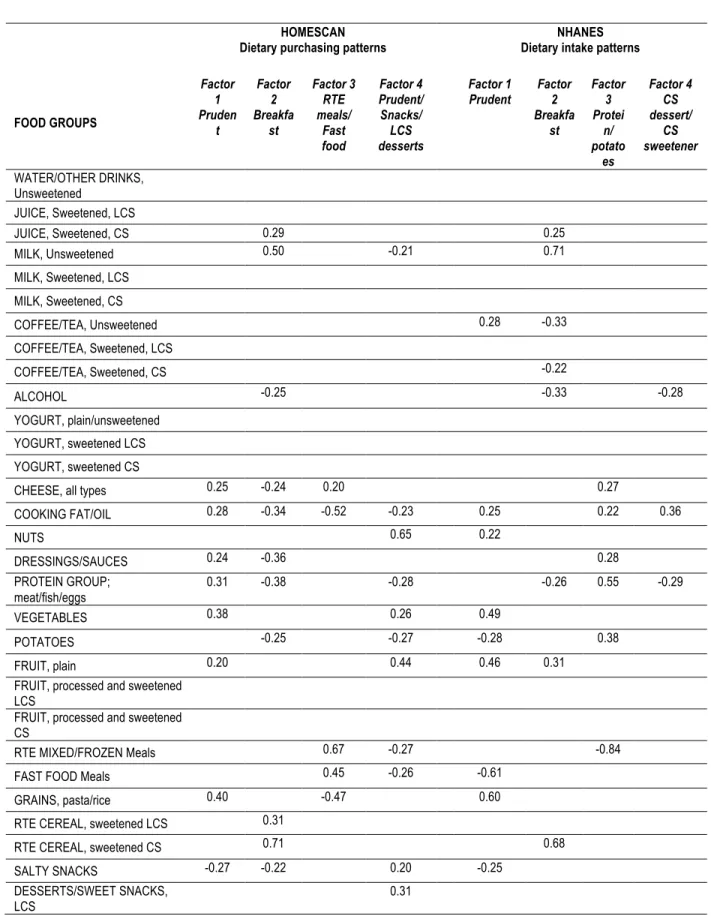
Table 4.2. Dietary and purchasing patterns derived from
factor analysis in the Homescan and NHANES populations. 71
Table 4.3. Comparison of food group patterns by beverage consumption profile in the HOMESCAN and NHANES
populations. ... 73
Supplemental Table 4.1. Food and beverage groups used
in the Homescan and NHANES datasets. ... 74
Supplemental Table 4.2. Total daily household purchases
of energy (kcal/day) and macronutrients (kcal/day, %) by beverage profile,
HOMESCAN 2000-‐10. ... 75
Supplemental Table 4.3. Total daily intake of energy (kcal/day) and macronutrients (kcal/day, %) by beverage profile,
NHANES 2003-‐2010. ... 78
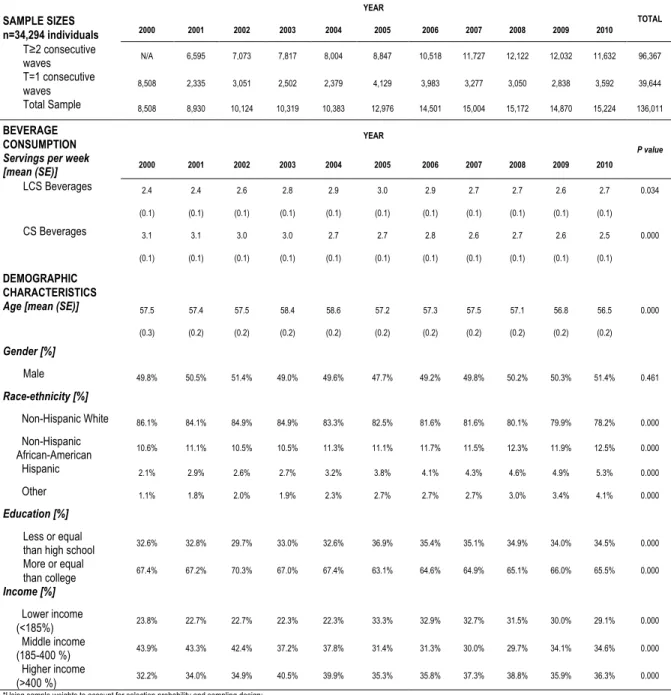
Table 5.1. Sample sizes and demographic characteristics
of the Homescan population from 2000-‐2010. ... 108
Table 5.2. Dynamic modeling of the effect of increasing one daily serving of LCS-‐ and CS-‐beverages on
dietary quality and macronutrients ... 109
Table 5.3. Dynamic modeling of the effect of increasing one daily serving of LCS and CS sugar-‐sweetened
beverages on dietary purchasing patterns ... 110
Supplemental Table 5.1. Population distributions by beverage consumer profile in the
Homescan population from 2000-‐2010. ... 111
Supplemental Table 5.2. Changes in energy and
ix
Supplemental Table 5.3. Changes in beverage groups (kcal and grams per day) among individuals in the Homescan
population, from 2000-‐2010. ... 113
Supplemental Table 5.4. Changes in food groups (kcal
and grams per day) among individuals in the Homescan population, from
2000-‐2010. ... 114
Supplemental Table 5.5. Changes in market-‐level
instrumental variables in the
Homescan population, from 2000-‐2010. ... 116
Supplemental Table 5.6. Associations between lagged
instrumental variables and lagged
outcomes and exposures in the Homescan population, from 2000-‐2010. ... 117
List of Figures
Figures 3.1a-‐b. Sources of low-‐calorie and caloric
sweeteners in the US, 2007-‐2010* ... 43
Figures 3.2ª-‐b. Trends in percent households purchasing and per capita purchases of beverages by
sweetener type, Homescan 2000-‐2010* ... 44
Figures 3.3a-‐b. Trends in consumption per capita and percent of consumers of beverages, NHANES
2003-‐2010* ... 45
Figure 4.1a-‐b. Total daily household purchases in Homescan and individual intake in
NHANES (kcal/day)** ... 80
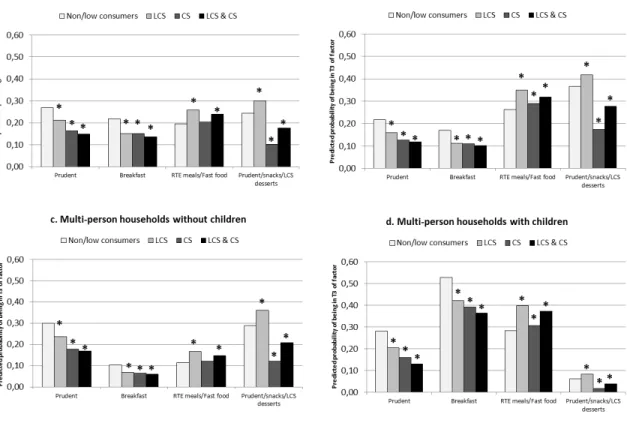
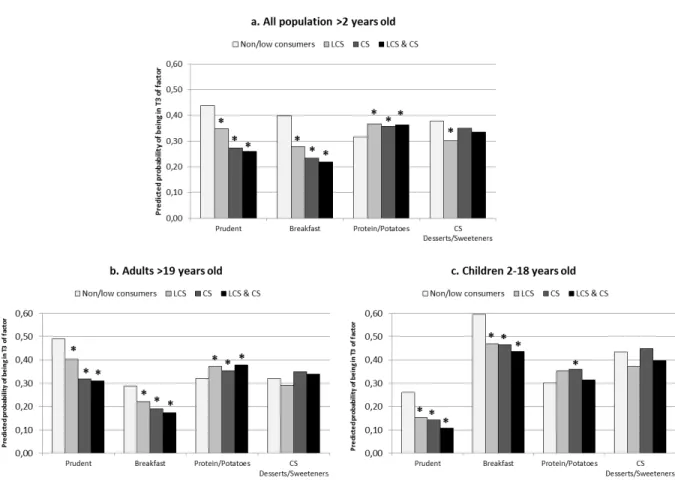
Figure 4.2a-‐d. Relationships between beverage consumption profiles and dietary purchasing patterns,
HOMESCAN 2000-‐2010** ... 81
Figure 4.3a-‐c. Relationships between beverage consumption profiles and dietary intake patterns, NHANES
2003-‐2010** ... 82
Figure 5.1. Effect of increasing one serving of LCS-‐ or CS-‐beverages compared to non-‐consumers
on total daily energy* ... 118
Figure 5.2. Effect of increasing one serving of LCS-‐ or CS-‐beverages compared to non-‐consumers
on energy from macronutrients* ... 119
Figure 5.3. Effect of increasing one serving of LCS-‐ or CS-‐beverages compared to non-‐consumers
on energy from food groups* ... 120
xi
List of Abbreviations and Symbols
BMI Body mass index
CPG Consumer packaged goods
CS Caloric sweeteners
FDA Food and Drug Administration
LCS Low-‐calorie sweeteners
NFP Nutrition Facts Panel
NHANES National Health and Nutrition Examination Surveys
RTE Ready to eat
UPC Universal Product Code
USDA U.S. Department of Agriculture
Chapter 1. Introduction
Background
Coincident with the rising incidence of obesity, type 2
diabetes and metabolic syndrome in the United States, consumption of
low-‐calorie sweeteners (LCS) have increased. While intake of caloric
sweeteners (CS) in general and CS-‐beverages in particular is
commonly associated with poor health outcomes, the association
between LCS consumption and the risk of obesity and cardio-‐metabolic
problems still remains under great controversy.
Several biological mechanisms have been hypothesized to link
LCS consumption to increased energy, carbohydrate, sugar intake and
poor dietary quality. Behaviorally, consumption of LCS products
could be linked to higher intake of calories or larger portion sizes
motivated by the general perception that these “diet” products are
lower in calories and sugar; hence allowing consumers to offset
these beverages with less healthful foods. Dietary patterns may be
one pathway linking LCS and CS consumption to health outcomes, but
little is known about actual patterns of sweetener use – both LCS
Moreover, LCS consumption has typically been poorly assessed because
of the lack of standardized ways to determine the presence of
sweeteners in food products, partly due to the lack of access to
product ingredient lists, as well as the lack of awareness of the
presence of LCS, CS or both sweeteners in food products as self-‐
reported by participants. Using measures of food purchases and
measures of food consumption in U.S. adults, we aimed to investigate
if consumption of LCS and CS is associated with lower nutritional
quality and poorer dietary patterns.
The Nielsen’s Homescan Consumer Panel Dataset is a unique
longitudinal dataset of prospective commercial measures on store
purchases at the household level. We analyzed data on more than
600,000 scanned foods and beverages purchased from grocery, drug,
mass-‐merchandise, club, supercenter and convenience stores in a
nationally representative sample of U.S. households from 2000 to
2010. The Homescan dataset has been linked with updated Nutrition
Facts Panel data and ingredients lists from Gladson and other
sources to precisely identify the inclusion of LCS and CS in
consumer packaged goods (CPG) products in the U.S. market. Homescan
contains data on all foods purchased yearly by over 60,000
households per year, each followed for at least one year, and up to
ten years. We also studied dietary intake data (at home and away
Surveys (NHANES) 2003-‐2010, to better identify patterns of actual
consumption of products containing LCS and CS in the U.S.
Research Aims
Aim 1. Describe trends in purchases and intake of products
containing LCS and CS over the last decade in the U.S.:
1a. We categorized all products (foods and beverages) by
sweetener type (LCS only, CS only, both LCS and CS or neither
sweetener) and identified all sources of sweeteners in the U.S.
using household-‐level purchases from Homescan 2000-‐2010 (store
products) and individual-‐level dietary intake from NHANES 2003-‐2010
(store and away from home products). We estimated per capita and per
consumer trends in purchases (Homescan, 2000-‐2010) and intake
(NHANES, 2003-‐2010) of beverages and foods containing LCS and CS.
1b. We explored the longitudinal associations between patterns of
purchases of LCS and CS-‐foods and beverages and household
characteristics (i.e. age, gender, race/ethnicity, SES, household
size) in Homescan, 2000-‐2010.
Aim 2. Characterize the dietary quality, food intake and purchasing
patterns of LCS-‐ and CS-‐beverage consumers:
2a. We developed a food grouping system that includes equivalent
investigated the association between dietary intake patterns
(NHANES, 2003-‐2010) and food purchasing patterns (Homescan, 2000-‐
2010) and the different profiles of consumption of LCS and CS-‐
beverages. We performed factor analyses to find data-‐driven dietary
patterns in each dataset individually. We used longitudinal measures
of food purchases from Homescan to derive factor scores and create
long term dietary patterns to investigate if beverage consumers
tracked on a certain dietary pattern over time.
Aim 3. Investigate the effect of LCS-‐ and CS-‐beverage purchases on
dietary quality and food purchasing patterns over time:
3a. Using Homescan (2000-‐2010), we investigated the longitudinal
associations between purchases of CS-‐ and LCS-‐beverages and dietary
quality using a dynamic panel model and instrumental variables.
Dietary quality was modeled as the outcome variable and was defined
using continuous measures of energy intake, macronutrients and foods
Chapter 2. Literature review
The relationship between low-‐calorie sweetener consumption and health outcomes is unclear
Obesity and other cardio-‐metabolic risks are major public
health concerns in the United States 1-‐3. Increased energy intake,
and particularly higher intake of energy-‐dense foods are current
behaviors that have been related to these chronic diseases 4-‐8. In this context, artificial or low-‐calorie sweeteners (LCS) have gained
attention as dietary tools that help reduce the sugar and energy
content of foods and beverages while maintaining their sweet taste 9,
10. Different types of LCS are currently approved by the U.S. Food
and Drug Administration (FDA), such as saccharin, sucralose,
aspartame, acesulfame K, neotame and stevia. Currently the American
Diabetes Association and the American Heart Association among others
recommend the use of LCS as means to reduce sugar and energy intake
for those with diabetes and/or trying to lose weight 11. While intake
of caloric sweeteners (CS) in general and CS-‐beverages in particular
is commonly associated with poor health outcomes 12, the benefit of
consuming LCS on energy balance and metabolic health is still
for Americans 2010 did not state a specific recommendation for LCS
use, but affirmed that “replacing added sugars with non-‐caloric
sweeteners may reduce calorie intake in the short-‐term, yet
questions remain about their effectiveness as a weight management
strategy”18.
The relationship between LCS, energy intake and obesity has
been investigated previously in large epidemiologic studies and
randomized trials yielding conflicting results. Previous short-‐term
trials in adults have shown a positive relationship between LCS
consumption and appetite and increased energy intake compared to non
LCS consumers 16, 19-‐21. However, subsequent randomized control trials
and crossover trials found no association with self-‐reported hunger
and satiety and reported beneficial effects of LCS consumption on
energy intake, weight loss and weight maintenance 22-‐30. Most of these conflicting studies are short-‐term trials performed under laboratory
conditions using different vehicles for LCS such as foods,
beverages, capsules or supplements. In large epidemiologic studies
involving adults, a positive effect of LCS consumption on weight
reduction was found in the Nurses’ Health Study II 31; whereas the San Antonio Heart Study and other longitudinal studies showed a
positive association between LCS use and body mass index (BMI) 32 and
cardio-‐metabolic risk 33-‐35. These contradictory long-‐term cohort
consumers appear to be increasingly turning to LCS use 9, a better understanding of the effect of sweetener consumption on dietary
quality and dietary patterns is needed before a policy
recommendation can be issued.
Dietary patterns potentially mediate the relationship between LCS and energy intake and obesity
Dietary patterns associated with consumption of LCS are
potential intermediates in the causal pathway between LCS and energy
intake, obesity and cardio-‐metabolic outcomes (CM), but very few
studies have explored dietary habits in this context 36, 37. In addition, none of these studies actually controlled for individual
preferences, when for instance, LCS consumption might reflect an
enhanced sweetness inclination 38. Previous research found that the
greater the sweetness of a product, as a consequence of a higher
amount of added sweetener, the higher the consumption of sweet foods
or beverages 39. In this context, sweetness preference has been found
to be equally influenced by both CS and LCS 40. Also, repeated exposure to LCS uncoupled with energy can modify the natural
relationship between sweet taste and energy and has been
hypothesized to affect appetite and energy intake by disrupting
hormonal and neurobehavioral pathways that control hunger and
Consuming LCS products could be associated with increased
consumption of other sweet foods in the short term, which could
translate into a set of behaviors that potentially affect diet in
the long-‐term towards a lower dietary quality, higher energy intake
and obesity. Dietary intake is also influenced by the important
mechanisms and behaviors involved in food selection and food
choices. Behaviorally, consumption of LCS products could be linked
to higher intake of calories or larger portion sizes motivated by
the general perception that these “diet” products are lower in
calories and sugar; hence allowing consumers to offset these
beverages with less healthful foods. Unraveling the physiological
and psychological causes and consequences of LCS consumption was not
possible with this study. However, this epidemiological longitudinal
exploration examined if consumption of LCS and CS in foods and
beverages was associated with higher or lower dietary quality in the
long term. In this study, many other unmeasured individual
characteristics that affect food selection and choices were
adequately controlled.
Longitudinal observational data is needed to understand long-‐term dietary patterns
To date, only two long-‐term studies have investigated LCS and
dietary patterns longitudinally 37, 45, but none of these included a
of LCS and dietary intake from the mid-‐80s. Most research on overall
diet patterns in the U.S. included cross-‐sectional data from
national surveys, i.e. National Health and Nutrition Examination
Surveys (NHANES), which collected dietary intake using short-‐term
recalls or food-‐frequency questionnaires 46, 47. These sources of
dietary information do not capture usual intake or further dynamics
of consumption. To date, no studies have explored patterns of LCS
and CS consumption and the long-‐term dietary patterns associated
with sweetener use. The Homescan Consumer Panel is a unique set of
prospective commercial measures of food purchases at the household
level collected by the Nielsen Co. This data set includes current
information about each episode of purchases by participating
households, from 2000 to 2010, along with important socio-‐
demographic and environmental information for about 60,000
households per year in the U.S.
Identification of sweeteners in foods and beverages in the U.S. marketplace is challenging
Consumption of LCS-‐sweetened foods or beverages is increasing
in the U.S. 9, a trend that will continue rising as manufacturers
attempt to reduce the energy density of foods products 48. Then,
identification and categorization of LCS in the marketplace is
critical. However, since LCS use is approved by the Food and Drug
information about LCS content on labels, making obtaining accurate
and direct measures of the LCS concentration in the food supply very
challenging. An important limitation of both national surveys and
Homescan is that none of the main primary food-‐composition tables
include information on the exact amount of sweetener in products.
Furthermore, the implementation of national policies and industry
efforts to reformulate and reduce the energy density of products
increases the need for more comprehensive nutrient databases capable
to capture newly introduced or reformulated products in the U.S.
market. Due to several constraints, the USDA food composition tables
are not updated frequently enough to capture the rapidly occurring
changes in the food supply. For example, in a two-‐year period,
NHANES can capture consumption of about 5,000 unique foods, whereas
U.S. consumers purchase over 170,000 products with unique
formulations 48. Consequently, dietary intake collected by NHANES
might not be representative of the vast variety of foods sold
commercially. As a consequence of the lack of a standardized way to
quantify the amount of sweetener in products in the U.S. markets and
because beverages are the main sources of intake of sweeteners and
easier to classify 9, most research is focused on LCS-‐ and CS-‐
previous studies or by searching the food description and linking
them with nutrition composition 9, 31, 32, 37, 45, 49, 50 . These previous definitions were not taking into account that some products might
contain LCS but might not be advertised as “diet” or “low-‐calorie”.
By using Homescan and Nutrition Facts Panel (NFP) data, we were able
to improve the definition and classification of products containing
LCS and CS by using ingredient lists and other label information
available to identify LCS-‐ and CS-‐products. We used NFP data and
ingredient information of each uniquely bar-‐coded product,
information provided by the commercial Gladson Nutrition Database
and other databases (i.e. Mintel GNPD). A unique Universal Product
Code (UPC) is assigned to each food product to track retail sales
and purchases. Gladson contains information on U.S. brands and
private label processed and packaged food products and includes
around 170,000 uniquely formulated UPCs and full lists of
ingredients, brand name and descriptions on each label. Gladson NFP
data is updated frequently to capture new products and/or
reformulations.
Consumer awareness might affect sweetener consumption and dietary patterns
Consumer awareness is another important issue to consider when
studying this topic 51, 52. For example, those concerned about sugar
as “sugar free” or “low sugar”. However, there are new or
reformulated products that contain LCS in combination with CS (i.e.
products that substitute part of the sugars with LCS) that are
currently being introduced by the industry in their push to reduce
calories and added sugars. Some of these products might not be
advertised as “sugar free” or “low sugar” and consumers probably
don’t know that they are consuming LCS. Our focus is on consumers
who know they are consuming products advertised as “low
sugar/calorie” and truly contain LCS. However, even if we include
products marketed as “diet”, we are still assuming that consumers
are aware of the presence of LCS in those products.
Studying measures of foods as purchased (Homescan) and foods as consumed (NHANES)
Data from two different datasets, Homescan and NHANES, was
included in the present research. The ultimate goal was not to
combine both datasets but rather to complement each other flaws.
Each dataset offers different sources of information given the
nature of their design and the purpose for which they were created.
In relation to our aims, the main advantage of Homescan is that all
products containing sweeteners were easily classified by searching
in the ingredient lists and label claims. NHANES does not include
ingredient lists for their food categories and the only way to
each food description. At the most, if the person reporting his/her
intake actually knows it’s an LCS product, we could only know if it
was “sweetened with a low calorie sweetener”, but not if the product
contained LCS only or in addition to CS. Homescan also includes at
least 10 months of purchasing data per household whereas NHANES
collects 2 days maximum of intake, being Homescan a better proxy for
usual diet. Also, Homescan might be less affected by recall bias
and/or misreporting compared to NHANES, although we expected some
degree of misreporting given the burden of time required to scan all
purchases. Finally, Homescan is a longitudinal dataset that allowed
us to explore the associations of sweetener use on overall diet
patterning. On the other hand, NHANES collects actual consumption of
products whereas Homescan does not account for wastage, storage or
sharing of foods (purchases are not exactly consumption) and does
not allocate specific amounts of foods to each member of the
household. NHANES captures all sources of consumption whereas
Homescan only captures consumption from stores, missing away from
home eating.
Chapter 3. Trends in purchases and intake of foods and beverages containing caloric-‐ and low-‐calorie sweeteners over the last decade
in the U.S.
Overview
Current food databases might not capture rapidly occurring
changes in the food supply, such as the increased use of caloric
(CS) and low-‐calorie sweeteners (LCS) in products. We explored
trends in purchases and intake of foods and beverages containing
LCS, CS or both sweeteners over the last decade in the U.S., as well
as household and SES predictors of these trends. We analyzed
household purchases from Homescan 2000-‐10 (n=140,352 households;
408,458 individuals); and dietary intake from NHANES 2003-‐10
(n=34,391 individuals). We estimated per-‐capita purchases and intake
(g or mL/d) and percent of consumers of foods and beverages
containing LCS, CS, or both LCS+CS. We estimated change in purchases
associated with SES and household composition using random-‐effects
longitudinal models.
From 2000-‐10, percent of households purchasing CS products
decreased, whereas for LCS and LCS+CS products increased among all
types of households and particularly among those with children.
higher % CS beverage purchases (+9%; +4%; +3% respectively, P<0.001)
and lower % LCS beverage purchases (-‐12%; -‐5%; -‐2% respectively,
P<0.001). In summary, during a period of declining purchases and
consumption of CS products, we have documented an increasing trend
in products that contain LCS and a previously unexplored trend in
products with both LCS and CS, especially important among households
with children.
Introduction
The consumption of food and beverages containing added caloric
sweeteners (CS) have been systematically linked with weight gain
among adults and children 14, 33, 34, 53-‐55. At the same time, many still question if low calorie sweeteners (LCS) are a good option for
weight and diabetes control 56, 57 . Overall, the majority of food and
beverage products consumed in the U.S. contain CS 58. However,
consumption of LCS in foods and beverages has increased rapidly over
the past 30 years 9, 58-‐61, a trend that will continue rising after the implementation of national policies and industry efforts that
encourage manufacturers to reformulate and reduce the energy density
of food products 62. In this context, nutrition research needs far
more comprehensive nutrient databases capable of capturing newly
introduced or reformulated products in the U.S. marketplace 63. Since
and manufacturers do not provide information about LCS content on
labels, so obtaining accurate and direct measures of the LCS
concentration in the food supply is problematic. On the other hand,
the USDA food composition tables are not updated frequently enough
to capture the rapidly occurring changes in the food supply 62. In each two-‐year wave, the National Health and Nutrition Examination
Surveys (NHANES) food databases can only capture consumption of
about 7,600 unique foods, out of over 85,000 products with unique
formulations that U.S. consumers currently purchase 60. As a
consequence of the lack of a standardized way of quantifying the
exact amount of LCS in products, most research is focused on
consumption of LCS beverages 31, 32, 36, 37 . Very few studies have explored consumption of LCS in foods 9, 59 and none have been able to
identify products that contain both LCS and CS.
This study explores trends in purchases and intake of foods and
beverages that contain LCS, CS and both sweeteners over the last
decade. We analyze prospective measures of purchases by households
included in the Nielsen Homescan Longitudinal dataset from 2000-‐10
64
. Homescan captures unique food products that have barcodes or
Universal Product Codes (UPC) assigned to track retail sales and
purchases of U.S. brands and private label packaged food products
for more than 600,000 UPCs that are sold every year in the U.S.
ingredient list from the nutrition facts panel of each uniquely
barcoded product, which also contains updated and complete measures
of the nutritional content of the purchased products 65. We estimated
per-‐capita purchases (g or mL/d) and percent of households
purchasing foods and beverages containing LCS, CS or both LCS and
CS. In addition, we examined the demographic characteristics of
households with different patterns of sweetener use. Finally, we
used individual-‐level dietary intake in NHANES 2003-‐10 to estimate
trends in intake per capita and percent consumers of foods and
beverages containing LCS or CS.
Methods
Sample
This study uses data on food purchases from the Nielsen
Homescan (The Nielsen Co.) from 2000-‐2010; and data on food
consumption from the U.S. Department of Agriculture (USDA) National
Health and Nutrition Examination Survey (NHANES) from 2003-‐2010
(both described below). We included these two U.S. nationally
representative datasets to investigate consumption of sweeteners
from different perspectives, from sales to actual intake of products
that contain sweeteners.
Primary Measure
Identification and classification of foods and beverages with sweeteners
Low calorie sweeteners (LCS) could be derived from natural
(i.e., sugar alcohols, stevia) or artificial (i.e., aspartame,
saccharine) sources. For the purpose of this research, LCS are
defined as food additives that provide <3.8 kcal/g and/or are used
in very low quantities so that the caloric amount they provide is
negligible. All other sweeteners that provide ≥3.8 kcal/g are
considered as caloric sweeteners (CS) as this cut-‐point reflects the
caloric value of a gram of carbohydrate. Because the exact amounts
of low-‐calorie sweeteners (LCS) in particular food products are not
readily accessible, we studied LCS and CS consumption using
information of purchases and intake of foods and beverages
containing these sweeteners. To separate specific products by
sweetener type in each dataset, we screened all groups of foods and
beverages that were found in previous research to contain added
sweeteners 58, which include dairy, grains, desserts, dressings,
processed fruits, snacks, discretionary sweeteners, soft drinks,
juice/fruit drinks, coffee/tea and milk beverages.
Study design and population
1) Food purchase data: The Nielsen Homescan Consumer Panel.
We selected households with adults and children from the
Nielsen Homescan (The Nielsen Co.) 64 from 2000-‐2010 (n=140,352
unique households comprised of 408,458 individuals), an ongoing
nationally representative longitudinal survey of 35,000 to 60,000
households per year that contains information on consumer purchases
of consumer packaged food items at the Universal Product Code (UPC)
level. Participating households are provided with home scanners with
which they record yearly food purchases from grocery, drug, mass-‐
merchandise, club, supercenter and convenience stores. Households
also report socio-‐demographic (SES) and household information
including gender and age of each family member, income, education
and race/ethnicity of the main head of the household. Households
included in Homescan are sampled and weighted to be nationally
representative. The Homescan dataset has been used frequently by
researchers to analyze food demand, consumption and sale
strategies60, 66, 67.
Each uniquely barcoded product captured in Homescan has been
linked with Nutrition Facts Panel (NFP) data and ingredient
information using the commercial Gladson Nutrition Database 65.
Gladson contains national brands and private label items at the UPC
market. Further details regarding matching these commercial
datasets at the UPC level, and other methodological facts are
available in the following sources 58, 60, 62. To ensure comparability across products, we applied weighted factors to those items sold as
concentrates (e.g., beverage powders) to reflect the volume of the
product in the “ready to drink/eat” form.
We classified products containing sweeteners in Homescan 2000-‐
2010. For each food/beverage group, we conducted keyword searches by
looking at the ingredient lists provided for each UPC purchased by
participating households. A detailed list of key terms is available
elsewhere58. Briefly, the main sweeteners identified as CS included
fruit juice concentrate (not reconstituted), cane sugar, beet sugar,
sucrose, corn syrup, high fructose corn syrup, agave-‐based
sweeteners, honey, molasses, maple, sorghum/malt/maltose, rice
syrup, fructose, lactose, inverted sugars; terms to identify LCS
included artificial sweetener, aspartame, saccharin, sucralose,
cyclamate, acesulfame K, stevia, sugar alcohols (i.e. xylitol, etc.)
and brand name versions of each sweetener. Foods and beverages were
then classified as containing CS only; LCS only; or both LCS+CS.
Classically, consumers are defined as persons who reported any
consumption greater than 0 g or mL on any given day, usually over a
way and exclude unusual or one-‐time purchases, we divided the total
purchases per year by pre-‐defined portions: 100 mL for beverages and
50 g for foods. For the purpose of this research, a household was
considered a consumer in Homescan if it had purchases of at least 52
portions per year, or one portion per week.
2) Dietary intake data: The National Health and Nutrition
Examination Surveys (NHANES).
We selected adults and children (n=34,391) who participated in
one of the four waves of the U.S. Department of Agriculture (USDA)
National Health and Nutrition Examination Survey (NHANES) from 2003-‐
2010: NHANES 2003-‐04 (n=8,272), NHANES 2005-‐06 (n=8,549), NHANES
2007-‐08 (n=8,528) and NHANES 2009-‐10 (n=9,042). These nationally
representative surveys are based on self-‐weighting, multistage and
stratified probability samples of non-‐institutionalized U.S.
households. Dietary intake data is collected using two non-‐
consecutive 24-‐h recalls. The NHANES surveys implemented a fully
automated, computer-‐assisted multiple-‐pass dietary recall
methodology that involves a 5-‐step process to reduce underreporting
of diet. Dietary intake data is linked to the USDA food composition
tables, which provide nutrient information and food descriptions for
each food item consumed by the participants. Socio-‐demographic
collected for each participant. Further details of each of these
surveys are available elsewhere 46, 47, 66, 67, 70, 71.
We classified foods and beverages containing sweeteners in
NHANES 2003-‐2010. Consistent with previous work 59, we conducted
keyword searches by looking at the food description of each food-‐
code that represents a specific food or beverage consumed. We
classified items as LCS-‐products if their food description included
the following terms: “with low/no calorie sweetener”, “sugar-‐free”
and “dietetic/low sugar”. Items that included terms such as “sugar”,
“sweetened” or didn’t specify the type of sweetener but are
typically sweetened (i.e. soft-‐drink, cola-‐type) were considered CS-‐
products. Foods and beverages were classified as LCS-‐foods; LCS-‐
beverages; CS-‐foods and CS-‐beverages. Products that contain both LCS
and CS cannot be separated in NHANES.
Consumers in NHANES were defined as those who consumed at least
one pre-‐defined portion over the 24-‐h recalled (100 mL for beverages
and 50 g for foods). Together with dietary intake, information on
where the foods or beverages were consumed is provided by each
individual. Information on location of consumption was used to
estimate intake from store-‐bought foods in addition to total intake.
Statistical Analysis
All analyses were performed using Stata 12 (StataCorp, Stata