Greater response variability in adolescents is
associated with increased white matter development
Diane Goldenberg
1, Eva H. Telzer
2, Matthew D. Lieberman
1,3,
Andrew J. Fuligni
1,3and Adriana Galv
an
1,*
1
Department of Psychology, University of California, Los Angeles, CA, USA,
2Department of Psychology,
University of North Carolina, Chapel Hill, NC, USA and
3Department of Psychiatry and Biobehavioral Sciences,
University of California, Los Angeles, CA, USA
*Correspondence should be addressed to Adriana Galvan, University of California, 1285 Franz Hall, Box 951563, Los Angeles, Los Angeles, CA 90095, USA. E-mail: [email protected]
Abstract
Adolescence is a period of learning, exploration, and continuous adaptation to fluctuating environments. Response variability during adolescence is an important, understudied, and developmentally appropriate behavior. The purpose of this study was to identify the association between performance on a dynamic risky decision making task and white matter microstructure in a sample of 48 adolescents (14–16 years). Individuals with the greatest response variability on the task obtained the widest range of experience with potential outcomes to risky choice. When compared with their more
behaviorally consistent peers, adolescents with greater response variability rated real-world examples of risk taking behav-iors as less risky via self-report. Tract-Based Spatial Statistics (TBSS) were used to examine fractional anisotropy (FA) and mean diffusivity (MD). Greater FA in long-range, late-maturing tracts was associated with higher response variability. Greater FA and lower MD were associated with lower riskiness ratings of real-world risky behaviors. Results suggest that re-sponse variability and lower perceived risk attitudes of real-world risk are supported by neural maturation in adolescents.
Key words:risky decision making; response variability; adolescence; diffusion tensor imaging
Adolescence is a time of instability and change. Fluctuations in social environments are paralleled by dynamic restructuring of neural architecture. During adolescence, long-range connec-tions between spatially segregated regions of the brain strengthen, both structurally and functionally (Hagmannet al., 2010). Paradoxically, as the brain becomes more integrated and control over behavior increases (Lunaet al., 2010), there is a con-comitant increase in risk taking during this period. Previous re-search has generally demonstrated an increase in risky decision making in adolescents, compared with children or adults (Steinberg, 2007), focusing largely on mean differences in behav-ior or neural response in developmental groups. Mean-level dif-ferences provide useful predictive information when variability is small among the individuals that comprise each group. However, small variability is not characteristic of adolescent be-havior. Recent work has begun highlighting the importance of
individual differences during adolescence, revealing that ado-lescents have the highest degree of variation during risky choice (Van Duijvenvoordeet al., 2015). This suggests that behavioral variability between adolescents may be systematic, rather than the result of random error. When variability does not occur by random error, calculating mean performance from a single measurement can lead to flawed estimates of average group dif-ferences and erroneous conclusions (Zilles and Amunts, 2013). Given that adolescents have the highest degree of variability ‘between’ individuals, the purpose of the present study was to conduct a fine-grained investigation of the variability ‘within’ adolescents during decisions made under risk.
Within-person variability reflects a transient change in be-havioral performance for a single individual. In the present study, adolescents performed a dynamic risky decision-making task from which a measure of response variability was
Received:8 March 2016;Revised:30 August 2016;Accepted:6 September 2016
VCThe Author (2016). Published by Oxford University Press. For Permissions, please email: [email protected]
436 doi: 10.1093/scan/nsw132
calculated. According to a dynamic systems approach, the de-gree of variability within individuals can change according to the developmental stage of the individual (Smith and Thelen, 2003). When learning a new skill or behavior, the degrees of freedom for performing that behavior are initially constrained. The classic developmental example of the non-linear trajectory of response variability is an infant acquiring mobility for walk-ing (Piek, 2002). Initially, motor response is not variable because the joints connecting the hip, leg, and ankle are tightly nected, restricting range of movement. These physical con-straints reduce complexity, allowing attention to be focused on particular aspects of the task. As development progresses, these tight couplings are physically loosened, resulting in an increase in variability and an ability to explore more complex patterns. Eventually, preferred patterns emerge, and variability is again reduced as this preferred solution is refined through practice.
A greater understanding of individual differences in adoles-cent behavior can be achieved through an examination of the structural connectivity in regions that support risky decision making (Croneet al., 2016). Structural connectivity is commonly examined through diffusion tensor imaging (DTI), which meas-ures water diffusion displacement and directionality (Basser, 1995). A number of outcome variables are obtained to character-ize this diffusion, including fractional anisotropy (FA) and mean diffusivity (MD). FA is an index of the degree of restricted water diffusion and MD a measure of overall water diffusion. Higher FA values and lower MD values are hypothesized to reflect qual-ities in white matter microstructure such as increased axonal caliber, myelination and fiber organization (Beaulieu, 2002). The maturation of white matter appears to improve efficiency of communication between brain regions, facilitating higher-order cognitive functioning and complex behaviors (Barnea-Goraly
et al., 2005; Bavaet al., 2010).
In this study, white matter microstructure was evaluated using DTI in adolescent participants. Additionally, participants performed the Balloon Analogue Risk Task (BART), a laboratory paradigm designed to assess decision-making under risk and shown to elicit individual differences in response variability (Jentschet al., 2010; Congdonet al., 2013; DeMartiniet al., 2014). Tract-Based Spatial Statistics (TBSS) were used to investigate the association between task performance and white matter microstructure. Self-report questionnaires also assessed adoles-cents’ decision-making processes in a variety of behavioral do-mains relevant to real-world risky choices.
Materials and methods
ParticipantsDTI was collected on 48 adolescents [14–16 years (Mage¼14.79; 27 females)]. Subjects were right-handed, free of metal, reported no current medication except birth control and reported no diagnosis of learning or mood disorders. Parents provided writ-ten consent and adolescent participants completed writwrit-ten as-sent in accordance with UCLA’s Institutional Review Board and were compensated for their participation.
Laboratory decision-making task
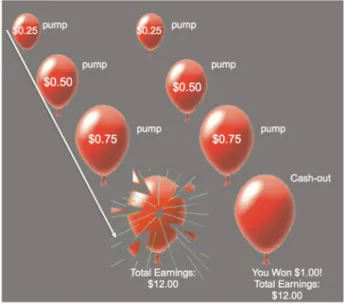
Balloon Analog Risk Task. Participants completed the BART (Lejuez et al., 2002) to examine decision making under risk (Figure 1). On each trial of the task, participants were presented with a red balloon. Participants were instructed to press one of two buttons to either pump the balloon or to cash-out. With
each pump, there was the possibility that the balloon would ei-ther grow larger or explode. The larger the balloon was inflated, the greater the monetary reward but the higher the probability of explosion. Each trial began with the presentation of a balloon and ended when the balloon either exploded or the participant chose to cash out. For each pump on which the balloon did not explode, the participant received a payment (25 cents) and could stop pumping the balloon at any point to keep the accu-mulated payoff. If the balloon exploded before cashing out, the participant received no payoff for that trial. The number of pumps before explosion was varied probabilistically according to a Poisson distribution with a range of 1–12. As pumping pro-gressed during a trial, explosion probability increased exponen-tially. The task was self-paced, such that participants could make decisions to pump or cash out at their own pace. The task was adapted for use with fMRI and was performed during a 9 minute run. Findings from the fMRI data are reported else-where (Telzeret al., 2013). Participants received total earnings at the end of the task.
Response variability was measured by calculating the coeffi-cient of variation (CV), which has previously been used as a measure of response variability on the BART (Congdonet al., 2013; DeMartiniet al., 2014). Values were calculated for cash-out and explosion trials in the following manner:
CVcashout¼
SD total pumps across cash½ out trials Mean total pumps across cash½ out trials
CVexplosion¼ SD total pumps across explosion trials
½
Mean total pumps across explosion trials½
Since many of the statistics in this article rely on mean and SD, the distribution of the data, as based on Shapiro-Wilk tests of normality, is presented in Supplementary Materials.
Questionnaire measures
Domain-Specific Risk-Taking Scale. The Domain-Specific Risk-Taking Scale (DOSPERT; Weberet al., 2002), a 30-item self-report measure adapted for use with adolescents (Figner and Weber, 2011), was used to evaluate decision-making processes in
real-world domains. Participants were instructed to rate the likelihood that they would engage in risky activities using a 7-point Likert scale (1¼‘extremely unlikely’ to 7 ¼‘extremely likely’) in addition to indicating perceived risk attitudes (1¼‘not at all risky’ to 7¼‘extremely risky’) and expected benefits (1¼ ‘no benefits at all’ to 7¼‘great benefits’) of each activity. Risky activities were categorized by five situational domains: financial (e.g. ‘betting all your pocket money on the outcome of a sporting event’), health/safety (e.g. ‘drinking at a party’), recreational (e.g. ‘skateboarding down a steep hill’), ethical (e.g. ‘cheating on an exam’) and social (e.g. ‘speaking out against a popular opin-ion at school’). Cronbach’s alphas for these domains were 0.87, 0.91, 0.80, 0.87 and 0.78, respectively.
Image acquisition
Imaging data were collected using a 3 Tesla Siemens Trio MRI scanner. Diffusion weighted images were acquired using an echo-planar imaging sequence (64 directions, TR/TE ¼ 7200/ 93 ms, 50 slices; slice thickness¼2 mm, FOV¼190 mm, voxel size¼222 mm). This sequence also provides a T2-weighted volume (B0).
Image processing and statistical analyses
DTI processing and voxelwise statistical analysis were per-formed with FSL v4.1.6 (www.fmrib.ox.ac.uk/fsl). Datasets were corrected for head motion, eddy current distortion, and signal loss using the FMRIB Diffusion Toolbox. Two participants dis-played>3 mm of translational motion and were excluded from analyses for a final sample size of 46 [14–16 years (Mage¼14.80; 25 females)]. Degree of diffusion was assessed with FA and MD.
Voxelwise statistical analysis of the FA and MD data was car-ried out using TBSS (Smithet al., 2006), part of FSL (Smithet al., 2004). TBSS projects all subjects’ FA data onto a mean FA tract skeleton, before applying voxelwise cross-subject statistics. To minimize partial-volume effects and areas of high inter-subject variability, values were thresholded at FA>0.2. Data from each point on the skeleton formed the basis of voxelwise statistical comparisons. DTI-based voxelwise statistics were carried out using FSL Randomise with 5000 permutations and a standard GLM design. Randomise (FMRIB’s Software Library, www.fmrib. ox.ac.uk/fsl/) uses a permutation based statistical inference that does not rely on a Gaussian distribution (Nichols and Holmes, 2002). A single-group average with covariate design was applied to assess voxelwise differences among individuals based on be-havioral variables of interest (e.g. response variability), which were demeaned and individually entered as regressors in the GLM model. A statistical thresholdP<0.05, corrected for mul-tiple comparisons with familywise error correction (FWE) and Threshold-Free Cluster Enhancement (TFCE), was used for ana-lyses. TFCE helps identify cluster-like structures in images with-out definition of an initial cluster-forming threshold or carrying out a large amount of data smoothing (Smith and Nichols, 2009). The same procedure is carried out for MD data. Identification of the significant white-matter tracts revealed by TBSS was based on the Johns Hopkins University—ICBM-DTI-81 white-matter labels atlas and the white-matter tractography atlas (Wakanaet al., 2004). Results were thickened using tbss_fill for visualization.
Results
Behavioral results
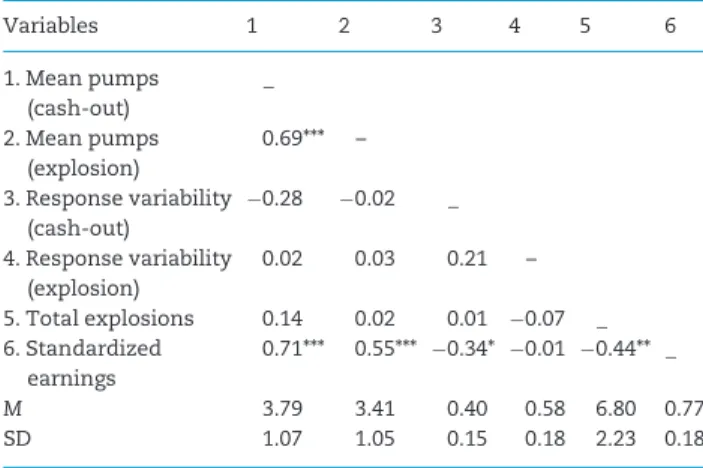
Measures of interest for task performance were: mean pumps on cash-out trials, mean pumps on explosion trials, response variability on cash-out trials, response variability on explosion trials, task earnings, and number of explosions. Descriptive statistics and associations between earnings and each BART variable are listed in Table 1. Explosion trials represented 34% of total trials (SD¼0.1). Participants pumped significantly more during cash-out compared with explosion trials [t(45) 3.06,P<
0.01] and had greater response variability on explosion trials compared with cash-out trials [t(45)¼ 5.52;P<0.001]. Due to the self-paced nature of the task, participants were presented with different total numbers of balloons (M¼28.67, SD¼3.69). As such, total task earnings for each participant were divided by number of balloons presented to standardize task earnings.
There was no significant association between response vari-ability and age for cash-out or explosion trials. An independent samplest-test revealed no gender differences in response vari-ability for cash-out trials, but a significant difference for explo-sion trials t(44) ¼ 3.14, P < 0.01, with males exhibiting significantly higher response variability (M ¼0.66, SD¼0.18) than females (M¼0.49, SD¼0.16). Results are reported for equal variances assumed, as Levene’s test for the homogeneity of variance was not violatedF(1,44)¼0.30,P¼0.59.
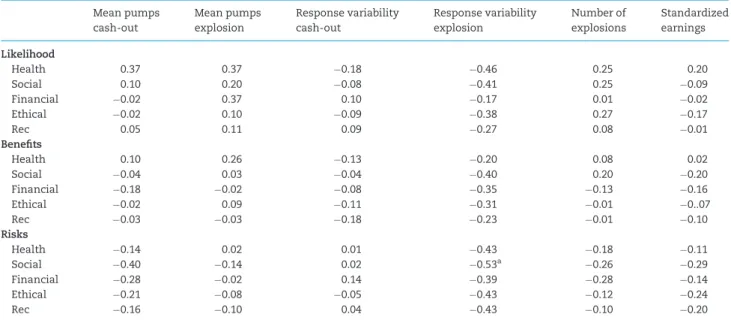
Descriptive statistics and normality of DOSPERT measures are reported in Table 2. Associations between DOSPERT meas-ures and task performance were examined and Bonferroni cor-rected for multiple comparisons, reported in Table 3. A significant negative association between response variability on explosion trials and perceived risk attitudes for risky behaviors in the social domain was found (r¼ 0.53,P<0.001). In other words, adolescents with greater response variability rated real-world examples of socially risky behaviors (e.g. ‘speaking out against a popular opinion at school’) as less risky. All results re-mained after controlling for age and gender. No other signifi-cant associations between task performance and self-report were observed.
Main effects of gender and age on DTI indices
WM microstructure was assessed using FA and MD. Main effects of gender were examined, revealing significantly higher FA val-ues for males compared with females. Tracts of significance
Table 1.Correlations and descriptive statistics for task performance
Variables 1 2 3 4 5 6
1. Mean pumps (cash-out)
_
2. Mean pumps (explosion)
0.69*** –
3. Response variability (cash-out)
0.28 0.02 _
4. Response variability (explosion)
0.02 0.03 0.21 –
5. Total explosions 0.14 0.02 0.01 0.07 _
6. Standardized earnings
0.71*** 0.55*** 0.34* 0.01 0.44** _
M 3.79 3.41 0.40 0.58 6.80 0.77
SD 1.07 1.05 0.15 0.18 2.23 0.18
included the anterior thalamic radiation, anterior and poster limb of the internal capsule, external capsule, inferior fronto-occipital fasciculus, splenium of the corpus callosum, posterior thalamic radiation, inferior longitudinal fasciculus, superior and anterior corona radiata and the corticospinal tract (Table 4). There were no tracts in which females exhibited higher FA than males. There were no significant correlations with FA and age. No significant correlations were found between MD and gender or age.
Correlations between DTI indices and behavioral measures
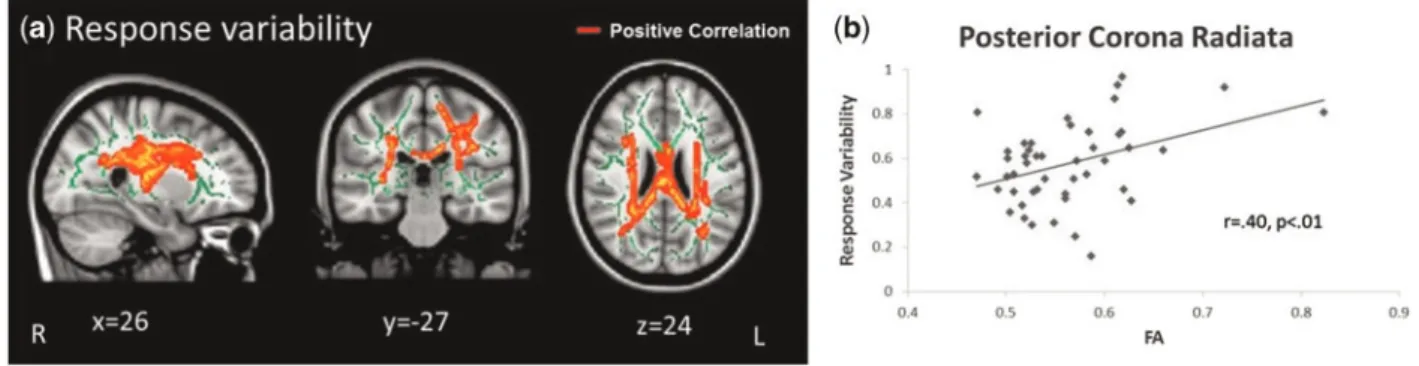
Analyses between FA values and task performance revealed an association with respect to response variability on explosion tri-als. Results identified a significant positive correlation (P<0.05,
corrected for FWE) in the superior, posterior, and anterior cor-ona radiata, anterior thalamic radiation, superior longitudinal fasciculus, body and splenium of the corpus callosum and pos-terior limb of the internal capsule (Table 5; Figure 2A and B). Analyses remained significant after controlling for gender and age. There were no significant negative correlations between FA and response variability on explosion trials. As there were no significant findings for response variability during cash-out tri-als, discussion of results will refer to ‘response variability’ with respect to explosion trials. Additional analyses examined the correlation between FA and response variability within males and females separately, but no significant associations were found. There were no significant correlations between FA and other measures of task performance. No significant associations were found with MD and task performance.
With respect to self-reported decision making in behavioral domains relevant to adolescents’ real-world choices (i.e. the DOSPERT), there was a significant negative association between FA and perceived risk attitudes for risk taking in the social
Table 3.Correlations between task performance and DOSPERT measures
Mean pumps cash-out
Mean pumps explosion
Response variability cash-out
Response variability explosion
Number of explosions
Standardized earnings
Likelihood
Health 0.37 0.37 0.18 0.46 0.25 0.20
Social 0.10 0.20 0.08 0.41 0.25 0.09
Financial 0.02 0.37 0.10 0.17 0.01 0.02
Ethical 0.02 0.10 0.09 0.38 0.27 0.17
Rec 0.05 0.11 0.09 0.27 0.08 0.01
Benefits
Health 0.10 0.26 0.13 0.20 0.08 0.02
Social 0.04 0.03 0.04 0.40 0.20 0.20
Financial 0.18 0.02 0.08 0.35 0.13 0.16
Ethical 0.02 0.09 0.11 0.31 0.01 0..07
Rec 0.03 0.03 0.18 0.23 0.01 0.10
Risks
Health 0.14 0.02 0.01 0.43 0.18 0.11
Social 0.40 0.14 0.02 0.53a 0.26 0.29
Financial 0.28 0.02 0.14 0.39 0.28 0.14
Ethical 0.21 0.08 0.05 0.43 0.12 0.24
Rec 0.16 0.10 0.04 0.43 0.10 0.20
aSignificant using Bonferroni adjusted alpha levels of 0.0006 per test (0.05/90). Table 2.Descriptive statistics for DOSPERT measures
DOSPERT M SD
Engagement
Healtha 2.67 1.10
Sociala 3.0 1.04
Financial 1.73 0.82
Ethicala 4.57 0.82
Rec 2.91 1.33
Perceived benefits
Health 2.30 1.14
Social 3.07 1.24
Financial 2.63 1.26
Ethical 4.65 1.00
Rec 3.28 1.60
Risk attitudes
Health 5.27 1.45
Sociala 4.14 1.34
Financiala 4.11 1.75
Ethicala 6.28 1.31
Reca 4.57 1.39
aMeasure met tests for normality (P<0.05).
Table 4.Regions of FA that differed by gender
Region x y Z P-value Voxels
Male>Female
R anterior thalamic radiation 11 0 10 0.03 10 265
R inferior fronto-occipital fasciculus 30 31 12 0.04
Splenium of corpus callosum 10 33 23 0.04
R anterior limb of internal capsule 10 0 0 0.03
L posterior limb of internal capsule 25 15 9 0.02 4251
L posterior thalamic radiation 31 66 0 0.04
L inferior longitudinal fasciculus 40 36 0 0.04
L superior corona radiata 19 12 43 0.05 426
L external capsule 29 11 9 0.05 130
L anterior corona radiata 16 23 14 0.05 101
L corticospinal tract 21 30 42 0.05 89
L inferior fronto-occipital fasciculus 39 31 8 0.05 15
domain in the posterior and superior corona radiata, superior longitudinal fasciculus, posterior thalamic radiation, and body of the corpus callosum (Table 6; Figure 3A and B). There was also a significant positive association between this DOSPERT measure and MD in the posterior and anterior thalamic radi-ations, posterior, superior, and anterior corona radiata, body and splenium of the corpus callosum, posterior and anterior limb of the internal capsule, superior longitudinal fasciculus, in-ferior front-occipital fasciculus, and uncinate fasciculus (Table 6; Figure 3C and D). There was also a significant negative associ-ation between FA and perceived risk attitudes for risk taking in the health domain; however, since this DOSPERT measure did not meet assumptions of normality, results are not reported here. There were no other significant associations between self-report and FA or MD. All analyses were corrected for age and gender.
Discussion
This study examined the association between adolescent response variability and white matter microstructure. Adolescents with greater FA exhibited more response variability on a risk taking task and had lower perceptions of real-world risk than those with less FA. We speculate that response vari-ability during adolescence reflects the natural tendency to approach and explore the environment despite the potential
for negative consequences, during a developmental period when individuals are primed to distance themselves from the safety of caregivers (Elliset al., 2012; Spear, 2000). In this study, this behav-ior was associated with lower salience of social risks, a domain that is perhaps most relevant to adolescent development.
Response variability during the task was associated with greater FA in tracts connecting cortical and subcortical struc-tures hypothesized to underpin decision making under risk and uncertainty (Bartraet al., 2014). For example, the corona radiata is an important tract connecting the anterior cingulate cortex (ACC) to regions such as the striatum (Moriet al., 2009). The ACC is part of an attentional network implicated in monitoring sali-ent environmsali-ental cues (Tanget al., 2010). The corona radiata
Fig. 2.Significant correlation between FA and response variability on laboratory task. (a) Positive correlation between FA and response variability (x¼26, y¼ 27, z¼24).
(b)Scatterplot showing a visual depiction of the association within the posterior corona radiata shown in (a) (r¼0.40,P<0.01). Results remained significant in analyses conducted without the apparent outlier (r¼0.36,P<0.05). The mean white matter skeleton is shown in green. Coordinates presented in MNI space. L, left; R, right. Table 5.Regions of FA that correlated with task performance
Region x y z P-value Voxels
Positive correlations with FA
Response variability
R posterior corona radiata 26 25 22 0.01 9268
L posterior corona radiata 26 28 27 0.03
R superior corona radiata 28 7 29 0.01
L superior corona radiata 26 7 22 0.02
L anterior corona radiata 23 29 2 0.03
R anterior thalamic radiation 24 39 27 0.01
Body of corpus callosum 8 19 27 0.02
Splenium of corpus callosum 13 40 21 0.02
R superior longitudinal fasciculus 28 13 27 0.02
L superior longitudinal fasciculus 35 31 27 0.04
L posterior limb of internal capsule 23 9 14 0.03
Note: x, y and z refer to MNI coordinates; p-values controlled for multiple com-parisons with family-wise error correction (i.e. ‘FWE-corrected’); Voxels refers to the number of voxels in each significant cluster; L and R refer to left and right hemispheres.
Table 6.Regions of FA and MD that correlated with self-report
Region x y z P-value Voxels
Negative correlations with FA
Perceived risk attitudes (social domain)
R posterior corona radiata 2746 24 0.04 2102
R superior corona radiata 2219 38 0.04
R superior longitudinal fasciculus 2660 32 0.05
Body of corpus callosum 1019 29 0.05
L posterior thalamic radiation 3246 12 0.05 202
Positive Correlations with MD
Perceived risk attitudes (social domain)
R posterior thalamic radiation 3354 14 0.01 21 622
R anterior thalamic radiation 2436 27 0.01
Body of corpus callosum 7 2 26 0.01
Splenium of corpus callosum 934 22 0.01
R posterior corona radiata 2736 21 0.01
L posterior corona radiata 2734 22 0.03
L superior corona radiata 2813 20 0.02
R superior corona radiata 27 4 32 0.03
R posterior limb of internal capsule
2113 3 0.03
L anterior limb of internal capsule 12 1 2 0.04
L inferior fronto-occipital fasciculus3730 2 0.03
R superior longitudinal fasciculus 3843 32 0.03
L superior longitudinal fasciculus 50433 0.04
L uncinate fasciculus 27 166 0.05
R anterior corona radiata 28 17 25 0.05 243
L anterior corona radiata 26 17 12 0.05
continues ventrally and becomes the internal capsule, a subcor-tical structure that physically separates regions important for motivation (Haber, 2003) and contains a high concentration of motor projection fibers (Werringet al., 1998). Response variabil-ity under conditions of risk may involve the integration of path-ways that mediate attention, motivation, and motor control.
It makes adaptive sense for higher response variability to be associated with greater FA within these tracts in adolescents, given that adolescent risky decision making varies depending on context (Chein et al., 2011), motivation (Geier et al., 2010, 2009) and the probability of a positive outcome (Barkley-Levenson and Galvan, 2014). White matter structure continues to shape and strengthen well into adolescence (Hagmannet al., 2010), which may grant an adaptive flexibility optimized to navigate the uncertainty typically encountered in the environ-ment at the time of an individual’s transition to independence (Spear, 2000; Crone and Dahl, 2012). Associations with response variability were found for FA and not MD. FA is hypothesized to reflect microstructural properties of white matter (e.g. increased tract organization, greater myelination, or denser axon packing) though is not sensitive enough to characterize specific tissue changes (Alexander et al., 2011). MD may be a more robust measurement of white matter maturation, but only in fiber tracts without a high degree of organization (Schmithorstet al., 2002). Perhaps response variability in adolescents is related to fine-scale organization rather than large-scale changes in myelination. This speculation is consonant with the ongoing development of white matter that continues through the mid-adolescent years and into the mid-20s (Ladouceuret al., 2012).
In this study, participant self-report provided information on the real-world domains potentially most important for ado-lescent behavior. Individuals who evaluated risky behaviors as
less risky (i.e. perceived risk attitudes) demonstrated greater FA and lower MD, specifically for behaviors within the social do-main. Socially risky behaviors may provide adolescents with the experiences most relevant to fostering adult independence and peer connection (e.g. ‘disagreeing with an authority figure on a major issue’). Tracts of significance included frontolimbic connections such as the anterior thalamic radiation, which con-nects nerve fibers between the thalamus and the prefrontal cor-tex (Wakanaet al., 2004). The prefrontal cortex is critical for higher-level cognition (Miller and Cohen, 2001) and undergoes protracted development well into adolescence (Giedd et al., 1999; Sowellet al., 2003). The thalamus has a central position within the basal ganglia loops and drives attentional and behav-ioral shifts to changing external cues (Smith et al., 2011). As such, it is an important structure in the reward neurocircuitry that links motivation with complex behavioral response (Cho
et al., 2013). Self-report complemented task performance find-ings, such that adolescents with greater response variability on the risk taking task were more likely to evaluate real-world be-haviors as less risky. This suggests that lower salience of the potential negative consequences of risk is related to a greater willingness to engage with uncertainty through more response variability. No associations were observed for FA or MD and like-lihood to engage in risky behaviors in the current study. While these adolescents may perceive risk taking as less risky, they are not necessarily engaging in these behaviors in the real-world.
The goal of this study was to examine the association be-tween white matter microstructure and risk taking on the BART. Exploratory analyses revealed that the measure most consistently and significantly associated with FA and adoles-cent self-report was response variability on explosion trials.
Although mean number of pumps on cash-out trials is the com-monly used measure of risk taking on the BART, research in re-cent years has begun exploring response variability on task as a unique predictor of behavior. Reports of response variability on cash-out trials have typically observed this parameter to be associated with lower task earnings (Jentsch et al., 2010; DeMartiniet al., 2014), a finding upheld in the present study. It is hypothesized that response variability on cash-out trials re-flects combinations of both higher than optimal and lower than optimal trials completions (Jentschet al., 2010). Alternatively, explosion trials may reflect adaptive sensation seeking or ex-ploratory behavior on the task, as suggested by prior studies. For example, one study operationalized number of explosions as a measure of untempered risk-taking, given that participants with higher levels of sensation seeking made more explosions (Humphreyset al., 2013). Another study found an association be-tween a greater number of explosion trials and higher levels of neurobiological indicators of maturity in boys (Peperet al., 2013). The authors hypothesize that more advanced pubertal develop-ment (greater endogenous testosterone) may lead to more sen-sation seeking (the thrill of pumping the balloon further) in the service of task exploration. Highlighting the importance of ex-plosion trials in exploring task environment, another study found increased activation in regions of the brain implicated in feedback processing (e.g. insula, ACC, lateral PFC) during explo-sions compared with cash-outs (Claus and Hutchison, 2012).
We hypothesize that response variability during explosion trials demonstrated significant associations with FA because explosion trials provide feedback on the outcome likelihood of a negative consequence of a risky choice, while cash-out trials do not. Prior work has demonstrated that the adolescent brain is uniquely sensitive to unexpected outcome feedback, over and above reward valuation (Cohenet al., 2010). There is an implicit assumption that trials ending in explosions do so independ-ently of respondents’ behavior. This assumption is incorrect, given that the more times respondents choose the risky option within a trial, the more likely the trial will terminate with an ex-plosion (Pleskacet al., 2008). We posit that response variability on explosion trials represents a response pattern that facilitates a wider range of experience with the unknown probability dis-tribution of negative consequences of the task. This interpret-ation is supported by the finding that adolescents who rated real-world examples of risk taking behaviors as less risky also exhibited greater response variability on explosion trials. In other words, greater response variability on explosion trials was likely related to a decreased salience of potential negative out-comes (explosions) when evaluating risky choice (deciding to continue pumping on a trial).
It is important to note the limitations of the present findings. First, there were no child or adult comparison groups, which would have allowed for an examination of whether response variability during risky choice develops linearly over time or is uniquely manifested during adolescence. However, adolescents have a high degree of individual differences with respect to risky choice (van Duijvenvoordeet al., 2015) and this behavior may be most developmentally appropriate during this period. By implementing a narrow age range, the potential effects of age-related differences in neuronal maturation were mini-mized. Second, pubertal status was not assessed. Males demon-strated significantly higher FA (but not MD) compared with females of the same age. This finding is consistent with prior lit-erature showing that boys demonstrate greater absolute and relative white matter volumes compared with girls and consid-erably steeper white matter increases during adolescence
(Gieddet al., 1999; De Belliset al., 2001; Lenrootet al., 2007; Perrin
et al., 2009), perhaps due to the presence of testosterone (Hertinget al., 2012, but see Peperet al., 2015). The collection of pubertal hormone measures will be crucial to understand how sex hormones shape the developing brain. Finally, this study was not longitudinal, which precludes inferences of directionality.
Despite limitations, the present study contributes to our growing understanding of the dynamic nature of adolescent be-havior and its neural underpinnings. Dominant views of adoles-cent risk taking have previously emphasized its maladaptive nature (e.g. Laveryet al., 1993); however, risk taking can result in optimized outcome and adaptive learning (Humphreys et al., 2013; Peperet al., 2013; Reynaet al., 2011). The present study pro-vides novel evidence that response variability during a dynamic risk taking task is supported by lower perceived risk attitudes and increased FA. Much like an infant gaining the mobility to walk, behavioral variability in adolescents under conditions of risk or uncertainty may facilitate developmentally-appropriate behavior in the service of exploring relevant environments. The peaks and valleys of variability during adolescence may, de-pending on the vantage point, reflect points of susceptibility or windows of opportunity and growth.
Supplementary data
Supplementary data are available atSCANonline.
Conflict of interest. None declared.
Funding
This research was supported in part by a grant from the National Science Foundation dissertation improvement grant (EHT), NICHD (RO1 HD057164) (AJF, AG, MDL), UCLA Center for Culture, Brain, and Development (DG), SRCD Dissertation Grant (EHT), the UC MEXUS Dissertation Grant (EHT), a Scholars Grant from the William T. Grant Foundation (AG), the Jeffrey/Wenzel Chair in Behavioral Neuroscience (AG), a Mentoring Grant from the William T. Grant Foundation (AG, DG), and a National Science Foundation Predoctoral Fellowship (DG).
References
Alexander, A.L., Hurley, S.A., Samsonov, A.A., et al. (2011). Characterization of cerebral white matter properties using quantitative magnetic resonance imaging stains. Brain Connectivity1(6), 423–46.
Barkley-Levenson, E., Galvan, A. (2014). Neural representation of expected value in the adolescent brain. Proceedings of the National Academy of Sciences,111(4), 1646–51.
Barnea-Goraly, N., Menon, V., Eckert, M.,et al. (2005). White mat-ter development during childhood and adolescence: a cross-sectional diffusion tensor imaging study. Cerebral Cortex, 15(12), 1848–54.
Bartra, O., McGuire, J.T., Kable, J.W. (2013). The valuation system: a coordinate-based meta-analysis of BOLD fMRI experiments examining neural correlates of subjective value.Neuroimage, 76, 412–27.
Basser, P.J. (1995). Inferring microstructural features and the physiological state of tissues from diffusion-weighted images.
Bava, S., Tapert, S.F. (2010). Adolescent brain development and the risk for alcohol and other drug problems.Neuropsychology Review,20(4), 398–413.
Beaulieu, C. (2002). The basis of anisotropic water diffusion in the nervous system–a technical review. NMR in Biomedicine, 15(7–8), 435–55.
Chein, J., Albert, D., O’Brien, L., Uckert, K., Steinberg, L. (2011). Peers increase adolescent risk taking by enhancing activity in the brain’s reward circuitry.Developmental Science,14(2), F1–10. Cho, Y.T., Fromm, S., Guyer, A.E.,et al. (2013). Nucleus
accum-bens, thalamus and insula connectivity during incentive an-ticipation in typical adults and adolescents. Neuroimage, 66, 508–21.
Claus, E.D., Hutchison, K.E. (2012). Neural mechanisms of risk taking and relationships with hazardous drinking.Alcoholism: Clinical and Experimental Research,36(6), 932–40.
Cohen, J.R., Asarnow, R.F., Sabb, F.W.,et al. (2010). A unique ado-lescent response to reward prediction errors. Nature Neuroscience,13(6), 669–71.
Congdon, E., Bato, A.A., Schonberg, T.,et al. (2013). Differences in neural activation as a function of risk-taking task parameters.
Frontiers in Neuroscience,7, 173.
Crone, E.A., Dahl, R.E. (2012). Understanding adolescence as a period of social–affective engagement and goal flexibility.
Nature Reviews Neuroscience,13(9), 636–50.
Crone, E.A., Duijvenvoorde, A.C., Peper, J.S. (2016). Annual Research Review: Neural contributions to risk-taking in adolescence: Developmental changes and individual differ-ences. Journal of Child Psychology and Psychiatry and Allied Disciplines,Nature Neuroscience,57(3), 353–68
De Bellis, M.D., Keshavan, M.S., Beers, S.R.,et al. (2001). Sex differ-ences in brain maturation during childhood and adolescence.
Cerebral Cortex,11(6), 552–7.
DeMartini, K.S., Leeman, R.F., Corbin, W.R.,et al. (2014). A new look at risk-taking: Using a translational approach to examine risk-taking behavior on the balloon analogue risk task.
Experimental and Clinical Psychopharmacology,22(5), 444. Ellis, B.J., Del Giudice, M., Dishion, T.J.,et al. (2012). The
evolution-ary basis of risky adolescent behavior: implications for science, policy, and practice.Developmental Psychology,48(3), 598. Figner, B., Weber, E.U. (2011). Who takes risks when and why?
Determinants of risk taking.Current Directions in Psychological Science,20(4), 211–6.
Giedd, J.N., Blumenthal, J., Jeffries, N.O.,et al. (1999). Brain devel-opment during childhood and adolescence: a longitudinal MRI study.Nature Neuroscience,2(10), 861–3.
Geier, C.F., Terwilliger, R., Teslovich, T., Velanova, K., Luna, B. (2010). Immaturities in reward processing and its influence on inhibitory control in adolescence. Cerebral Cortex, 20(7), 1613–29.
Haber, S.N. (2003). The primate basal ganglia: parallel and inte-grative networks. Journal of chemical neuroanatomy, 26(4), 317–30.
Hagmann, P., Sporns, O., Madan, N.,et al. (2010). White matter maturation reshapes structural connectivity in the late de-veloping human brain.Proceedings of the National Academy of Sciences of the United States of America,107(44), 19067–72. Herting, M.M., Maxwell, E.C., Irvine, C., Nagel, B.J. (2012). The
im-pact of sex, puberty, and hormones on white matter micro-structure in adolescents.Cerebral Cortex,22(9), 1979–92. Humphreys, K., Lee, S., Tottenham, N. (2013). Not all risk taking
behavior is bad: Associative sensitivity predicts learning dur-ing risk takdur-ing among high sensation seekers.Personality and Individual Differences,54, 708–15.
Jentsch, J.D., Woods, J.A., Groman, S.M., Seu, E. (2010). Behavioral characteristics and neural mechanisms mediating perform-ance in a rodent version of the Balloon Analog Risk Task.
Neuropsychopharmacology,35(8), 1797–806.
Ladouceur, C.D., Peper, J.S., Crone, E.A., Dahl, R.E. (2012). White matter development in adolescence: the influence of puberty and implications for affective disorders. Developmental Cognitive Neuroscience,2(1), 36–54.
Lavery, B., Siegel, A.W., Cousins, J.H., Rubovits, D.S. (1993). Adolescent risk-taking: An analysis of problem behaviors in problem children.Journal of Experimental Child Psychology,55(2), 277–94.
Lejuez, C.W., Read, J.P., Kahler, C.W.,et al. (2002). Evaluation of a behavioral measure of risk taking: the Balloon Analogue Risk Task (BART).Journal of Experimental Psychology: Applied,8(2), 75. Lenroot, R.K., Gogtay, N., Greenstein, D.K.,et al. (2007). Sexual
di-morphism of brain developmental trajectories during child-hood and adolescence.Neuroimage,36(4), 1065–73.
Luna, B., Padmanabhan, A., O’Hearn, K. (2010). What has fMRI told us about the development of cognitive control through adolescence?Brain and Cognition,72(1), 101–13.
Miller, E.K., Cohen, J.D. (2001). An integrative theory of prefrontal cortex function.Annual Review of Neuroscience,24(1), 167–202. Mori, S., Oishi, K., Faria, A.V. (2009). White matter atlases based
on diffusion tensor imaging.Current Opinion in Neurology,22(4), 362.
Nichols, T.E., Holmes, A.P. (2002). Nonparametric permutation tests for functional neuroimaging: a primer with examples.
Human Brain Mapping,15(1), 1–25.
Peper, J.S., Koolschijn, P.C.M., Crone, E.A. (2013). Development of risk taking: contributions from adolescent testosterone and the orbito-frontal cortex. Journal of Cognitive Neuroscience, 25(12), 2141–50.
Peper, J.S., de Reus, M.A., van den Heuvel, M.P., Schutter, D.J. (2015). Short fused? associations between white matter con-nections, sex steroids, and aggression across adolescence.
Human Brain Mapping,36(3), 1043–52.
Perrin, J.S., Leonard, G., Perron, M.,et al. (2009). Sex differences in the growth of white matter during adolescence.Neuroimage, 45(4), 1055–66.
Piek, J.P. (2002). The role of variability in early motor develop-ment.Infant Behavior and Development,25(4), 452–65.
Pleskac, T.J., Wallsten, T.S., Wang, P., Lejuez, C.W. (2008). Development of an automatic response mode to improve the clinical utility of sequential risk-taking tasks.Experimental and Clinical Psychopharmacology,16(6), 555.
Reyna, V., Estrada, S., DeMarinis, J., Myers, R., Stanisz, J., Mills, B. (2011). Neurobiological and memory models of risky decision making in adolescents versus young adults. Journal of Experimental Psychology. Learning, Memory and Cognition, 37, 1125–42.
Schmithorst, V.J., Wilke, M., Dardzinski, B.J., Holland, S.K. (2002). Correlation of white matter diffusivity and anisotropy with age during childhood and adolescence: a cross-sectional diffu-sion-tensor MR imaging study 1.Radiology,222(1), 212–8. Spear, L.P. (2000). The adolescent brain and age-related
behav-ioral manifestations.Neuroscience & Biobehavioral Reviews,24(4), 417–63.
Smith, L.B., Thelen, E. (2003). Development as a dynamic system.
Trends in Cognitive Sciences,7(8), 343–8.
Smith, S.M., Jenkinson, M., Johansen-Berg, H.,et al. (2006). Tract-based spatial statistics: voxelwise analysis of multi-subject diffusion data.Neuroimage,31(4), 1487–505.
Smith, S.M., Nichols, T.E. (2009). Threshold-free cluster enhance-ment: addressing problems of smoothing, threshold dependence and localisation in cluster inference.Neuroimage,44(1), 83–98. Smith, Y., Surmeier, D.J., Redgrave, P., Kimura, M. (2011). Thalamic
contributions to basal ganglia-related behavioral switching and reinforcement.The Journal of Neuroscience,31(45), 16102–6. Sowell, E.R., Peterson, B.S., Thompson, P.M., Welcome, S.E.,
Henkenius, A.L., Toga, A.W. (2003). Mapping cortical change across the human life span.Nature Neuroscience,6(3), 309–15. Steinberg, L. (2007). Risk taking in adolescence new perspectives
from brain and behavioral science. Current Directions in Psychological Science,16(2), 55–9.
Tang, Y.Y., Lu, Q., Geng, X., Stein, E.A., Yang, Y., Posner, M.I. (2010). Short-term meditation induces white matter changes in the anterior cingulate.Proceedings of the National Academy of Sciences of the United States of America,107(35), 15649–52. Telzer, E.H., Fuligni, A.J., Lieberman, M.D., Galvan, A. (2013).
Meaningful family relationships: Neurocognitive buffers of
adolescent risk taking.Journal of Cognitive Neuroscience,25(3), 374–87.
van Duijvenvoorde, A.C., Huizenga, H.M., Somerville, L.H.,et al. (2015). Neural correlates of expected risks and returns in risky choice across development.The Journal of Neuroscience,35(4), 1549–60.
Wakana, S., Jiang, H., Nagae-Poetscher, L.M., Van Zijl, P.C., Mori, S. (2004). Fiber tract–based atlas of human white matter anat-omy 1.Radiology,230(1), 77–87.
Weber, E.U., Blais, A.R., Betz, N.E. (2002). A domain-specific risk-attitude scale: Measuring risk perceptions and risk behaviors.
Journal of Behavioral Decision Making,15(4), 263–90.
Werring, D.J., Clark, C.A., Barker, G.J.,et al. (1998). The structural and functional mechanisms of motor recovery: complemen-tary use of diffusion tensor and functional magnetic resonance imaging in a traumatic injury of the internal cap-sule. Journal of Neurology, Neurosurgery and Psychiatry, 65(6), 863–9.
Zilles, K., Amunts, K. (2013). Individual variability is not noise.