Sex-specific associations of low
birth weight with adult-onset
diabetes and measures of glucose
homeostasis: Brazilian Longitudinal
Study of Adult Health
James Yarmolinsky
1, Noel T Mueller
2,3, Bruce B Duncan
1,4, Dóra Chor
5, Isabela M Bensenor
6,7,
Rosane H
Griep
8, Lawrence J Appel
2,3, Sandhi M Barreto
9& Maria Inês Schmidt
1,4Emerging evidence suggests sex differences in the early origins of adult metabolic disease, but this has been little investigated in developing countries. We investigated sex-specific associations between low birth weight (LBW; <2.5 kg) and adult-onset diabetes in 12,525 participants from the Brazilian Longitudinal Study of Adult Health (ELSA-Brasil). Diabetes was defined by self-reported information and laboratory measurements. In confounder-adjusted analyses, LBW (vs. 2.5–4 kg) was associated with higher prevalence of diabetes in women (Prevalence Ratio (PR) 1.54, 95% CI: 1.32–1.79), not in men (PR 1.06, 95% CI: 0.91–1.25; Pheterogeneity= 0.003). The association was stronger among participants with maternal diabetes (PR 1.60, 95% CI: 1.35–1.91), than those without (PR 1.15, 95% CI: 0.99–1.32; Pheterogeneity= 0.03). When jointly stratified by sex and maternal diabetes, the association was observed for women with (PR 1.77, 95% CI: 1.37–2.29) and without (PR 1.45, 95% CI: 1.20–1.75) maternal diabetes. In contrast, in men, LBW was associated with diabetes in participants with maternal diabetes (PR 1.45, 95% CI: 1.15–1.83), but not in those without (PR 0.92, 95% CI: 0.74–1.14). These sex-specific findings extended to continuous measures of glucose homeostasis. LBW was associated with higher diabetes prevalence in Brazilian women, and in men with maternal diabetes, suggesting sex-specific intrauterine effects on adult metabolic health.
A large Danish cohort study recently provided intriguing evidence that the well-established association between low birth weight and adult diabetes varies by sex1, corroborating evidence from famine studies2–7 and mice
models that the metabolic response to an adverse intrauterine environment is sex dependent8–11. An important
Bradford Hill criterion12 for inferring whether sex differences in the early origins of disease hypothesis are causal
is to examine if the sex-specific association between low birth weight and diabetes is reproducible in less econom-ically prosperous settings, where the etiology of both low birth weight and diabetes may differ.
In addition to low birth weight, maternal diabetes, a rapidly increasing problem globally13,14, may lead to
epigenetic changes during fetal development that increase future risk of adult diabetes15–20. To the best of our
knowledge, no studies have investigated whether maternal diabetes modifies the association of low birth weight and adult-onset diabetes.
1Postgraduate Program in Epidemiology, School of Medicine, Federal University of Rio Grande do Sul, Porto Alegre,
RS, Brazil. 2Department of Epidemiology, Johns Hopkins Bloomberg School of Public Health, Baltimore, MD, USA. 3Welch Center for Prevention, Epidemiology and Clinical Research, Johns Hopkins University, Baltimore, MD, USA. 4Department of Epidemiology, University of North Carolina, Chapel Hill, NC, USA. 5National School of Public Health,
Fundação Oswaldo Cruz, Rio de Janeiro, RJ, Brazil. 6Department of Clinical Medicine, Faculty of Medicine, University
of São Paulo, São Paulo, SP, Brazil. 7Center for Clinical and Epidemiological Research, University Hospital, University
of São Paulo, São Paulo, SP, Brazil. 8Laboratory of Health and Environment Education, Oswaldo Cruz Institute,
Oswaldo Cruz Foundation, Rio de Janeiro, RJ, Brazil. 9Faculty of Medicine, Federal University of Minas Gerais, Belo
Horizonte, MG, Brazil. Correspondence and requests for materials should be addressed to M.I.S. (email: maria. [email protected])
diabetes and measures of glucose homeostasis in a large multi-ethnic contemporary cohort of middle-aged and elderly Brazilians, who were born an era of chronic food insecurity but who now live in an era of easy food access. Moreover, we will capitalize on our large cohort size to explore whether having a mother with diabetes, a marker of intrauterine metabolic dysregulation, modifies the birth weight-diabetes association in a sex-specific manner.
Methods
Study design and population.
The Brazilian Longitudinal Study of Adult Health (in Portuguese, Estudo Longitudinal de Saude do Adulto or ELSA-Brasil) is a cohort study of 15,105 volunteer employees, aged 35 to 74 years at baseline (2008–2010), from universities or research institutions located in six cities in three different regions of Brazil. The details of the study, including design, eligibility criteria, sources and methods of recruit-ment, and measurements obtained, have been described in detail elsewhere21,22. ELSA-Brasil was approved by theEthics Committees of the Hospital de Clínicas de Porto Alegre (06-194), Hospital Universitário da Universidade de São Paulo (669/06), Fundação Oswaldo Cruz (343/06), Universidade Federal de Minas Gerais (186/06), Universidade Federal da Bahia (027-06) and Universidade Federal do Espírito Santo (041/06). Informed consent was obtained from all participants involved in this analysis. All methods were performed in accordance with the relevant guidelines and regulations.
Exposure and covariate assessment.
We applied standardized questionnaires and measurements8. Weasked participants to recall their weight at birth as “less than 2.5 kg”, “2.5 to 4 kg”, “greater than 4 kg”, or as “I don’t know”. These first three categories were defined as low birth weight, normal birth weight, and high birth weight, respectively. Participants were also asked if they could provide their specific birth weight in kg.
Age at menarche was assessed by asking women the open-ended question, “At what age did you menstruate for the first time ?”. History of paternal diabetes was ascertained by asking participants “Was your father diagnosed with diabetes?” and history of maternal diabetes as “Was your mother diagnosed with diabetes?”. Participants who answered, “I don’t know” to either of these parental history of diabetes questions were categorized as “no” for each respective covariate in this analysis. Maternal educational attainment was ascertained by asking participants “What was the highest level of education that your mother completed?”. Body mass index (BMI) was calculated as measured weight (kg) divided by measured height squared (m2).
Outcome ascertainment.
Self-reported diabetes and use of diabetic medication were assessed by ques-tionnaire. We drew fasting blood samples and then administered a standard 75 g oral glucose tolerance test to participants without known diabetes. Glucose was measured by the hexokinase method (ADVIA Chemistry; Siemens, Deerfield, Illinois), glycated hemoglobin (HbA1c) using a high-pressure liquid chromatography(Bio-Rad Laboratories, Hercules, California), a National Glycohemoglobin Standardization Program (NGSP) certified method, and insulin with an immunoenzymatic assay (ELISA) (Siemens).
Diabetes was classified when a participant responded “yes” to either of the following questions: “Have you been previously told by a physician that you had diabetes (sugar in the blood)?” or “Have you used medication for diabetes in the past 2 weeks?”. Those who responded “no” to both questions, were classified as having diabetes when reaching the threshold for fasting plasma glucose (≥ 7.0 mmol/L [≥ 126 mg/dL]), 2-hour postload plasma glucose (≥ 11.1 mmol/L [≥ 200 mg/dL]), or HbA1c (≥ 6.5%)23,24.
Homeostatic model assessment of insulin resistance (HOMA-IR) was defined as the product of fasting glu-cose (mmol/L) and insulin levels (μ IU/mL) divided by 22.5; homeostatic model assessment of β cell function (HOMA-β ) as the product of 20 and fasting insulin (μ IU/mL) divided by fasting glucose (mmol/L) minus 3.525.
Whole body insulin sensitivity was assessed using the insulin sensitivity index (ISI-composite) proposed by DeFronzo and Matsuda applied to the fasting and 2 hour values26.
Statistical analyses.
For the current investigation we used data collected at baseline. We excluded par-ticipants with missing data for the following variables: self-recalled birth weight (n = 2228), race/skin color (n = 184), maternal education level (n = 366), BMI (n = 6), and laboratory measurements (n = 17). Some par-ticipants had missing data for two or more variables. Our main analyses were performed in 12,525 parpar-ticipants (82.9% of ELSA-Brasil).Poisson regression with robust variance was performed to generate prevalence ratios (PRs) and 95% con-fidence intervals (CIs) for the association of categories of birth weight with diabetes. In Model 1, we present a model adjusted for age and study center. In Model 2, we additionally include risk factors for low birth weight and diabetes that were unlikely to lie on the causal pathway between birth weight and adult diabetes (race/color, maternal education, father diagnosed with diabetes). In Model 3, we additionally add measured BMI obtained at the ELSA site to investigate its potential mediation role in the association.
Analysis of covariance (ANCOVA) was performed to assess the association between category of birth weight and markers of glucose and insulin homeostasis as continuous variables. Participants with previously known diabetes or missing laboratory values were excluded from these analyses (n = 1,361). All continuous markers of glucose and insulin homeostasis were log-transformed then converted to geometric means.
We performed sensitivity analyses including only participants who reported an exact birth weight consistent with their categorically reported birth weight, and sensitivity analyses excluding participants with self-reported preterm birth.
We first tested for multiplicative interaction by sex. We then tested for interactions by race/skin color (white vs. non-white), year of birth (1970 cut-point), age at menarche (≤ 12 years, > 12 years), BMI at the baseline exam-ination (< 25 kg/m2, ≥ 25 and < 30 kg/m2, ≥ 30 kg/m2), maternal history of diabetes (yes vs. no), and paternal
a sex-specific interaction. All statistical tests were two-sided and significance was defined at P< 0.05. Statistical analyses were performed with SAS 9.4 (SAS Institute, Inc., Cary, North Carolina).
Results
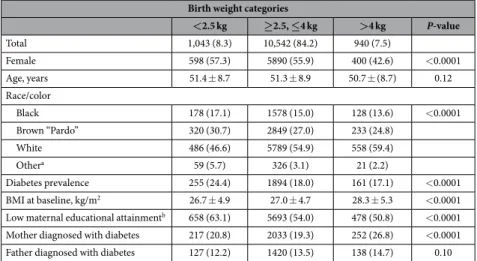
Participants in our sample were, on average, 51.3 (SD = 8.8) years of age (range: 34–75 y). As seen in Table 1, the majority (n = 10,542 or 84%) of participants reported their birth weight as between 2.5 and 4 kg. Another 1,043 (around 8% of the total) reported their birth weight as < 2.5 kg, and 940 (around 8% of the total) reported their birth weight as > 4 kg. Generally, compared to participants with high birth weight, those with low birth weight were more likely to be female, black or “pardo”, and have a mother with low educational attainment. There were 2,310 cases of diabetes.
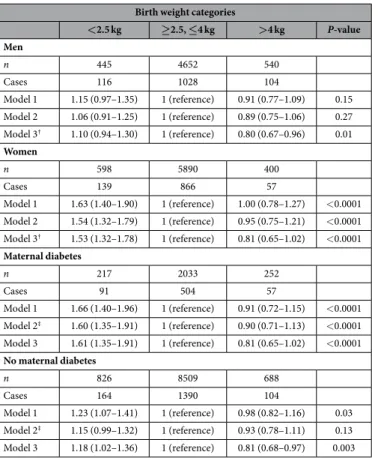
Testing for heterogeneity in the association of birth weight with diabetes identified evidence for interaction by sex (Pheterogeneity= 0.01). In multivariable-adjusted confounder models (Model 2) stratified by sex, we found an
association between low birth weight and diabetes in women (PR 1.54, 95% CI 1.32–1.79), but not in men (PR 1.06, 95% CI 0.91–1.25; Pheterogeneity= 0.003) (Table 2). In women, this association was maintained in a model
further adjusted for BMI at baseline (Model 3). We also found evidence for interaction of the association of birth weight with diabetes by maternal diabetes (Pheterogeneity= 0.046). In multivariable analyses stratified by
mater-nal diabetes, there was a stronger association between low birth weight and diabetes among participants whose mother was diagnosed with diabetes (PR 1.60, 95% CI 1.35–1.91), compared to participants whose mother was not (PR 1.15, 95% CI 0.99–1.32; Pheterogeneity= 0.03). Further adjustment for BMI did not materially change these
associations. No difference was found in the association of high birth weight with diabetes by maternal diabetes status.
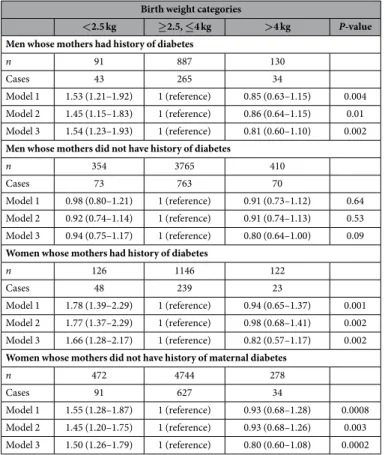
When we tested for a two-way interaction of the association of birth weight and diabetes with both sex and maternal diabetes status, we found evidence for a maternal diabetes-specific association of birth weight with diabetes among men (Pheterogeneity= 0.03), but similar associations of birth weight with diabetes among women
regardless of maternal diabetes status (Pheterogeneity= 0.57). Specifically, among men, in multivariable-adjusted
con-founder analyses, low birth weight was associated with diabetes in participants with a maternal history of diabetes (PR 1.45, 95% CI 1.15–1.83), but not in those without maternal diabetes (PR 0.92, 95% CI 0.74–1.14) (Table 3). In contrast, among women, similar associations of low birth weight and diabetes were reported between those with maternal diabetes (PR 1.77, 95% 1.37–2.29) and those without maternal diabetes (PR 1.45, 95% CI 1.20–1.75). Further adjustment for BMI did not materially change these associations.
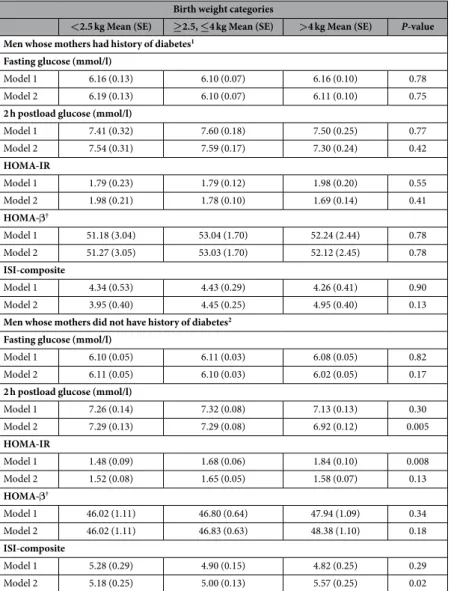
We then examined the association of birth weight with continuous glycemic measures in women and men separately. In women, we found inverse associations of birth weight with fasting and 2-hour post load glucose and positive linear associations with HOMA-β among those with and without a maternal history of diabetes (Table 4). We also found an inverse association of birth weight with HOMA-IR and a positive linear association with ISI-composite, solely among participants without maternal diabetes. In men, we found evidence for an inverted “U-shaped” association of birth weight with ISI-composite and an inverse association with 2-hour post-load glucose, solely among men without maternal diabetes (Table 5).
Our results did not appreciably change in sensitivity analyses when we included only those participants who were able to recall an exact birth weight consistent with their categorical recall of birth weight, or when we removed participants with self-reported pre-term births (Supplementary Tables S1 and S2).
Overall, high birth weight was associated with a reduced adjusted prevalence of adult-onset diabetes (PR 0.80, 95% CI 0.75–0.87). As seen in Tables 2 and 3, the strength of this association did not differ across analyses strat-ified by sex and maternal diabetes status.
Birth weight categories
<2.5 kg ≥2.5, ≤4 kg >4 kg P-value Total 1,043 (8.3) 10,542 (84.2) 940 (7.5)
Female 598 (57.3) 5890 (55.9) 400 (42.6) < 0.0001 Age, years 51.4 ± 8.7 51.3 ± 8.9 50.7 ± (8.7) 0.12 Race/color
Black 178 (17.1) 1578 (15.0) 128 (13.6) < 0.0001 Brown “Pardo” 320 (30.7) 2849 (27.0) 233 (24.8)
White 486 (46.6) 5789 (54.9) 558 (59.4) Othera 59 (5.7) 326 (3.1) 21 (2.2)
Diabetes prevalence 255 (24.4) 1894 (18.0) 161 (17.1) < 0.0001 BMI at baseline, kg/m2 26.7 ± 4.9 27.0 ± 4.7 28.3 ± 5.3 < 0.0001 Low maternal educational attainmentb 658 (63.1) 5693 (54.0) 478 (50.8) < 0.0001 Mother diagnosed with diabetes 217 (20.8) 2033 (19.3) 252 (26.8) < 0.0001 Father diagnosed with diabetes 127 (12.2) 1420 (13.5) 138 (14.7) 0.10
Table 1. Descriptive data of ELSA-Brasil participants (N = 12525) at baseline (2008–2010) according to birth weight category. Values are means and standard deviations for continuous variables and frequencies and percentages for categorical variables. Abbreviations: BMI, body mass index (kg/m2). a“Other”: those reporting
their race/skin color as “Asian” or “Indigenous. bLess than complete elementary school. P-value represents the
Finally, we did not find evidence for interactions of birth weight with race/skin color (P= 0.09), year of birth (P = 0.08), age at menarche (P= 0.41), BMI at the baseline examination (P= 0.67), or paternal diabetes (P= 0.81).
Discussion
In this analysis of 12,525 middle-aged and elderly Brazilians, we found sex-specific associations with low birth weight and prevalence of adult-onset diabetes and adult measures of glucose homeostasis (fasting and post-load hyperglycemia, insulin resistance, and β cell dysfunction). Overall, the association between low birth weight and adult-onset diabetes was stronger among those with a maternal history of diabetes. When we stratified results by both sex and maternal diabetes status, low birth weight was associated with elevated diabetes prevalence in women regardless of maternal diabetes status, while in men only when a maternal history of diabetes was present.
Our sex-specific findings are consistent with a recent report investigating 223,099 Danish adults in which women with low birth weight (2–2.75 kg) compared to women with mid-to-high birth weight (3.75–4.75 kg) had greater risk of T2D in adulthood (HR [Hazard Ratio] 1.46, 95% CI 1.34–1.59). The association was considerably weaker in men with low birthweight (HR 1.20, 95% CI 1.12–1.30)1. Other studies that have investigated this topic
in LMICs (low- and middle-income countries)27–31 have been conducted in cohorts that were younger and
con-siderably smaller in sample size than ours, which may explain why none of these studies examined effect modifi-cation by sex on the association between low birth weight and diabetes, and only one of these studies27 evaluated
and found evidence of effect modification by sex on the association between low birth weight and an early marker of impaired glucose homeostasis (i.e., elevated fasting insulin).
While sex differences have been infrequently reported for the relationship between low birth weight and dia-betes, there have been reports of effect modification by sex in the association of other measures of intrauterine nutrition and adult cardiometabolic disease. For example, studies of middle-aged adults conceived during the Dutch Famine of 1944–1945, the Nigerian Biafran Famine, the Great Depression in Reykjavik (1930–1934), and the Great Chinese Famine have reported intrauterine food scarcity is more strongly associated with elevated measures of adiposity2–4, lipids5, fasting plasma glucose4, hypertension6, the metabolic syndrome7, and diabetes
in women than men32.
The sex-specific findings in our study and the famine studies may reflect greater survival of females exposed to under nutrition in utero. The Great Chinese Famine, produced approximately a 7% decrease in the male:female
<2.5 kg ≥2.5, ≤4 kg >4 kg P-value Men
n 445 4652 540
Cases 116 1028 104
Model 1 1.15 (0.97–1.35) 1 (reference) 0.91 (0.77–1.09) 0.15 Model 2 1.06 (0.91–1.25) 1 (reference) 0.89 (0.75–1.06) 0.27 Model 3† 1.10 (0.94–1.30) 1 (reference) 0.80 (0.67–0.96) 0.01 Women
n 598 5890 400
Cases 139 866 57
Model 1 1.63 (1.40–1.90) 1 (reference) 1.00 (0.78–1.27) < 0.0001 Model 2 1.54 (1.32–1.79) 1 (reference) 0.95 (0.75–1.21) < 0.0001 Model 3† 1.53 (1.32–1.78) 1 (reference) 0.81 (0.65–1.02) < 0.0001 Maternal diabetes
n 217 2033 252
Cases 91 504 57
Model 1 1.66 (1.40–1.96) 1 (reference) 0.91 (0.72–1.15) < 0.0001 Model 2‡ 1.60 (1.35–1.91) 1 (reference) 0.90 (0.71–1.13) < 0.0001 Model 3 1.61 (1.35–1.91) 1 (reference) 0.81 (0.65–1.02) < 0.0001 No maternal diabetes
n 826 8509 688
Cases 164 1390 104
Model 1 1.23 (1.07–1.41) 1 (reference) 0.98 (0.82–1.16) 0.03 Model 2‡ 1.15 (0.99–1.32) 1 (reference) 0.93 (0.78–1.11) 0.13 Model 3 1.18 (1.02–1.36) 1 (reference) 0.81 (0.68–0.97) 0.003
Table 2. Multivariable adjusted prevalence ratios (and 95% confidence intervals) for the association of birth weight categories with adult-onset diabetes, stratified by sex and maternal diabetes: ELSA-Brasil (N = 12525). Model 1: adjusted for age, study center; Model 2: + race/color, maternal education, father diagnosed with diabetes; Model 3: + BMI at baseline. †Further adjusted for mother diagnosed with diabetes. ‡Further adjusted for sex. P-value represents the test for an overall association of the different categories
ratio of the affected birth cohort when measured 40 years later33. Higher mortality rates in men than in women
following in utero exposure to the Dutch Potato Famine of 1846–1847 and the Korean War have also been reported34,35 and several studies report greater male than female deaths among low birth weight infants36,37.
The sex-specific associations between low birth weight and diabetes may also reflect sexually dimorphic meta-bolic responses to intrauterine environs that persist throughout life. Mouse studies suggest that fetal under nutri-tion may have more impact on the development of hyperglycemia, insulin resistance, and a diminished insulin secretory response in females than males8–10. Additionally, mitochondrial oxidative phosphorylation, a key
deter-minant of energy homeostasis and contributor to insulin resistance and diabetes, was enhanced in female piglets, but not in male piglets, following a maternal low protein diet38,39. Elevated maternal testosterone during
preg-nancy associates with low birth weight in offspring40 and maternal and fetal testosterone levels have been shown
to highly correlate41. As elevated testosterone levels are associated with higher risk of T2D (type 2 diabetes) in
women, but lower T2D risk in men42, it is possible that mechanisms related to sex-steroid hormones underlie the
observed sex differences. Birth weight is positively correlated with serum leptin levels in both sexes43, but elevated
leptin is associated with risk for adult diabetes in a sex-specific manner44, suggesting leptin/leptin resistance as
another pathway that may explain our sex-specific findings.
Our sex-specific findings—overall and those related to a history of maternal diabetes—may also be due to sex differences in epigenetic programming caused by intrauterine environmental insults. Sex-specific DNA methyl-ation patterns have been observed in the cord blood of neonates following intrauterine growth restriction45, and
in middle-aged adults following prenatal exposure to the Dutch Famine of 1944–194546. Additionally, several
studies have demonstrated alteration of DNA methylation patterns in offspring of diabetic mothers15,20, but to the
best of our knowledge, we are the first to show that maternal diabetes may modify the association between intra-uterine growth restriction and adult-onset diabetes in a sex-specific manner. DNA methylation of loci associated with insulin resistance and type 2 diabetes in infants born to mothers with gestational diabetes and in infants born with growth restriction demonstrates large changes in methylation but surprisingly little overlap in specific methylated loci by sex47. The fact that we only found that low birth weight men with maternal history of diabetes
have increased risk of diabetes suggest factors leading to low birth weight in men other than maternal diabetes are not sufficient to confer diabetes risk. Future investigation is needed to determine if this sex-specific interaction of maternal diabetes and birth weight on adult-onset of diabetes is reproducible.
Birth weight categories
<2.5 kg ≥2.5, ≤4 kg >4 kg P-value Men whose mothers had history of diabetes
n 91 887 130
Cases 43 265 34
Model 1 1.53 (1.21–1.92) 1 (reference) 0.85 (0.63–1.15) 0.004 Model 2 1.45 (1.15–1.83) 1 (reference) 0.86 (0.64–1.15) 0.01 Model 3 1.54 (1.23–1.93) 1 (reference) 0.81 (0.60–1.10) 0.002 Men whose mothers did not have history of diabetes
n 354 3765 410
Cases 73 763 70
Model 1 0.98 (0.80–1.21) 1 (reference) 0.91 (0.73–1.12) 0.64 Model 2 0.92 (0.74–1.14) 1 (reference) 0.91 (0.74–1.13) 0.53 Model 3 0.94 (0.75–1.17) 1 (reference) 0.80 (0.64–1.00) 0.09 Women whose mothers had history of diabetes
n 126 1146 122
Cases 48 239 23
Model 1 1.78 (1.39–2.29) 1 (reference) 0.94 (0.65–1.37) 0.001 Model 2 1.77 (1.37–2.29) 1 (reference) 0.98 (0.68–1.41) 0.002 Model 3 1.66 (1.28–2.17) 1 (reference) 0.82 (0.57–1.17) 0.002 Women whose mothers did not have history of maternal diabetes
n 472 4744 278
Cases 91 627 34
Model 1 1.55 (1.28–1.87) 1 (reference) 0.93 (0.68–1.28) 0.0008 Model 2 1.45 (1.20–1.75) 1 (reference) 0.93 (0.68–1.26) 0.003 Model 3 1.50 (1.26–1.79) 1 (reference) 0.80 (0.60–1.08) 0.0002
Lastly, consistent with some48, but not all49, previous studies we found that high birth weight was associated
with a reduced adjusted prevalence of adult-onset diabetes. The strength of this association did not differ across analyses stratified by sex and maternal diabetes status.
Our study has several strengths. First, it is the largest investigation of birth weight in relation to adult-onset diabetes risk in a LMIC context to date. The relatively large size of our cohort has afforded the ability to explore sex-specific interactions that previous studies from LMICs have not had the power to examine. Second, the rela-tively advanced age of the ELSA-Brasil sample has allowed us to extend the previous studies from LMICs – mainly birth cohorts – that typically examined health outcomes among young adults. Third, we believe our results have wide generalizability. The majority of the world´s population is currently undergoing a rapid nutritional transi-tion. ELSA participants, different from those in high-income countries, underwent this rapid transitransi-tion. They were born between 1930 and 1970, and thus lived through the mid-1900s during which food insecurity was common, as well as through the more recent period in which diabetes has been highly prevalent. Finally, the use of a standard 75 g oral glucose tolerance test for those without previously diagnosed diabetes and measurements of glycated hemoglobin for all participants allowed us to provide a broader and more sensitive assessment of dia-betes than all previous studies from LMICs on this topic.
Some limitations of our study deserve mention. First, birth weight data were based on self-report. Previous studies have shown moderate correlations between estimated and recorded birth weight (r = 0.64–0.83)50–52. We
expect but cannot confirm that misclassification of birth weight in our study of older adults, if present, would be non-differential with respect to diabetes, and therefore likely underestimate the strength of association reported. Second, it is important to note that a maternal history of diabetes implies a diagnosis made at any time in the
<2.5 kg ≥2.5, ≤4 kg >4 kg P-value Women whose mothers had history of diabetes1
Fasting glucose (mmol/l)
Model 1 5.97 (0.08) 5.82 (0.04) 5.75 (0.08) 0.08 Model 2 5.97 (0.08) 5.85 (0.04) 5.71 (0.08) 0.03 2 h postload glucose (mmol/l)
Model 1 7.73 (0.25) 7.20 (0.12) 6.96 (0.21) 0.02 Model 2 7.72 (0.24) 7.30 (0.12) 6.82 (0.20) 0.004 HOMA-IR
Model 1 1.43 (0.15) 1.21 (0.07) 1.45 (0.14) 0.03 Model 2 1.42 (0.13) 1.29 (0.06) 1.31 (0.11) 0.56 HOMA-β†
Model 1 45.63 (1.94) 48.85 (1.12) 52.14 (2.10) 0.04 Model 2 45.69 (1.93) 48.70 (1.11) 52.71 (12.12) 0.02 ISI-composite
Model 1 4.87 (0.45) 5.85 (0.29) 5.40 (0.47) 0.08 Model 2 4.90 (0.40) 5.50 (0.24) 5.91 (0.46) 0.17 Women whose mothers did not have history of diabetes2
Fasting glucose (mmol/l)
Model 1 5.86 (0.03) 5.77 (0.02) 5.77 (0.04) 0.01 Model 2 5.87 (0.03) 5.76 (0.02) 5.73 (0.04) 0.0004 2 h postload glucose (mmol/l)
Model 1 7.13 (0.10) 6.92 (0.05) 6.79 (0.12) 0.03 Model 2 7.17 (0.10) 6.90 (0.05) 6.67 (0.11) 0.0007 HOMA-IR
Model 1 1.47 (0.07) 1.35 (0.03) 1.38 (0.08) 0.16 Model 2 1.52 (0.07) 1.34 (0.03) 1.23 (0.07) 0.001 HOMA-β†
Model 1 44.76 (0.80) 46.67 (0.44) 46.95 (1.04) 0.04 Model 2 44.44 (0.79) 46.70 (0.44) 47.53 (1.04) 0.007 ISI-composite
Model 1 5.06 (0.22) 5.49 (0.13) 5.79 (0.31) 0.07 Model 2 4.92 (0.19) 5.55 (0.11) 6.35 (0.30) < 0001
Table 4. Multivariable adjusted mean (SE) of measures of glucose homeostasis and insulin resistance and secretion in women across categories of birth weight, stratified by maternal diabetes status: ELSA-Brasil (2008–2010). Model 1: adjusted for age, study center, maternal education, father diagnosed with diabetes; Model 2: + BMI at baseline. †Further adjusted for HOMA-IR. P-value represents the test for an overall
maternal life course. Nevertheless, given the natural history of T2D, it is likely that at the time of pregnancy some degree of glucose dysregulation would have been present, and a considerable proportion of these women may have reached a degree of hyperglycemia compatible with gestational diabetes. Third, we did not have information to characterize the causes of low birth weight in our participants, and thus we cannot infer what causes of low birth weight are driving the birth weight-T2D association. Finally, although we had a priori hypotheses about sex-specific associations, we cannot rule out that one or more of our findings were due to chance, as many statis-tical tests were performed.
In sum, we observed a sex-specific association between low birth weight and adult-onset diabetes in a contem-porary cohort of Brazilian adults. These findings, consistent with those from epidemiological studies and exper-imental animal studies, suggest the fetal origins of diabetes hypothesis could be extended to include sex-specific environmental causes. The relevance and complexity of these sex differences in today´s environment is an exciting area for future epidemiological and basic science research.
References
1. Zimmermann, E., Gamborg, M., Sorensen, T. I. & Baker, J. L. Sex Differences in the Association Between Birth Weight and Adult Type 2 Diabetes. Diabetes. 64, 4220–4225 (2015).
2. Ravelli, A. C., van Der Meulen, J. H., Osmond, C., Barker, D. J. & Bleker, O. P. Obesity at the age of 50 y in men and women exposed to famine prenatally. Am J Clin Nutr. 70, 811–816 (1999).
3. Hult, M. et al. Hypertension, diabetes and overweight: looming legacies of the Biafran famine. PLoS One. 5, e13582 (2010). 4. Imai, C. M. et al. Effect of birth year on birth weight and obesity in adulthood: comparison between subjects born prior to and
during the great depression in Iceland. PLoS One. 7, e44551 (2012).
Birth weight categories
<2.5 kg Mean (SE) ≥2.5, ≤4 kg Mean (SE) >4 kg Mean (SE) P-value Men whose mothers had history of diabetes1
Fasting glucose (mmol/l)
Model 1 6.16 (0.13) 6.10 (0.07) 6.16 (0.10) 0.78 Model 2 6.19 (0.13) 6.10 (0.07) 6.11 (0.10) 0.75 2 h postload glucose (mmol/l)
Model 1 7.41 (0.32) 7.60 (0.18) 7.50 (0.25) 0.77 Model 2 7.54 (0.31) 7.59 (0.17) 7.30 (0.24) 0.42 HOMA-IR
Model 1 1.79 (0.23) 1.79 (0.12) 1.98 (0.20) 0.55 Model 2 1.98 (0.21) 1.78 (0.10) 1.69 (0.14) 0.41 HOMA-β†
Model 1 51.18 (3.04) 53.04 (1.70) 52.24 (2.44) 0.78 Model 2 51.27 (3.05) 53.03 (1.70) 52.12 (2.45) 0.78 ISI-composite
Model 1 4.34 (0.53) 4.43 (0.29) 4.26 (0.41) 0.90 Model 2 3.95 (0.40) 4.45 (0.25) 4.95 (0.40) 0.13 Men whose mothers did not have history of diabetes2
Fasting glucose (mmol/l)
Model 1 6.10 (0.05) 6.11 (0.03) 6.08 (0.05) 0.82 Model 2 6.11 (0.05) 6.10 (0.03) 6.02 (0.05) 0.17 2 h postload glucose (mmol/l)
Model 1 7.26 (0.14) 7.32 (0.08) 7.13 (0.13) 0.30 Model 2 7.29 (0.13) 7.29 (0.08) 6.92 (0.12) 0.005 HOMA-IR
Model 1 1.48 (0.09) 1.68 (0.06) 1.84 (0.10) 0.008 Model 2 1.52 (0.08) 1.65 (0.05) 1.58 (0.07) 0.13 HOMA-β†
Model 1 46.02 (1.11) 46.80 (0.64) 47.94 (1.09) 0.34 Model 2 46.02 (1.11) 46.83 (0.63) 48.38 (1.10) 0.18 ISI-composite
Model 1 5.28 (0.29) 4.90 (0.15) 4.82 (0.25) 0.29 Model 2 5.18 (0.25) 5.00 (0.13) 5.57 (0.25) 0.02
Table 5. Multivariable adjusted mean (SE) of measures of glucose homeostasis and insulin resistance and secretion in men across categories of birth weight, stratified by maternal diabetes status: ELSA-Brasil (2008–2010). Model 1: adjusted for age, study center, race/color, maternal education, father diagnosed with diabetes; Model 2: + BMI at baseline. †Further adjusted for HOMA-IR. P-value represents the test for an
gestation: the Dutch Hunger Winter Families Study. Am J Clin Nutr. 89, 1737–1743 (2009).
6. Chen, H., Nembhard, W. N. & Stockwell, H. G. Sex-specific effects of fetal exposure to the 1959–1961 Chinese famine on risk of adult hypertension. Matern Child Health J. 18, 527–533 (2014).
7. Zheng, X. et al. Risk of metabolic syndrome in adults exposed to the great Chinese famine during the fetal life and early childhood.
Eur J Clin Nutr. 66, 231–236 (2012).
8. Zambrano, E. et al. A low maternal protein diet during pregnancy and lactation has sex- and window of exposure-specific effects on offspring growth and food intake, glucose metabolism and serum leptin in the rat. The Journal of physiology. 571(Pt1), 221–230 (2006).
9. Jansson, T. & Lambert, G. W. Effect of intrauterine growth restriction on blood pressure, glucose tolerance and sympathetic nervous system activity in the rat at 3–4 months of age. J Hypertens. 17, 1239–1248 (1999).
10. Styrud, J., Eriksson, U. J., Grill, V. & Swenne, I. Experimental intrauterine growth retardation in the rat causes a reduction of pancreatic B-cell mass, which persists into adulthood. Biology of the neonate. 88, 122–128 (2005).
11. Sardinha, F. L. et al. Gender difference in the effect of intrauterine malnutrition on the central anorexigenic action of insulin in adult rats. Nutrition. 22, 1152–1161 (2006).
12. Hill, A. B. The Environment and Disease: Association or Causation? Proceedings of the Royal Society of Medicine. 58, 295–300 (1965). 13. Bardenheier, B. H. et al. Trends in Gestational Diabetes Among Hospital Deliveries in 19 US. States, 2000–2010. Am J Prev Med. 49,
12–19 (2015).
14. Zhang F. et al. Increasing prevalence of gestational diabetes mellitus in Chinese women from 1999 to 2008. Diabet Med. 28, 652–657 (2011).
15. Ge, Z. J., Zhang, C. L., Schatten, H. & Sun, Q. Y. Maternal diabetes mellitus and the origin of non-communicable diseases in offspring: the role of epigenetics. Biol Reprod. 90, 139 (2014).
16. Fraser, A. & Lawlor, D. A. Long-term health outcomes in offspring born to women with diabetes in pregnancy. Curr Diab Rep. 14,
489 (2014).
17. Chavey, A., Ah Kioon, M. D., Bailbe, D., Movassat, J. & Portha, B. Maternal diabetes, programming of beta-cell disorders and intergenerational risk of type 2 diabetes. Diabetes Metab. 40, 323–330 (2014).
18. Clausen, T. D. et al. High prevalence of type 2 diabetes and pre-diabetes in adult offspring of women with gestational diabetes mellitus or type 1 diabetes: the role of intrauterine hyperglycemia. Diabetes Care. 31, 340–346 (2008).
19. Dabelea, D. et al. Intrauterine exposure to diabetes conveys risks for type 2 diabetes and obesity: a study of discordant sibships.
Diabetes. 49, 2208–2211 (2000).
20. Ma, R. C., Tutino, G. E., Lillycrop, K. A., Hanson, M. A. & Tam, W. H. Maternal diabetes, gestational diabetes and the role of epigenetics in their long term effects on offspring. Prog Biophys Mol Biol. 118, 55–68 (2015).
21. Aquino, E. M. et al. Brazilian Longitudinal Study of Adult Health (ELSA-Brasil): objectives and design. Am J Epidemiol. 175,
315–324 (2012).
22. Schmidt, M. I. et al. Cohort Profile: Longitudinal Study of Adult Health (ELSA-Brasil). Int J Epidemiol. 44, 68–75 (2015). 23. World Health Organization, Definition and diagnosis of diabetes mellitus and intermediate hyperglycaemia: Report of a WHO/IDF
Consultation (2006)(Date of access: 18/04/2015). Available from: http://www.who.int/diabetes/publications/Definition%20and%20 diagnosis%20of%20diabetes_new.pdf.
24. World Health Organization, Use of Glycated Haemoglobin (HbA1c) in the Diagnosis of Diabetes Mellitus (2011)(Date of access: 18/04/2015). Available from: http://www.who.int/diabetes/publications/report-hba1c_2011.pdf.
25. Matthews, D. R. et al. Homeostasis model assessment: insulin resistance and beta-cell function from fasting plasma glucose and insulin concentrations in man. Diabetologia. 28, 412–419 (1985).
26. DeFronzo, R. A. & Matsuda, M. Reduced time points to calculate the composite index. Diabetes Care. 33, e93 (2010). 27. Fall, C. H. et al. Size at birth, maternal weight, and type 2 diabetes in South India. Diabet Med. 15, 220–227 (1998).
28. Bhargava, S. K. et al. Relation of serial changes in childhood body-mass index to impaired glucose tolerance in young adulthood. N Engl J Med. 350, 865–875 (2004).
29. Norris, S. A. et al. Size at birth, weight gain in infancy and childhood, and adult diabetes risk in five low- or middle-income country birth cohorts. Diabetes Care. 35, 72–79 (2012).
30. Xiao, X. et al. Evidence of a relationship between infant birth weight and later diabetes and impaired glucose regulation in a Chinese population. Diabetes Care. 31, 483–487 (2008).
31. Raghupathy, P. et al. Glucose tolerance, insulin resistance and insulin secretion in young south Indian adults: Relationships to parental size, neonatal size and childhood body mass index. Diabetes Res Clin Pract. 87, 283–292 (2010).
32. Guo, J., Bhattacharya, J. & Eggleston, K. Barker’s Hypothesis and the Selection Effect: The Repercussions of Fetal Malnutrition in the Context of the Great Chinese Famine in 1959–1961. A.B. [dissertation]. Stanford (CA): Stanford University (2013).
33. Mu, R. & Zhang, X. Gender difference in the long-term impact of famine. International Food Policy Research Institute (2008) (Date of access: 12/04/2015). Available from: www.ifpri.org/sites/default/files/publications/ifpridp00760.pdf.
34. Lindeboom, M., Portrait, F. & van den Berg, G. J. Long-run effects on longevity of a nutritional shock early in life: the Dutch Potato famine of 1846–1847. J Health Econ. 29, 617–629 (2010).
35. Lee, C. In utero exposure to the Korean War and its long-term effects on socioeconomic and health outcomes. J Health Econ. 33,
76–93 (2014).
36. Ribeiro, A. M., Guimaraes, M. J., Lima, Mde C., Sarinho, S. W. & Coutinho, S. B. [Risk factors for neonatal mortality among children with low birth weight]. Revista de saude publica. 43, 246–255 (2009).
37. Gaiva, M. A., Fujimori, E. & Sato, A. P. [Neonatal mortality in infants with low birth weight]. Revista da Escola de Enfermagem da USP. 48, 778–786 (2014).
38. Buchner, D. A. et al. Increased mitochondrial oxidative phosphorylation in the liver is associated with obesity and insulin resistance.
Obesity (Silver Spring). 19, 917–924 (2011).
39. Pospisilik, J. A. et al. Targeted deletion of AIF decreases mitochondrial oxidative phosphorylation and protects from obesity and diabetes. Cell. 131, 476–491 (2007).
40. Carlsen, S. M., Jacobsen, G. & Romundstad, P. Maternal testosterone levels during pregnancy are associated with offspring size at birth. Eur J Endocrinol. 155, 365–370 (2006).
41. Gitau, R., Adams, D., Fisk, N. M. & Glover, V. Fetal plasma testosterone correlates positively with cortisol. Archives of disease in childhood Fetal and neonatal edition. 90, F166–F169 (2005).
42. Ding, E. L., Song, Y., Malik, V. S. & Liu, S. Sex differences of endogenous sex hormones and risk of type 2 diabetes: a systematic review and meta-analysis. JAMA. 295, 1288–1299 (2006).
43. Jaquet, D., Leger, J., Levy-Marchal, C., Oury, J. F. & Czernichow, P. Ontogeny of leptin in human fetuses and newborns: effect of intrauterine growth retardation on serum leptin concentrations. J Clin Endocrinol Metab. 83, 1243–1246 (1998).
44. Chen, G. C., Qin, L. Q. & Ye, J. K. Leptin levels and risk of type 2 diabetes: gender-specific meta-analysis. Obes Rev. 15, 134–142 (2014).
45. Delahaye, F. et al. Sexual dimorphism in epigenomic responses of stem cells to extreme fetal growth. Nat Commun. 5, 5187 (2014). 46. Tobi, E. W. et al. DNA methylation differences after exposure to prenatal famine are common and timing- and sex-specific. Hum Mol
47. Quilter, C. R. et al. Impact on offspring methylation patterns of maternal gestational diabetes mellitus and intrauterine growth restraint suggest common genes and pathways linked to subsequent type 2 diabetes risk. FASEB J. 28, 4868–4879 (2014). 48. Whincup, P. H. et al. Birth weight and risk of type 2 diabetes: a systematic review. JAMA. 300, 2886–2897 (2008).
49. Harder, T., Rodekamp, E., Schellong, K., Dudenhausen, J. W. & Plagemann, A. Birth weight and subsequent risk of type 2 diabetes: a meta-analysis. Am J Epidemiol. 165, 849–857 (2007).
50. Sanderson, M. et al. Validity and reliability of subject and mother reporting of perinatal factors. Am J Epidemiol. 147, 136–140 (1998).
51. Troy, L. M. et al. Self-reported birthweight and history of having been breastfed among younger women: an assessment of validity.
Int J Epidemiol. 25, 122–127 (1996).
52. Kemp, M., Gunnell, D., Maynard, M., Smith, G. D. & Frankel, S. How accurate is self reported birth weight among the elderly? J Epidemiol Community Health. 54, 639 (2000).
Acknowledgements
The authors would like to thank all ELSA-Brasil participants for their valuable contribution to this study. The authors would also like to thank Laurence Howe for his editorial assistance on this manuscript. This work was supported by the Brazilian Ministry of Health (Science and Technology Department) and the Brazilian Ministry of Science and Technology (Financiadora de Estudos e Projetos and the National Council for Scientific and Technological Development - CNPq) [grant numbers 01 06 0010.00 RS, 01 06 0212.00 BA, 01 06 0300.00 ES, 01 06 0278.00 MG, 01 06 0115.00 SP, 01 06 0071.00 RJ]. The funders had no role in design, collection, analysis, or interpretation of data, the writing of the manuscript or in the decision to submit the manuscript for publication.
Author Contributions
J.Y. analyzed and interpreted the data and prepared the final manuscript. N.T.M., M.I.S. and B.B.D. conceived the study, interpreted the data, and prepared the final manuscript. D.C., I.M.B., R.H.G., S.M.B. and L.J.A. assisted in drafting the manuscript. All authors approved the final manuscript.
Additional Information
Supplementary information accompanies this paper at http://www.nature.com/srep
Competing financial interests: The authors declare no competing financial interests.
How to cite this article: Yarmolinsky, J. et al. Sex-specific associations of low birth weight with adult-onset diabetes and measures of glucose homeostasis: Brazilian Longitudinal Study of Adult Health. Sci. Rep.6, 37032; doi: 10.1038/srep37032 (2016).
Publisher's note: Springer Nature remains neutral with regard to jurisdictional claims in published maps and institutional affiliations.
This work is licensed under a Creative Commons Attribution 4.0 International License. The images or other third party material in this article are included in the article’s Creative Commons license, unless indicated otherwise in the credit line; if the material is not included under the Creative Commons license, users will need to obtain permission from the license holder to reproduce the material. To view a copy of this license, visit http://creativecommons.org/licenses/by/4.0/