Detection of Human Immunodeficiency Virus RNAs in living cells
using Spinach RNA aptamers
Brandon D. Burch2, Carolina Garrido1,2, and David M. Margolis1,2,3,4,*
1UNC HIV Cure Center, University of North Carolina at Chapel Hill, Chapel Hill, North Carolina
27599, USA
2Department of Medicine, University of North Carolina at Chapel Hill, Chapel Hill, North Carolina
27599, USA
3Department of Microbiology and Immunology, University of North Carolina at Chapel Hill, Chapel
Hill, North Carolina 27599, USA
4Department of Epidemiology, University of North Carolina at Chapel Hill, Chapel Hill, North
Carolina 27599, USA
Abstract
Many techniques currently used to measure HIV RNA production in cells suffer from limitations that include high background signal or the potential to destroy cellular context. Fluorophore-binding RNA aptamers offer the potential for visualizing RNAs directly in living cells with minimal cellular perturbation. We inserted a sequence encoding a fluorophore-binding RNA aptamer, known as Spinach, into the HIV genome such that predicted RNA secondary structures in both Spinach and HIV were preserved. Chimeric HIV-Spinach RNAs were functionally validated in vitro by testing their ability to enhance the fluorescence of a conditional fluorophore (DFHBI), which specifically binds Spinach. Fluorescence microscopy and PCR were used to verify expression of HIV-Spinach RNAs in human cells. HIV-1 gag RNA production and fluorescence were measured by qPCR and fluorometry, respectively. HIV-Spinach RNAs were fluorometrically detectable in vitro and were transcribed in human cell lines and primary cells, with both spliced and unspliced species detected by PCR. HIV-Spinach RNAs were visible by fluorescence microscopy in living cells, although signal was reproducibly weak. Cells expressing HIV-Spinach RNAs were capable of producing fluorometrically detectable virions, although detection of single viral particles was not possible. In summary, we have investigated a novel method for detecting HIV RNAs in living cells using the Spinach RNA aptamer. Despite the limitations of the present aptamer/fluorophore combination, this is the first application of this technology to an infectious disease and provides a foundation for future research into improved methods for studying HIV expression.
*Address correspondence and reprint requests to David Margolis, [email protected], University of North Carolina at Chapel Hill,
2060 Genetic Medicine Building, CB#7042, 120 Mason Farm Road, Chapel Hill, NC 27599-7435, Phone: (919) 966-6388.
Publisher's Disclaimer: This is a PDF file of an unedited manuscript that has been accepted for publication. As a service to our
customers we are providing this early version of the manuscript. The manuscript will undergo copyediting, typesetting, and review of
HHS Public Access
Author manuscript
Virus Res
. Author manuscript; available in PMC 2018 January 15.Published in final edited form as:
Virus Res. 2017 January 15; 228: 141–146. doi:10.1016/j.virusres.2016.11.031.
A
uthor Man
uscr
ipt
A
uthor Man
uscr
ipt
A
uthor Man
uscr
ipt
A
uthor Man
uscr
Keywords
HIV-RNA; aptamers; Spinach
1. INTRODUCTION
Many techniques currently used to measure HIV RNA production in cells suffer from limitations that include high background signal or the potential to destroy cellular context. Available options include fluorescent reporter-based cellular models, fluorescent protein-fused RNA binding proteins, in situ hybridization, and PCR-based methods, but while these have contributed to our understanding of HIV RNA expression, each has weaknesses that make it suboptimal for live-cell RNA analysis. Reporter-based cellular HIV models, such as those utilizing green fluorescent protein (GFP) (Gervaix et al., 1997), allow for a convenient fluorescence readout in living cells, but are an indirect measurement of HIV RNA
expression that requires translation of reporter proteins and thus prevents resolution of upstream inhibitory processes, including RNA splicing defects (Pace et al., 2012), nuclear export defects (Lassen et al., 2006), and miRNA activity (Chable-Bessia et al., 2009; Huang et al., 2007). A more direct way to visualize RNA in living cells includes the use of a fluorescent protein fused to an RNA-binding protein that recognizes specific binding sites engineered into the RNA of interest, such as GFP-MS2 (Bertrand et al., 1998). While this method has been used previously to study HIV transcription (Maiuri et al., 2011a; Maiuri et al., 2011b), background fluorescence can be high, especially in the nucleus, and there is a risk that the binding of reporter proteins to RNA may affect downstream processes, such as RNA trafficking. In situ hybridization, while sensitive enough to detect small numbers of HIV nucleic acid molecules with low background in individual cells (Lawrence et al., 1990), requires fixation of cells, preventing longitudinal analysis in individual cells. Finally, PCR-based methods are among the most sensitive currently available and are highly quantitative (Kiselinova et al., 2014), but require destruction of the cell and are thus not conducive for live cell analysis.
Despite the existence of a number of methods for measuring RNA expression, the
development of a molecular tool for visualizing RNA within a living cell, while preserving cellular integrity, reducing background, and not requiring translation would be a clear asset to the study of HIV expression. Recently, fluorophore binding RNA aptamers have gained attention for their potential to meet these challenges. One of these aptamers, known as Spinach (Paige et al., 2011) or in its more recently improved form, Spinach2 (Strack et al., 2013), has been used for a number of in vitro and synthetic biology applications (Chizzolini et al., 2014; Hofer et al., 2013; Nakayama et al., 2012; Pothoulakis et al., 2014; Shu et al., 2014; van Nies et al., 2013), as well as for detecting triplet repeat RNAs (Strack et al., 2013), protein expression (Song et al., 2013), and metabolites (Paige et al., 2012) in living cells. Both aptamers bind a conditional fluorophore known as DFHBI (3,5-difluoro-4-hydroxybenzylidene imidazolinone), which is reported to have limited fluorescence on its own, but fluoresces similarly to enhanced GFP (EGFP) when bound (Paige et al., 2011). For the present study, we adapted Spinach for detecting HIV RNAs in human cells and virions.
A
uthor Man
uscr
ipt
A
uthor Man
uscr
ipt
A
uthor Man
uscr
ipt
A
uthor Man
uscr
2. MATERIAL AND METHODS
2.1. RNA aptamer modification
The minimal Spinach1 (Paige et al., 2011) (Spinach1M; synthesized by Integrated DNA Technologies) and Spinach2 (Strack et al., 2013) (gift from S. Jaffrey) aptamers were mutated by PCR to replace ATG sequences with AAG to form Spinach1MATGmut and
Spinach2ATGmut, respectively. ATG sequences were changed to reduce the chance of the
ribosome beginning transcription from inappropriate sites and producing aberrant peptides or altering the expression of normal HIV proteins. For mutations in regions of predicted base pairing, compensatory mutations were made. Final aptamer sequences, with mutations underlined, were: Spinach1M 5’-
GACGCGACCGAAATGGTGAAGGACGGGTCCAGTGCTTCGGCACTGTTG AGTAGAGTGTGAGCTCCGTAACTGGTCGCGTC-3’, Spinach1MATGmut
5’-GACGCGACCGAAAAGGTGAAGGACGGGTCCAGTGCTTCGGCACTGTTG AGTAGAGTGTGAGCTCCGTAACTGGTCGCGTC-3’, Spinach2
5’-GATGTAACTGAATGAAATGGTGAAGGACGGGTCCAGTAGGCTGCTTCGG CAGCCTACTTGTTGAGTAGAGTGTGAGCTCCGTAACTAGTTACATC-3’, Spinach2ATGmut 5’-
GAAGTAACTGAAAGAAAAGGTGAAGGACGGGTCCAGTAGGCTGCTTCG GCAGCCTACTTGTTGAGTAGAGTGTGAGCTCCGTAACTAGTTACTTC-3’.
2.2. Insertion of the spinach RNA Aptamer into HIV
Potential insertion sites for Spinach1MATGmut or Spinach2ATGmut within the HIV genome
were assessed using the mfold web server RNA folding application (Zuker, 2003) (http:// mfold.rna.albany.edu/?=mfold/RNA-Folding-Form), which relies on a thermodynamics-based RNA structural prediction algorithm to determine the most stable RNA structures from a given input sequence. Aptamer sequence was inserted into either HIV TAR or nef within the DHIV3 construct, which contains a 580 nucleotide deletion in env (Bosque and Planelles, 2009). For insertion in TAR, single flanking adenine residues were included to facilitate proper folding. For nef-Spinach, Spinach was inserted between BlpI and XhoI sites.
2.3. In vitro RNA imaging and fluorometry
T7 promoter-driven Spinach and HIV-Spinach DNA templates were synthesized by PCR and transcribed using T7 RNA Polymerase Plus (Ambion) according to the manufacturer’s instructions. In vitro transcribed RNAs were purified by phenol/chloroform/isoamyl alcohol extraction, resuspended to 1 μM in selection buffer (Paige et al., 2011) (40 mM HEPES, pH 7.4, 125 mM KCl, 5 mM MgSO4, and 5% DMSO), and incubated with 10 μM DFHBI
(Lucerna) or DMSO for 30 minutes at room temperature, protected from light. Samples were exposed to 365 nm light and images were taken using a Nikon D80 camera equipped with a UV filter. Fluorometry was performed using a SpectraMax M3 plate reader (Molecular Devices) (excitation = 469 nm, emission = 501 nm, cutoff = 495 nm). Emission spectra were obtained by scanning from 465-550 nm using an excitation wavelength of 425 nm. In vitro folding assays were performed as previously reported (Strack et al., 2013) and folding was normalized to 5S-Spinach2.
A
uthor Man
uscr
ipt
A
uthor Man
uscr
ipt
A
uthor Man
uscr
ipt
A
uthor Man
uscr
2.4. Fluorescence microscopy
293T or HeLa cells were transfected with HIV- Spinach or control constructs using Lipofectamine 2000 Reagent (Life Technologies) according to the manufacturer’s instructions. After 24 hours, cells were seeded into a μ-Plate 96-well plate (Ibidi). At least 30 minutes before imaging, cells were washed with PBS, followed by the addition of Live Cell Imaging Solution (Molecular Probes) supplemented with 5 mM MgSO4 and 20 μM
DFHBI. Images were obtained using an ORCA RC camera (Hamamatsu) mounted on an IX81 inverted fluorescence microscope (Olympus) equipped with a 60X/1.42 oil DIC PlanApo objective and a FITC filter (exposure time = 1 second). Image analysis/editing was performed using ImageJ (Schneider et al., 2012) and Adobe Photoshop.
2.5. Nucleic acid isolation, cDNA synthesis, and PCR
Total RNA and genomic DNA were isolated from cells using Trizol reagent (Life
Technologies) according to the manufacturer’s instructions. cDNAs were synthesized from total RNA using SuperScript II reverse transcriptase (Life Technologies) according to the manufacturer’s instructions. PCR reactions were performed on 50 ng cDNA or 10 ng genomic DNA in a total volume of 25 μl using Taq DNA polymerase (New England Biolabs) and a Mastercycler Nexus Gradient thermal cycler (Eppendorf) using the following conditions: 95°C for 30 sec., 30-35 cycles of 95°C for 30 sec., 50°C for 30 sec., and 68°C for 30 sec., and 68°C for 5 min. PCR Primer sequences are detailed in Table S1. A schematic of amplicon locations within HIV for the detection of total, unspliced, and multiply spliced species are provided in Figure S2. For qPCR, RNA was isolated from cells using the RNAeasy Mini RNA Extraction Kit (Qiagen) per manufacturer’s instructions and treated with Turbo DNase (Thermo Fisher), also per the manufacturer’s instructions. cDNA was synthesized from 500 ng total RNA using the Superscript III First Strand cDNA Synthesis System (Thermo Fisher), per the manufacturer’s instructions. qPCR was performed using a Bio-Rad CFX 96 Real Time PCR System with Bio-Rad CFX data analysis software to determine copy number, with TATA-binding protein as a normalizer.
2.6. Virion production
293T cells were cotransfected with DHIV3 (Bosque and Planelles, 2009) constructs, with or without Spinach, and pLET-LAI (Langlade-Demoyen et al., 1988) using the Calcium Phosphate Transfection Kit (Invitrogen) according to the manufacturer’s instructions. A pNL4-3 construct was transfected as a control. After 24 hours, fresh complete Dulbecco’s Modified Eagle Medium (DMEM; Gibco) was added. Supernatants were harvested 48-72 hours later, filtered using a 0.45 μm syringe filter, and virion concentration quantified using the HIV-1 p24 Antigen Capture Assay (Advanced Bioscience Laboratories) according to the manufacturer’s instructions.
2.7. Virion fluorometry
Virions were precipitated from growth medium containing 200 ng p24gag by incubating overnight with 20% polyethylene glycol 8000 (Sigma), followed by centrifugation at 20,817xg for 20 min. at 4°C. Virions were resuspended in selection buffer and DFHBI (10 μM final) or DMSO was added. Samples were transferred to a 96-well clear bottom, black
A
uthor Man
uscr
ipt
A
uthor Man
uscr
ipt
A
uthor Man
uscr
ipt
A
uthor Man
uscr
assay plate (Corning), incubated 30 minutes at 37°C in the dark, and assayed using a SpectraMax M3 plate reader (Molecular Devices) (excitation = 469 nm, emission = 501 nm, cutoff = 495 nm).
3. RESULTS
3.1. HIV-Spinach RNAs enhance the fluorescence of DFHBI in vitro
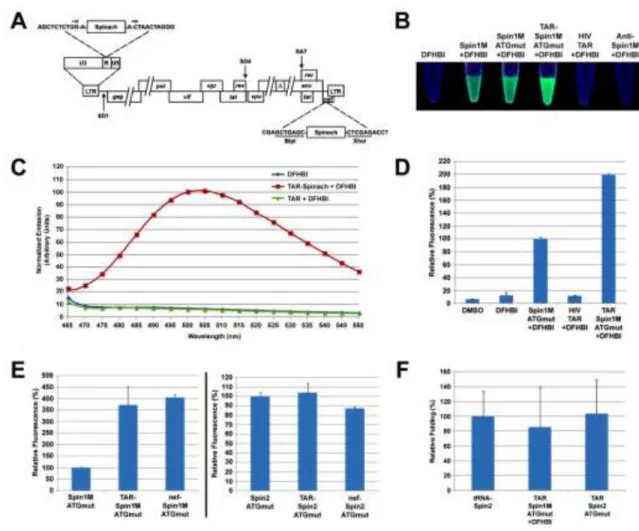
We tested the ability of Spinach RNAs, either alone or in the context of short (<100 nt) HIV sequences, to enhance DFHBI fluorescence in vitro. For HIV-Spinach RNAs, aptamer insertion sites (Fig. 1A) were selected based upon the predicted post-insertion thermodynamic stability of RNA secondary structures within Spinach and within the surrounding HIV sequence, in an effort maintain existing RNA structures in both (Fig. S1). Visual inspection of Spinach1M-containing and control RNAs following incubation with DFHBI and exposure to UV light (365 nm) revealed that only RNAs containing a proper Spinach aptamer promoted fluorescence and that neither mutation of ATG sequences within Spinach1M nor insertion of Spinach1MATGmut within HIV TAR precluded fluorescence
(Fig. 1B). Using fluorometry, we found that the TAR-Spinach1MATGmut/DFHBI emission
spectrum (Fig. 1C) was identical to that previously reported for Spinach1/DFHBI (Paige et al., 2011). Inclusion of flanking sequence improved the fluorescence of Spinach1MATGmut/
DFHBI (Fig. 1D), likely due to enhanced structural stability. We also tested Spinach in the context of longer, more complex HIV RNAs (600-1000 nt of HIV sequence) and found that for both Spinach1MATGmut and Spinach2ATGmut, additional RNA sequence had no negative
impact on fluorescence (Fig. 1E). Spinach1MATGmut/DFHBI fluorescence was improved by
additional flanking sequence compared to aptamer alone (Fig. 1E, left panel), while
Spinach2ATGmut/DFHBI fluorescence was unchanged (Fig. 1E, right panel), likely due to the
additional stability of Spinach2ATGmut versus Spinach1ATGmut. Finally, the ability of
HIV-Spinach RNAs to fold in vitro was similar to that of tRNA-HIV-Spinach2 RNA, which includes the core structure of the previously described 5S-Spinach2 RNA (Strack et al., 2013) (Fig. 1F).
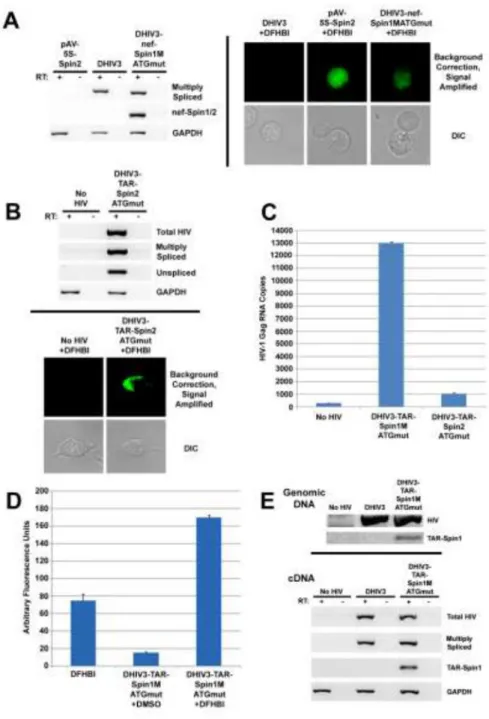
3.2. HIV-Spinach RNAs are detectable in cells and give rise to fluorometrically-detectable virions
Following transfection of HeLa and 293T cells with HIV-Spinach constructs or control plasmids, we found that both spliced and unspliced HIV-Spinach RNAs were expressed (Fig. 2A left panel and 2B, top panel) and that HIV-Spinach RNAs are detectable in cells in the presence of DFHBI by fluorescence microscopy (Fig. 2A right panel and 2B, bottom panel). Because all cells were treated with DFHBI and background signal was low, we conclude that detectable fluorescence was likely due to aptamer binding and not due to DFHBI
autofluorescence. Copies of gag RNA produced by 293T cells transfected with DHIV3 (contains a 580 nucleotide deletion in env), DHIV3-TAR-Spinach1MATGmut, or
DHIV3-TAR-Spinach2ATGmut were measured by quantitative PCR (qPCR). Amplifying from cDNA
synthesized from 500 ng of total RNA from these cells revealed that insertion of Spinach into TAR resulted in the production of nearly 2800 times fewer HIV RNA copies than observed for DHIV3 without the insertion, while inserting Spinach2ATGmut, which contains
additional sequence and predicted secondary structure, reduced the number of copies
A
uthor Man
uscr
ipt
A
uthor Man
uscr
ipt
A
uthor Man
uscr
ipt
A
uthor Man
uscr
approximately 13 times further (Fig. 2C and Table S2). This suggests the possibility that despite efforts to optimize RNA folding, some perturbation of normal transcriptional processes may still be occurring when Spinach is inserted into HIV TAR. Of note, cells expressing DHIV3 without an insertion produced nearly 100 times fewer HIV RNA copies than did cells transfected with a pNL4-3 construct (Fig. 2C and Table S2). This reduced expression may be due in part to some aspect of the DHIV3 construct itself or to a limited co-transfection efficiency of the DHIV3 or DHIV3-Spinach construct and the helper plasmid containing functional env.
Using p24gag ELISA, very low levels of virus (approximately 4 ng/mL) were detected in the growth medium from cells transfected with the DHIV3 construct, while virus produced by cells transfected with HIV-Spinach constructs was undetectable to the limit of detection of the assay (Table S2). As a control, a pNL4-3 construct was transfected and gave rise to nearly 600 ng/mL of virus (Table S2). These results agree with the qPCR findings discussed previously.
Despite low viral expression from cells transfected with DHIV3 constructs and especially those transfected with DHIV3-Spinach constructs, virion production was not eliminated altogether, as Spinach-containing virus could be precipitated from the growth medium. Using polyethylene glycol and cold centrifugation, virions produced by 293T cells transfected with DHIV3-TAR-Spinach1MATGmut were concentrated and subsequently
assayed in bulk by fluorometry. The fluorescence of bulk Spinach-containing virions in the presence of DFHBI was higher than that of the virions or DFHBI alone (Fig. 2D).
Infection of activated human primary CD4+ T cells with DHIV3 virions, with or without Spinach, resulted in the insertion of HIV sequence within the genomic DNA of these cells (Fig. 2E, top panel). In addition, Spinach sequence was detectable in the genomic DNA of DHIV3-TAR-Spinach1MATGmut-infected cells (Fig. 2E, top panel). Both spliced and
unspliced HIV RNAs were expressed in DHIV3 and DHIV3-TAR- Spinach1MATGmut
-infected cells and RNAs from DHIV3-TAR-SpinachMATGmut- infected cells retained
Spinach sequence (Fig. 2E, bottom panel).
Together, these results indicate that the DHIV3-TAR-Spinach1MATGmut construct is capable
of expressing HIV-Spinach RNAs in cultured cells, that these RNAs are capable of being spliced, and that these RNAs are detectable when viewed under a fluorescence microscope in the presence of DFHBI. Furthermore, by co-transfecting the
DHIV3-TAR-Spinach1MATGmut construct along with a plasmid containing env, the creation of
fluorescently detectable and infectious virions is possible. Finally, these virions are capable of infecting human primary CD4+ T cells, resulting in integration of HIV-Spinach sequence into the host genome and subsequent expression of HIV-Spinach RNAs.
4. DISCUSSION
We have adapted the Spinach aptamer for detection of HIV RNAs within living cells in a way that permits expression of HIV-Spinach RNAs and the production of fluorescently detectable progeny virions. The advantage of such a technique is that aptamer binding by a
A
uthor Man
uscr
ipt
A
uthor Man
uscr
ipt
A
uthor Man
uscr
ipt
A
uthor Man
uscr
fluorophore generally produces lower background fluorescence that other direct tagging methods and can be performed without the destruction of cellular context that can occur with fixation-based methods. However, it is important to note that this is a proof of concept study and improvements will certainly be required before this technology can be more broadly applicable. Since we initiated these studies, other investigators have reported improved fluorescent aptamer systems (Filonov and Jaffrey 2016). Our goal in presenting these results is to facilitate the development of this technology by sharing the progress we have made towards its implementation, and offer one possible application for which it may be useful.
To this end, and in order to provide the most accurate accounting of our work, we believe it is important to note one significant issue that we encountered during our study. We
repeatedly observed that Spinach-DFHBI fluorescence in cells was difficult to detect by microscopy, even for 5S-Spinach2, until non-specific background was eliminated and specific signal was enhanced digitally. This observation is not unique to our study and reasons for the low level fluorescence of Spinach-DFHBI in cells have been posited previously (Han et al., 2013; Song et al., 2014; Strack et al., 2013). Our results suggest that insufficient RNA production may be partly responsible for the low level fluorescence observed for HIV-Spinach RNAs in this study and insertion of Spinach into other locations within the HIV genome may allow increased HIV-Spinach RNA production. It is also possible that the aptamer folds inefficiently in cells in the context of additional HIV secondary structure. However, because of our difficulties observing fluorescence using even the original 5S-Spinach2 construct, insufficient RNA copies and misfolding may not be the only causes of the low observed fluorescence.
It has been documented previously that Spinach-DFHBI undergoes rapid light-induced fluorescence decay, which significantly reduces fluorescence intensity (Han et al., 2013). Further, it has been reported that the spectral properties of Spinach-DFHBI are suboptimal when used with many commonly employed fluorescence microscopy filters (Song et al., 2014). In light of the low level fluorescence that we observed in this study, these
observations will be important considerations as researchers strive to move this and related technologies forward.
In conclusion, we have provided evidence that fluorophore-binding RNA aptamers may be useful as a molecular tool for studying viral RNA production and in so doing, we have demonstrated the first application of this technology to HIV or any infectious disease. Despite some shortcomings of the technology, by introducing a way to detect viral RNA in cells and virions, we have laid the foundation for additional investigations into molecular tools that may prove useful for the study of transcriptional regulation and viral expression. With continued improvements to the aptamers, fluorophores, and imaging techniques, the future of HIV expression analysis appears bright indeed.
Supplementary Material
Refer to Web version on PubMed Central for supplementary material.
A
uthor Man
uscr
ipt
A
uthor Man
uscr
ipt
A
uthor Man
uscr
ipt
A
uthor Man
uscr
Acknowledgments
We thank Sammie Jaffrey, Rita Strack, and Siavash Karimzadegan at the Weill Cornell Medical College of Cornell University for providing the pAV-5S-Spinach2 construct and advice on its use, Vicente Planelles and Alberto Bosque at the University of Utah for providing the DHIV3 construct, members of the Margolis and Garcia labs at the University of North Carolina at Chapel Hill School of Medicine for their input on the project, and Natalia Soriano-Sarabia at the University of North Carolina at Chapel Hill School of Medicine for comments on the manuscript. This study was supported by the National Institutes of Health DA030156 to D.M.M
References
Bertrand E, Chartrand P, Schaefer M, Shenoy SM, Singer RH, Long RM. Localization of ASH1 mRNA particles in living yeast. Molecular cell. 1998; 2(4):437–445. [PubMed: 9809065]
Bosque A, Planelles V. Induction of HIV-1 latency and reactivation in primary memory CD4+ T cells. Blood. 2009; 113(1):58–65. [PubMed: 18849485]
Chable-Bessia C, Meziane O, Latreille D, Triboulet R, Zamborlini A, Wagschal A, Jacquet JM, Reynes J, Levy Y, Saib A, Bennasser Y, Benkirane M. Suppression of HIV-1 replication by microRNA effectors. Retrovirology. 2009; 6:26. [PubMed: 19272132]
Chizzolini F, Forlin M, Cecchi D, Mansy SS. Gene position more strongly influences cell-free protein expression from operons than T7 transcriptional promoter strength. ACS synthetic biology. 2014; 3(6):363–371. [PubMed: 24283192]
Filonov GS, Jaffrey SR. RNA Imaging with Dimeric Broccoli in Live Bacterial and Mammalian Cells. Curr Protoc Chem Biol. 2016; 8(1):1–28. [PubMed: 26995352]
Gervaix A, West D, Leoni LM, Richman DD, Wong-Staal F, Corbeil J. A new reporter cell line to monitor HIV infection and drug susceptibility in vitro. Proceedings of the National Academy of Sciences of the United States of America. 1997; 94(9):4653–4658. [PubMed: 9114046]
Han KY, Leslie BJ, Fei J, Zhang J, Ha T. Understanding the photophysics of the spinach-DFHBI RNA aptamer-fluorogen complex to improve live-cell RNA imaging. Journal of the American Chemical Society. 2013; 135(50):19033–19038. [PubMed: 24286188]
Hofer K, Langejurgen LV, Jaschke A. Universal aptamer-based real-time monitoring of enzymatic RNA synthesis. Journal of the American Chemical Society. 2013; 135(37):13692–13694. [PubMed: 23991672]
Huang J, Wang F, Argyris E, Chen K, Liang Z, Tian H, Huang W, Squires K, Verlinghieri G, Zhang H. Cellular microRNAs contribute to HIV-1 latency in resting primary CD4+ T lymphocytes. Nature medicine. 2007; 13(10):1241–1247.
Kiselinova M, Pasternak AO, De Spiegelaere W, Vogelaers D, Berkhout B, Vandekerckhove L. Comparison of droplet digital PCR and seminested real-time PCR for quantification of cell-associated HIV-1 RNA. PloS one. 2014; 9(1):e85999. [PubMed: 24465831]
Langlade-Demoyen P, Michel F, Hoffenbach A, Vilmer E, Dadaglio G, Garicia-Pons F, Mayaud C, Autran B, Wain-Hobson S, Plata F. Immune recognition of AIDS virus antigens by human and murine cytotoxic T lymphocytes. Journal of immunology (Baltimore, Md : 1950). 1988; 141(6): 1949–1957.
Lassen KG, Ramyar KX, Bailey JR, Zhou Y, Siliciano RF. Nuclear retention of multiply spliced HIV-1 RNA in resting CD4+ T cells. PLoS pathogens. 2006; 2(7):e68. [PubMed: 16839202]
Lawrence JB, Marselle LM, Byron KS, Johnson CV, Sullivan JL, Singer RH. Subcellular localization of low-abundance human immunodeficiency virus nucleic acid sequences visualized by
fluorescence in situ hybridization. Proceedings of the National Academy of Sciences of the United States of America. 1990; 87(14):5420–5424. [PubMed: 2371279]
Maiuri P, Knezevich A, Bertrand E, Marcello A. Real-time imaging of the HIV-1 transcription cycle in single living cells. Methods. 2011; 53(1):62–7. [PubMed: 20600934]
Maiuri P, Knezevich A, De Marco A, Mazza D, Kula A, McNally JG, Marcello A. Fast transcription rates of RNA polymerase II in human cells. EMBO Rep. 2011; 12(12):1280–5. [PubMed: 22015688]
A
uthor Man
uscr
ipt
A
uthor Man
uscr
ipt
A
uthor Man
uscr
ipt
A
uthor Man
uscr
Nakayama, S.; Luo, Y.; Zhou, J.; Dayie, TK.; Sintim, HO. Chemical communications. Vol. 48. Cambridge, England: 2012. Nanomolar fluorescent detection of c-di-GMP using a modular aptamer strategy; p. 9059-9061.
Pace MJ, Graf EH, Agosto LM, Mexas AM, Male F, Brady T, Bushman FD, O’Doherty U. Directly infected resting CD4+T cells can produce HIV Gag without spreading infection in a model of HIV latency. PLoS pathogens. 2012; 8(7):e1002818. [PubMed: 22911005]
Paige, JS.; Nguyen-Duc, T.; Song, W.; Jaffrey, SR. Science. Vol. 335. New York, N.Y: 2012. Fluorescence imaging of cellular metabolites with RNA; p. 1194
Paige, JS.; Wu, KY.; Jaffrey, SR. Science. Vol. 333. New York, N.Y: 2011. RNA mimics of green fluorescent protein; p. 642-646.
Pothoulakis G, Ceroni F, Reeve B, Ellis T. The spinach RNA aptamer as a characterization tool for synthetic biology. ACS synthetic biology. 2014; 3(3):182–187. [PubMed: 23991760]
Schneider CA, Rasband WS, Eliceiri KW. NIH Image to ImageJ: 25 years of image analysis. Nature methods. 2012; 9(7):671–675. [PubMed: 22930834]
Shu D, Khisamutdinov EF, Zhang L, Guo P. Programmable folding of fusion RNA in vivo and in vitro
driven by pRNA 3WJ motif of phi29 DNA packaging motor. Nucleic acids research. 2014; 42(2):e10. [PubMed: 24084081]
Song W, Strack RL, Jaffrey SR. Imaging bacterial protein expression using genetically encoded RNA sensors. Nature methods. 2013; 10(9):873–875. [PubMed: 23872791]
Song W, Strack RL, Svensen N, Jaffrey SR. Plug-and-play fluorophores extend the spectral properties of Spinach. Journal of the American Chemical Society. 2014; 136(4):1198–1201. [PubMed: 24393009]
Strack RL, Disney MD, Jaffrey SR. A superfolding Spinach2 reveals the dynamic nature of trinucleotide repeat-containing RNA. Nature methods. 2013; 10(12):1219–1224. [PubMed: 24162923]
van Nies P, Nourian Z, Kok M, van Wijk R, Moeskops J, Westerlaken I, Poolman JM, Eelkema R, van Esch JH, Kuruma Y, Ueda T, Danelon C. Unbiased tracking of the progression of mRNA and protein synthesis in bulk and in liposome-confined reactions. Chembiochem : a European journal of chemical biology. 2013; 14(15):1963–1966. [PubMed: 24027226]
Zuker M. Mfold web server for nucleic acid folding and hybridization prediction. Nucleic acids research. 2003; 31(13):3406–3415. [PubMed: 12824337]
A
uthor Man
uscr
ipt
A
uthor Man
uscr
ipt
A
uthor Man
uscr
ipt
A
uthor Man
uscr
Highlights
• Limited techniques allow in vivo RNA expression to be imaged in real time
• Better understanding the kinetics of transcriptional regulation and expression in vivo is an unmet need
• We present a novel technique that allows the real-time, single cell, visualization of HIV RNA expression in vivo in unmanipulated, living cells
A
uthor Man
uscr
ipt
A
uthor Man
uscr
ipt
A
uthor Man
uscr
ipt
A
uthor Man
uscr
Figure 1. HIV RNAs containing Spinach are detectable in vitro
(A) Insertion sites for Spinach1/2 within HIV. (B) Images of colorless microcentrifuge tubes containing selection buffer + DMSO/DFHBI +/- the indicated RNAs, exposed to 365 nm light. (C) Emission spectra generated by TAR-Spinach1MATGmut or TAR RNAs + DFHBI,
or DFHBI alone, upon exposure to 425 nm light. Emission is displayed in arbitrary units with peak emission of TAR-Spinach1MATGmut set to 100. (D) Fluorometry values,
normalized to Spinach1MATGmut, of the indicated RNAs + DFHBI, or DMSO/DFHBI alone.
(E) Fluorometry values, normalized to Spinach1MATGmut (left panel) or Spinach2ATGmut
(right panel) for the indicated RNAs + DFHBI. HIV-Spinach RNAs contain 600-1000 nucleotides of HIV sequence. (F) in vitro RNA folding (method of Strack et al., 2013), normalized to tRNA-Spinach2, for the indicated RNAs at 25°C.
A
uthor Man
uscr
ipt
A
uthor Man
uscr
ipt
A
uthor Man
uscr
ipt
A
uthor Man
uscr
Figure 2. HIV-Spinach RNAs are detectable in cells and give rise to fluorometrically-detectable virions
(A) Gel of PCR product amplified from cDNA synthesized from total RNA extracted 72 h post-transfection from HeLa cells expressing the indicated constructs (left) and fluorescence spectroscopy images of a subset of these cells (right). (B) Gel of PCR product amplified from cDNA synthesized from total RNA extracted 72 h post-transfection from 293T cells expressing the indicated constructs (top) and fluorescence spectroscopy images of a subset of these cells (bottom). (C) HIV-1 Gag RNA copy number was detected by quantitative PCR off of cDNA produced from 500 ng total RNA from untransfected 293T cells (no HIV) or
A
uthor Man
uscr
ipt
A
uthor Man
uscr
ipt
A
uthor Man
uscr
ipt
A
uthor Man
uscr
293T cells transfected with DHIV3-TAR-Spin1MATGmut or DHIV3-TAR-Spin2ATGmut
(from a different, but related experiment to the panels in (B)) (D) Fluorometry values, in arbitrary units, of HIV virions containing a Spinach1MATGmut aptamer within the 5’ TAR
region + DMSO/DFHBI. DFBHI alone acts as a negative control. (E) Gel of PCR product amplified from genomic DNA isolated from CD4+ T cells infected with DHIV3-TAR-Spinach1MATGmut virions (top) and gel of PCR product amplified from cDNA synthesized
from total RNA extracted from these cells (bottom). Note: PCR primer sequences are provided in Table S1. A schematic of the target locations for total, unspliced, and multiply spliced primer pairs is provided in Figure S2. A summary of mean qPCR and ELISA results for all tested constructs, including controls, is provided in Table S2.