Texture Features-Based Quantitative Analysis of
Mung-Beans Varieties Using Machine Vision Approach
Muhammad Shahid1, Mehwish Bari2*, Mutiullah31. Department of Physics, Government SE College, Bahawalpur, Pakistan
2. Department of Mathematics, National College of Business Administration and Economics, Sub-Campus Bahawalpur, Pakistan
3. Department of Computer Science, Khawaja Fareed University of Engineering and Technology, RYK, Pakistan
Corresponding Author: Email:[email protected]
Abstract
This study presents a robust and economically efficient method for the discrimination of four Mung-Beans varieties on the basis of quantitative parameters, which is otherwise a challenging task due to their similar physical and morphological features, such as color, shape and size etc. Digital images of the bulk samples, used as input data, are acquired by using a digital camera, in an absolute natural environment without any complex laboratory arrangement. A total number of 230 first-order and second-order, sometimes known as Gray Level Co-occurrence Matrix (GLCM) textural parameters are extracted from different sizes of Regions of Interest (ROIs), in all radial and axial directions up to 5 pixel distance by using Mazda software. The most relevant 10 features are selected by Fisher Co-efficient and classification/clustering capability of the selected features data is verified with the implementation of two multivariate approaches, Principal Component Analysis (PCA) and Linear Discriminant Analysis (LDA), whereas, a feed-forward Artificial Neural Network (ANN) classifier has been employed for training and testing purpose. The best results are achieved with an average accuracy of 98.17% and 94.35% during training and testing phase respectively, when the data of 10 selected features from ROI (64×64) is deployed to the classifier.
Key Words:
Mung-Beans, Textural Features, Fisher’s Co-efficient; Linear Discriminant, Artificial Neural Network1.
Introduction
Pulses are an essential part of a balanced diet, but Mung-Beans are more important due to their nutritional contents. Mung-Beans contain 4 percent fiber, Almost 20-24 percent protein, 59% carbohydrate and also good source of dietary and foliate fiber. They contain vitamin A, B, C and E. They also supply significant amount of calcium, iron, magnesium and potassium [1, 2]. From this it may be concluded that it is a good source of protein for the vegetarians.
Moreover, Mung-Beans have zero cholesterol and contain protease inhibitors which prevent cancer, similar to other beans. It is a friendly food for the diabetic persons because it has very low glucose. It has also the ability to fight cardiovascular disease risk factor and high blood pressure. It is a very good diet for the people who want to reduce their weight. It contains a range of phyto-nutrients which are considered antimicrobial and anti-inflammatory, helping them to enhance immunity and resist harmful bacteria, viruses, colds, rashes, irritations and many more [3]. It contains very few oligosaccharides which cause flatulence which makes it easily digestible, hence
it is a good diet for children and the patients with delicate digestive system [2].
Due to its short time of maturity (round about two months), Mung-Beans crop is being cultivated twice in a year; firstly during the month of February and secondly in June and July, in the subcontinent, which makes it economically valuable for the farmers. Maturity, upright versus prostrate growth habits, small versus large seed types and color of seed are important attributes to be considered when selecting a variety, usually larger seeds which have a glassy, green color are preferred [4]. Now the disease resistant, virus free and healthy seed, short duration, early developing and uniform in development are the reproducing destinations and such assortments are being created. In Pakistan early maturing cultivars, using germplasm, from national and international resources have been developed [1].
Table 1: Some Mung-Beans Varieties Developed in Pakistan
Variety Year of release Institution
NM-06 2006 NIAB
Azri-06 2006 AZRI,
NM-92 1993 NIAB
NM-13 2013 NIAB
BWP-16 2016 BWP
Chakwal-97 2000 BARI
NM-51 1991 NIAB
Chakwal-06 2006 BARI
Above discussed seed selection parameters in Table 1 are related to the post sowing process. Therefore, prior to the sowing, selection of proper seed variety is one of the basic requirements, to avoid the wastage of useful resources such as; field area, fertilizers, labor, time etc. Discrimination or identification is a trivial procedure for the selection of proper seed from the available varieties, but for this purpose up to now any simple scientific approach in not available.
Traditionally, varietal discrimination is done by skillful experts who differentiate the seeds on the basis of visual examination. An expert and skillful person checks the non-measureable parameters like color, shape, size and physical kernel texture to analyze it by his experience and tells the variety name, but it is highly subjective, tedious and inconsistent method [5], and is affected by individual’s experience [6]. According to Anami et al. Capabilities of the decision making in an expert can be seriously affected by his/her health condition [7] such as eyesight, fatigue, work pressure and work conditions. Moreover, an expert may not be familiar with all or newly launched varieties. So a system free from all these factors is required to be developed. To overcome all the said issues, four varieties of Mung-Beans have been differentiated on the basis of quantitative parameters rather than qualitative parameters.
In this paper, Section 2 presents a brief survey of literature regarding the discrimination of different types of seeds, Section 3 consist of data acquisition, pre-processing, extraction, selection and reduction of quantitative parameters used for kernel discrimination, Section 4 contains results and discussions of this developed system and Section 5 provide the conclusion.
2.
Literature survey
Use of information technology in the domain of artificial intelligence (free from all above mentioned human limitations) is an alternative tool for this purpose. During last few years a number of researches have been undertaken to use this approach for rapid and consistent classification/discrimination of seeds. Recently, Kurtulms et al. [8] have used color and
shape features for the classification of eight varieties of pepper seeds, with soft computing approach. By using ANN classifier they received an accuracy of 84.94% [9]. With the implementation of same features, Li et al. have classified four maize varieties with an accuracy of 94.5%. Similarly, using image processing techniques Sbanci et al. have characterized wheat grains, as bread and durum, on the basis of visual features. With the simplified ANN classifier, the best result is achieved with mean absolute error of 9.8*10-6 [10]. Zapotoczny also worked for the discrimination of wheat kernels by using similar features and achieved an accuracy of 98%-100% [11]. Huang et al. [12]and Zhang et al.[13], have employed hyper spectral images for the classification of maize varieties of different years. The images are in the spectral range of 380-1030 nm. The reported accuracy is 94.4% and 98.89% respectively. By using geometrical features Abdullah and Quteishat have differentiated wheat seeds with an accuracy of 95% with ANN classifier [14]. A mixture set of color, shape and texture features has been employed by Pandey et al. as input to ANN to classify wheat and gram seeds and received an average accuracy of 95% [15].
Neelam and Gupta classified four varieties of rice with the implementation of color and morphological parameters, where Mahalanobis is used as classifier [16]. Birla and Singh [17] worked for quality analysis of rice using morphological parameters by machine vision approach. Similar parameters (shape and color) have been employed by Chen et al. [18] for the discrimination of five corn varieties, Ghamari for the varietal discrimination of chickpea seeds [19] and Mebatsion et al. [20] used to classify five types of cereal grains barley, oat, rye, Canada Western Amber Durum wheat and Canada Western Red Spring wheat.
No doubt, all the studies cited above are fast, accurate and based on different image processing approaches, but mainly focus on the features, measured per kernel basis. Such experiments are only feasible to be performed in a controlled environment, but it would be difficult to employ for a common former, to whom it is generally concerned, because of complex setup requirements. Moreover, Visen et al. developed algorithms for the classification of grains on the basis of such images are more complex, due to a number of pre-processing steps, such as, segmentation, background removal and object extraction etc. [21] To avoid these complications and make the situation simpler some researchers used images of bulk samples.
Shahid et al. [22] investigated the potential of machine vision approach for the discrimination of five wheat varieties by using the images of bulk grain samples. For this purpose a set of 26 statistical texture features is deployed to ANN classifier and achieved an average accuracy of 97%. With an accuracy of 99.22% five varieties of barley are classified by Zapotoczny on the basis of bulk sample images [23]. By using similar images nine Iranian wheat varieties are distinguished by Pourreza et al. [24] with the help of different computer vision approaches and obtained an average accuracy of 98.15%. Brenda et al. [32] worked on Intra-regional classification of grape seeds produced in Mendoza province (Argentina) by multi elemental analysis and chemo metrics tools. Michael et al. [33] gave the classification of cowpea beans using multielemental fingerprinting combined with supervised learning.
Up to the best of our literature survey none of the researchers has worked for the differentiation of Mung-Beans varieties as in Table 1, which cannot be classified/ differentiated easily, even by an expert person due to similar geometrical and morphological properties of different varieties. The aim of this work is to develop an economically efficient system, free from all human limitations, to have consistent results, for the classification of Mung-Beans, more accurately in short time, without any complex laboratory arrangement, based on objective features (statistical texture features), rather than, subjective features (shape and color), which have been already employed by a number of researchers for the classification of other seeds.
3.
Materials and Methods
3.1 Image Acquisition
The experimental material of this research comprises of MungBeans of four varieties; NM -92, NM -13, BWP -16 and Azri-06. Sample images of each type is given in Fig. 1. It is necessary to take pure seeds without any outliers and mixture of any other varieties of seeds. are required, so, instead to take the sample of two kilogram seeds of each variety from open market we obtained from Agriculture Regional Research Centre, Bahawalpur Region, Bahawalpur, Punjab, Pakistan. In this study we have the intention to employ superficial information, retrieved from images of bulk samples, such as statistical textural parameters, These statistical texture features are used by number of researchers in various image classification application [25]. If the texture primitives are small in size and gray level difference among the adjacent primitives is large
such texture is known as fine texture. So, to meet the conditions of such a texture, image acquisition is conducted at the vertical height of 10 feet from the sample beans, by a digital camera (Nikon, model; COOLPICS) with Resolution property of camera approximately ten megapixels. To maintain the uniform light intensity and to have minimum inter kernel shadow effect; images are acquired at mid noon in a clear sunny day. Ten images of each variety are acquired, while reshuffling the sample after each image, to change the kernels (beans) randomness. Finally, a data set of 40 (10*4) colored images, having 2736*3648 dimensions and 24 bits depth in .JPG format is created.
Fig.1: (a)-(d) show sample images of Mung-Bean varieties BRM (303), BRM (307), BRM (311), Azri (06)
3.2 Pre-processing
In order to extract required meaningful statistical textural features from the acquired images of samples seeds, these images must undergo some given below pre-processing steps.
The area containing beans in each image is cropped by Microsoft Picture Manager, in this way, sample images of 300*400 pixels are obtained (cropped image of each variety is presented in Fig. 1). As the software MaZda [26] used for features extraction, only works for BMP format, therefore, we convert all acquired images into required format (8-bit images) by Photoshop-7, because we are interested to extract first-order and second-order statistical textural parameters from these images to have logical results.
To obtain the all possible superficial information in the form of statistical textural parameters, 12 non-overlapping sub-images or regions of interest (ROIs), with the pixel dimensions of 16×16, 32×32, and 64×64 are developed in each image.
3.3 Features Extraction
In this study, two types of textural measures; first order and second order parameters are extracted from each ROI under µ±3σ normalization condition (to minimize acquisition conditions and apparatus settings effects), where µ and σ are mean and standard deviation of pictorial data.
µ = 1
2
0
(
g)
( )
L
g
g
P g
(1)σ √∑ ( ̅)
( ) (2)
L is the number of gray level values (g) in Eq. (1) and (2). Also
( ) ( ) (3)
Is the probability of g, M is equal to the total number of pixels are found in the image, N(g) is the number of pixels having the gray value of g and ̅ ∑ ( )
is the average value of g.
First-order statistical texture parameters are computed from histogram of gray levels distribution with no considering spatial dependence. In this study the following 11 features are calculated by MaZda software; Mean, Variance, Standard Deviation, Skewness, Energy, Entropy and (1%, 10%, 50%, 90%, and 99%) percentile.
Second-order statistical textural features from the image data are extracted on the basis of Gray Level Co-occurrence Matrices (GLCM), probably; it is the most frequently cited method for texture analysis. A general procedure to extract these textural descriptors in the spatial domain was presented by Haralick et al.,[25]. A GLCM is a square matrix with elements corresponding to the relative frequency of occurrence of pairs with certain gray level pixels separated with a certain distance in a specific direction (0°, 45°, 90°, and 135°). The following 11 Haralick descriptors up to five pixels are calculated by using above mentioned MaZda software: Contrast, Angular Second Moment, Correlation, Sum of Squares, Sum Average, Sum Variance (SV), Entropy, Sum Entropy (SE), Difference Entropy (DE), Difference Variance (DV), and Inverse Difference Moment (IDM).
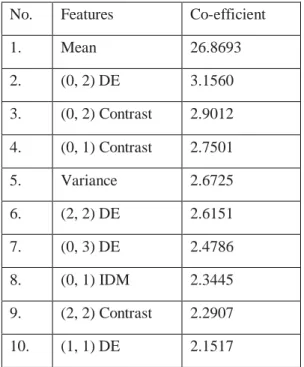
3.4 Feature Selection
We have to deploy all the information that exists in the calculated textural features to the system, so that, it can easily discriminate the varieties. However, the use of all heterogeneous information available in the form of calculated 230 features result to high-dimensioned feature space, degrade the discrimination accuracy of the system as well as increase the computational complexity. Therefore, a set of the most significant features is required to be selected which can be utilized by the system to classify the said kernels. For this purpose Fisher Discriminant Ratio approach, available in MaZda software, has been employed, which selects the 10 most significant features and presents in descending order shown in Table 2, according to their significance. This approach is based on the selection of features, having maximum inter-class variance and minimum intra-class variance; mathematically it is given by the following Eq.:
∑ ∑( )
(4)
In Eq. (4), D shows class variance and V is within class variance for a certain feature value, i and j represents the feature index.
Prior to further analysis the data of selected features is standardized, to reduce the effect of data errors due to some artifact or foreign element, by the ratio , where ‘ai’ is i-th feature.
For further reduction of data space dimensionality and to verify the data clustering capability of selected features the following two supervised multivariate approaches have been utilized.
(i)
Principal Component Analysis
(PCA)
It is a widely used statistical method by many researchers and developers to reduce the dimensionality of feature space without losing considerable amount of information. The advantage of PCA as an optimal linear transform is in the development of subspace which has the highest variance, so that it can compress data into a group of new orthogonal variables having lower dimensionality, through computing a linear projection of the data. In this way, the final selected features are used for classification as given in [27]. The transformation of PCA from X to Y is calculated as under the given equation is:
Y = Pt(X -µ) →Yi = ( ) (5) Where Y denote the matrix of principal components in Eq. (5), which is also called PCA discrimination scores, ‘ ’ is PCA transformation, is the i-th PCA of X feature. is i-th eigenvector, which is called as i-th vector of principal component loadings or discriminant co-efficient of PCA analysis.
(ii) Linear
Discriminant
Analysis
(LDA)
It is a technique that allows for discrimination of groups which have multivariate normal Gaussian distributions and same co-variance matrix [28, 29]. Duda et al. seeks the direction in which variability among the feature vectors of the same class is minimized and variability among the features of different classes is maximized [30]. Mathematically, within the same class features (c), scatter matrix is:
∑( )
( )) (6)
and features scatter matrix between different classes is defined as:
∑ ( ̅)( ̅) , (7)
∑ and ̅ ∑
In Eq. (7) N is total number of classes ‘c’ is the number of samples and T is the matrix transpose.
The aim of LDA is to find projective vector V, which produces the maximum value for the following relation:
( ) (8)
From Eq. (8) V can be obtained by solving the generalized Eigen problem of FBV= ΛFWV
with its leading Eigen values.
An Artificial Neural Network (ANN) is used as classifier, which trained and tested on the basis of above mentioned the most relevant 10 selected features shown in Table 2.
Artificial Neural Network (ANN); It is a machine learning approach which is extensively being used for classification/discrimination, pattern recognition, prediction, analysis of complex data and many other tasks. Three layers feed-forward ANN classifier (available in MaZda software) has been employed in this research. The layers are categorized as input layer, hidden layer and output layer. Each layer is consists of
processing elements called neurons and each neuron of a layer is connected to all the neurons of the adjacent layer with different weights, defined by the network. The number of neurons in input layer corresponds to the number of selected features, which are 10, in this work. The output neurons of ANN are equal to the number of classes to be categorized in the data which are 4 in this case. The implemented network has 4 neurons in the hidden layer.
A non-linear logistic function (sigmoid function) f(s), defined by the following Eq. (9), with extreme values 0 and 1 for large negative values and large positive values of ‘s’ respectively, is used as activation function for each neuron in Eq. (9).
f(s) =
(9)
A neural network is trained in two modes; supervised and unsupervised, and in this research supervised mode of training has been employed. In such a mode output are predefined on the basis of input parameters and network is trained by applying Gradient Descent back-propagation, where weights updated values are calculated as:
( ) ( ) ( ) ( )
Where i is the iteration count and η is the learning rate.
By Haykin [31], we have
( )=
( ) (10)
Where ( ) is the step direction taken in the i-th iteration.
4.
Results and Discussions
At first attempt the above mentioned statistical textural features are extracted from ROIs having window size 16×16 pixels. For this purpose total (130×4) 520 ROIs are developed. The data of the 10 most significant features shown in Table 2, selected by Fisher Discriminant Ratio approach, when deployed to PCA and LDA, is clustered with an accuracy of 60.62% and 66.04% respectively. Due to poor results this data is discarded for further statistical analysis and 480 ROIs of 32×32 pixels are created input data. At this stage, data clustering capacity of the most relevant features is 82.50% and 85.00% in PCA and LDA projection spaces respectively. Better results tendency with the larger window of size of ROIs encouraged us to further increase the sub-image or ROI size. So, a total number of 444 sub-images with 64×64 pixels are generated in input data. The data of the
10 most significant features presented in Fig. 2 and Fig. 3 is clustered with an accuracy of 89.55% and 96.59% by PCA and LDA respectively. Due to the size constraints of input data images, it is impossible to develop a handsome amount of sub-images greater than 64×64, to have reliable statistical results.
Table1: Selected features and their Fisher coefficient
No. Features Co-efficient
1. Mean 26.8693
2. (0, 2) DE 3.1560
3. (0, 2) Contrast 2.9012 4. (0, 1) Contrast 2.7501
5. Variance 2.6725
6. (2, 2) DE 2.6151
7. (0, 3) DE 2.4786
8. (0, 1) IDM 2.3445
9. (2, 2) Contrast 2.2907
10. (1, 1) DE 2.1517
As, these features showed the best data clustering capability with an accuracy of 96.59% with LDA approach, so, these are the most significant statistical textural parameters which may be used for further analysis.
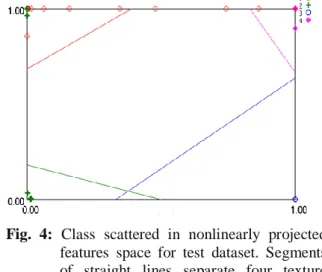
For training and testing purpose, two disjoint data sets with ratio 70/30 respectively, are developed. In this way above mentioned 10 features’ data from 320 ROIs, have been deployed to train the classifier. During training phase, we received an average accuracy of 98.17%, when the above discussed classifier having 10-4-4 architecture under learning rate (η= 0.15) with 100 iterations is employed. Only 6 ROIs have been misclassified as shown in Table 3. In testing phase BWP-16 andAzri-06 are classified with 100% accuracy, whereas, classification accuracy for NM-92 is 83.87% and for NM-13 it is 93.55% as given in Table 4. Class scattered in nonlinearly projected features space for test dataset is shown in Table 4. In this way system produced an average accuracy of 94.35% for all four varieties.
Table 2:Confusion matrix for system performance during training phase
Graphical interpretation of above data is given in Fig. 2.
Fig. 2: Analysis report of training dataset Table3: Confusion matrix of system output for
testing phase
Graphical interpretation of test classification is given in Fig. 3.
Fig. 3: Analysis report for testing dataset
Data representation of the final classification of all mentioned classes of the Mung-Beans in Class scattered in nonlinearly
0 20 40 60 80 100
NM-92 NM-13 BWP-16 Azri-06
0 10 20 30 40
NM-92 NM-13 BWP-16 Azri-06
NM-92
NM-13
BWP-16
Azri-06
NM-92 79 0 1 2
NM-13 0 82 0 0
BWP-16 2 0 79 1
Azri-06 0 0 0 82
NM-92
NM-13
BWP-16
Azri-06
NM-92 26 0 2 3
NM-13 2 29 0 0
BWP-16 0 0 31 0
projected features space for test dataset are shown in in Fig. 4 which is the output of B11 software.
Fig. 4: Class scattered in nonlinearly projected features space for test dataset. Segments of straight lines separate four texture classes in a new feature space
5.
Conclusion
In this study a neural network model has been developed which is trained and tested using quantitative parameters (statistical texture features) for the differentiation of four Mung-Beans varieties. The best results, 98.17% and 94.35%, for training and testing, respectively, are received when data of 10 the most relevant features extracted from ROI (64×64), is deployed to the established classifier. For ROIs (16×16) and (32×32) the results are poor, may be due to insufficient textural information, because the images do not meet the true conditions of micro and fine texture, which are the basic requirements to use the extracted second-order parameters [25]. Eight out of 10 selected features belong to second-order parameters and only two features ‘mean’ and ‘variance’ are from first-order parameter. In second-order parameters Difference Entropy and Contrast in the direction of 0° and 1350° are more significant.
In future, the same dataset of images will be tried to analyze with other types of textural parameters such as, Run-length matrices parameters, Difference matrices parameters and Auto-regressive parameters etc.
This approach of seed selection can be utilized in smart phone applications by a common former very easily.
6.
Acknowledgement
We acknowledge the co-operation of Agriculture Regional Research Centre, Bahawalpur Region, Bahawalpur, National College of Business Administration and
Economics, Sub-Campus Bahawalpur, Khawaja Fareed University of Engineering and Technology Rahim Yar Khan, Pakistan to provide the pleasant atmosphere and resources to complete this work.
7.
References
[1] G. N. Arain, "Mungbean cutivation in Pakistn", 2012. [Online]. Available": http://www.valleyirrigationpakistan.com/wp -content/uploads/2012/09/Mung-bean-Cultivation-in-Pakistan.pdf.
[2] dawn, "Mungbean — a rich source of protein", 2007. [Online]. Available: https://www.dawn.com/news/242480 [3] J. Levy, "Mung Beans Nutrition & Its Big
Benefits," 2019. [Online]. Available:https://draxe.com/mung-beans-nutrition/
[4] E. S . Oplinger, L. L. Hardman, S. Kaminski, M. Combs, and J. D. Doll, "Mungbean," University of Wisconsin-, Madison May,1990.
[5] Mahajan, Shveta, Das, Amitava, Sardana, and H. Kumar,"Image acquisition techniques for assessment of legume quality," Trends in Food Science & Technology, vol. 42, pp. 116-133, 2015. [6] M. A. S. a. S. J. Symons, "A machine
vision system for grading lentils," Canadian Grain Commission, vol. 43, pp. 7.7-7.14, 2001.
[7] B. S. a. D. G. S. Anami, "Improved Method for identification and classification of foreign boundries mixed food grain image sample," ICGST- International Journal on Artificial Intelligence and Machine Learning, vol. 9, pp. 1-8, 2009.
[8] F. Kurtulmus, I. Alibas, and I. Kavdir, "Classification of pepper seeds using machine vision based on neural network," Int. J. Agric. and Biol. Eng. , vol. 9, pp. 51-62, 2016.
[9] D. Liu, Y. Li, and L. Goa, "Research of maize seeds classification recognition based on the image processing," International Journal of Signal Processing, Image Processing and Pattern Recognition, vol. 9, pp. 181-190, 2016.
[10] K. Sabanci, A. Kayabasi, and A. Toktas, "Computer vision based-method for classification of wheat grains using artificial
neural networks," Journal of Science Food Agric., vol. 97, no. 8 pp. 2588-2593, 2016. [11] P. Zapotocnzy, "Discrimination of wheat
grain varieties using image analysis and multidimensional analysis texture of grain mass" International Journal of food properties, vol. 17, pp. 139-151, 2014. [12] M. Huang, J. Tang, B. Yang, and Q. Zhu,
"Classification of maize seeds of different years baased on hyperspectral imaging and model updating," Computers and Electronics in Agriculture vol. 122, pp. 139-145, 2016.
[13] X. Zhang, F. Liu, Y. He, and X. Li, "Application of hyperspectral imaging and chemometric calibrations for variety discrimination of maize seeds," Sensors, vol. 12, pp. 17234-17246, 2012.
[14] A. A. Abdullah, and M. A. Quteishat, "Wheat seeds classification using multi-layer perceptron artificial neural network," International Journal of Electronics Communication and Computer Engineering, vol. 6, pp. 307-309, 2015.
[15] N. Panmedey, S. Krishna, and S. Sharma, "Automatic seed classification by shape and color features by using machine vision technology," Internatoinal Journal of Computer Applications Technology and Research, vol. 2, pp. 208-213, 2013. [16] Neelam and J. Gupta, "Identification and
Classification of Rice varieties using Mahalanobis Distance by Computer Vsision, "Journal of Scientific and Research Publications, vol. 5, pp. 1-5, 2016.
[17] R. Birla, and P. A. Singh, "An efficient method for quality analysis of rice using machine vision system," Journal of Advance Information Technology, vol. 6, pp. 140-145, 2015.
[18] X. Chen, Y. L. Xun, , W. U and J. Zhang, "Combining discriminant analysis and neural networks for corn variety identification," Computers and Electronics in Agriculture, vol. 71, pp. 548-553, 2010. [19] S. Ghamari, "Classification of chickpea
seeds using supervised and unsupervised neural networks," African Journal of Agricultural Research, vol. 7, pp. 3193-3201, 2012.
[20] H. K. Mebatsion, J. Paliwal, and D. S. Jayas, "Automatic classification of non-touching cereal grains in digital images using limited morphological and color features," Computers and Electronics in Agriculture, vol. 90, pp. 99-105, 2013. [21] N. S. Visen, J. Paliwal, and N. D. G. White,
"Image analysis of bulk grain samples using neural networks," Canadian Biosystems Engineering, vol. 46, pp. 7.11-7.15, 2004. [22] M. Shahid, M. S. Naweed, E. A. Rehmani,
and Mutiullah, "Varietal discrimination of wheat seeds by machine vision approach" Life Science Journal, vol. 11, pp. 245-252, 2014.
[23] P. Zapotocnzy, "Application of image texture analysis for varietal classification of barly" International Agrophysics, vol. 26, pp. 81-90, 2012.
[24] A. Pourrez, H. P. Reza, M. Abbaspur, Fard, and H. Sadrina, "Identification of nine iranian wheat varieties by texture analysis," Computers and Electronics in Agriculture, vol. 83, pp. 102-108, 2012.
[25] R. M. Haralick, K. Shanmugam, and I. Distein, "Texture Features for Image Classification," IEEE Transactions on System, Man and Cybernetics, vol. SMC-3, pp. 610-621, 1973.
[26] P. M. Szczypiński, M. Strzelecki, A. Materka, and A. Klepaczko, "MaZda—A software package for image texture analysis," Computer Methods and Programs in Biomedicine, vol. 94, no. 1, pp. 66-76, 2009.
[27] S. Kara, and F. Dirgenali, "A System to Diagnose Atherosclerosis via Wavelet Transforms, Principal Component Analysis and Artificial Neural Networks" Expert Systems with Applications, vol. 32, pp. 632-640, 2007.
[28] T. Raykov, and G. A. Marcoulides, "An Introduction to Applied Multivariate Analysis. New York": Routledge Taylor & Francis Group, 2008.
[29] J. F. Hair, W. C. Black, B. J. Babin, R. E. Anderson, and R. L.Tatham, "Multivariate Data Analysis, 6th ed. New Jersey": Prentice Hall, Upper Saddle River, 2006. [30] R. O. Duda, P. E. Hart, and D. G. Stork,
Classification, vol. 24, no. 2 pp. 305-307, 2007.
[31] S. Haykin, "Neural Networks: A Comprehensive Foundation 2nd," Prentice Hall PTR Upper Saddle River, NJ, USA 1998.
[32] V. C. Brenda, B. E. Leticia, B. P. Maria, G. P. Roberto, and G. W. Rodolfo, "Intra-regional classification of grape seeds produced in Mendoza province (Argentina)
by multielemental analysis and chemometrics tools," Food Control, vol. 242, pp. 272-278, 2018.
[33] P. R. Michael, E. G. Jose, J. H. Melisa, V. A. Maria, and G. P. Roberto, "Classification of cowpea beans using multielemental fingerprinting combined with supervised learning," Food Control, vol. 95, pp. 232-241, 2019.