R E S E A R C H
Open Access
Developing an early-warning system for
spotting at-risk students by using eBook
interaction logs
Gökhan Akçap
ı
nar
1,2*, Mohammad Nehal Hasnine
1, Rwitajit Majumdar
1, Brendan Flanagan
1and Hiroaki Ogata
1* Correspondence:
1Academic Center for Computing
and Media Studies, Kyoto University, Kyoto, Japan
2
Department of Computer Education and Instructional Technology, Hacettepe University, Ankara, Turkey
Abstract
Early prediction systems have already been applied successfully in various educational contexts. In this study, we investigated developing an early prediction system in the context of eBook-based teaching-learning and used students’eBook reading data to develop an early warning system for students at-risk of academic failure -students whose academic performance is low. To determine the best performing model and optimum time for possible interventions we created prediction models by using 13 prediction algorithms with the data from different weeks of the course. We also tested effects of data transformation on prediction models. 10-fold cross-validation was used for all prediction models. Accuracy and Kappa metrics were used to compare the performance of the models. Our results revealed that in a sixteen-week long course all models reached their highest performance with the data from the 15th week. On the other hand, starting from the 3rd week, the models classified low and high performing students with an accuracy of over 79%. In terms of algorithms, Random Forest (RF) outperformed other algorithms when raw data were used, however, with the transformed data J48 algorithm performed better. When categorical data were used, Naive Bayes (NB) outperformed other algorithms. Results also indicated that models with transformed data performed lower than the models created using categorical data. However, models with categorical data showed similar performance with models with raw data. The implications of the results presented in this research were also discussed with respect to the field of Learning Analytics.
Keywords:Early-warning systems, At-risk students, Educational data mining, Learning analytics, Academic performance prediction
Introduction
Digital learning materials especially digital textbooks is a core part of modern educa-tion, and the adoption of digital textbooks in education is increasing. The benefits of using digital textbooks in education are mutual between teachers and students. With a digital textbook system, teachers can display their contents in an interactive way of deepening classes in an easier-to-understand manner. For instance, teachers can en-large the most critical parts, upload appropriate audio/video materials to support con-tents, select narration of certain sentences, etc. On the other hand, for students, digital textbooks are like a well-arranged information terminal where individual’s learning
activities, including one’s personality, abilities, interactivity, engage-ability, pro-activeness are stored. In addition to its advantages on students’ learning, digital text readers are capable of recording interactions regarding students’reading behaviors. However, despite the increase in use, research analyzing students’ interaction with digital textbooks is still limited.
Previous studies were evident that students’academic performance can be predicted by using e-book based log data (Daniel and Woody2013; Junco and Clem2015). How-ever, any recognized studies were not found that are carried out to develop an early warning system by utilizing this data. In general, early warning systems are perdition models used to prevent expected failure at an early stage. In higher education, these models help teachers to detect drop-outs (Chung and Lee 2019) or possible academic failures (Macfadyen and Dawson 2010). Hence, in this paper, we aimed at developing an early warning system for identifying at-risk students by analyzing students’ eBook interaction data. This study defines at-risk students whose academic performance is less than 50% of the class based on their in-class exercises (i.e., quiz) and final exam score. Consequently, we address the following main research question and three related re-search questions:
How to predict students’ end-of-semester academic performance based on their in-teractions on an eBook application?
a. What is the best algorithm to predict student performance?
b. Does data transformation effect algorithms’prediction performance?
c. How early can a prediction model predict students’academic performance?
The rest of the paper is organized as follows: In the Background section, we summarize recent research on the educational early warning systems. In the Method section, we describe our data collection platform and data analysis processes. In the Re-sult section, we present the reRe-sults obtained, and in the final section, we draw our con-clusions and point out the possible directions for future work.
Background
Educational early warning systems
develop prediction models. The accuracy of the model is tested based on 336 students’ data those who are enrolled in a first-year university course, yield approximately 70% in the last weeks of the course. Their study also developed a set of graphical tools is to in-terpret the output information.
For identifying at-risk students early in the semester that used standards-based grad-ing, Marbouti et al. (2016) developed predictive models using performance data. Six different prediction methods, namely Logistic Regression, Support Vector Machine, De-cision Tree, Multi-layer Perceptron, Naïve Bayes Classifier, and k-Nearest Neighbor were used to identify at-risk students in their courses. This study reported that it might be possible to use Naïve Bayes Classifier to identify at-risk students with high accuracy during the semester for a class of having at least 120 students and less than 10% failure rate.
Hu et al. (2014), proposed an early warning system to detect at-risk students based on learning portfolios recorded in a learning management system. For this, various data-mining techniques including C4.5, LGR, and CART were applied on students’ learning activity data of an online undergraduate course. The proposed early warning system consists of a data mining engine, a knowledge base, and an inference engine, re-sponsible for producing early warning rules at different weeks of the course. This study also reported that, after spending a short learning period in the course, the early warn-ing system could provide accurate forecasts based on students’ learning portfolio data as the course of study progresses.
A study carried out by Costa et al. (2017), about how likely students are about to fail in introductory programming courses, applied educational data mining techniques to early predict. This study applied four data mining techniques (DecisionTree, Support Vector Machine, Neural Network, and Naive Bayes) on two independent datasets. One of which is a dataset from a distance education of 10 weeks long. Another was from an on-campus course of 16 weeks long. This study found that, in distance education courses, the decision tree technique is able to reach up to 82% effectiveness when stu-dents performed at least 50%. On the contrary, for an on-campus course, the decision tree technique reaches the effectiveness of 79% when the students have performed at least 25%. Based on this analysis, this study intended to provide educators and teachers with relevant information that will help them in early decision-making.
A recent study conducted by Howard et al. (2018) analyzed undergraduate students data to build prediction models for the early warning system. This study specifically in-vestigated on the optimal time while a course is in progress to apply an early warning system. After analyzing a dataset that only contains continuous assessment and back-ground information variables, this study yield that, the optimal time to implement an early warning system is after half-way through the course because 5–6 weeks (half-way) is the suitable time for students to make changes in their learning pattern while the prediction algorithms retained a reasonable accuracy.
a student will fail or success. According to this study, logistic regression based com-bined model having 59.5% accuracy can identify students those who are most likely to perform poorly.
In Massive Open Online Courses (MOOCs), low completion rates are considered to be the main problem. To overcome this problem, He et al. (2015) conducted a study aiming to accurate early identifying students who are at risk of not completing courses in MOOCs. This study analyzed Discrete Optimization Dataset launched by the Uni-versity of Melbourne. Two transfer learning algorithms LR-SEQ and LR-SIM based on regularized logistic regression were developed to support this study. This study yields that LR-SIM-based logistic regression was promising for early prediction because it has exceptional AUC in the first few weeks of the course.
In 2015, Kuzilek et al. (2015) of the Open University, UK published a case study for predicting at-risk students as early as possible. In this study, demographic (static) data and student interactions with the Virtual Learning Environment (VLE) system were an-alyzed using a Bayesian approach. Four predictive models were built for weekly predic-tion of at-risk students enrolled in two introductory courses. To present the results of the predictive models, a prototype of an online dashboard was developed where weekly predictions of at-risk students are delivered to the instructors.
Researcher of the Open University carried out a further study on early prediction to identify at-risk students (Wolff et al. 2014). In this study, researchers aimed to deter-mine the optimum time to make student intervention and to develop predictive models for early detection of at-risk students. For analysis, CART and Bayes models are employed for combining demographic data and data from the virtual learning environ-ment. Four prediction models were built to produce a list of students ranked based on their risk level. Predictions information of at-risk students is calculated and updated in a dashboard on a weekly-basis to feedback educators.
Concerning academic performance and eBook usage, there is a study that ana-lyzed students’ eBook interaction data indicates that the course outcome is directly related to reading a textbook (Daniel and Woody 2013). Junco and Clem (2015) also found a relation between students’ digital reading traces and their academic performance. In this paper, we investigated whether digital textbook usage data can be used to develop an early warning system for students at-risk of academic failure.
Methodology
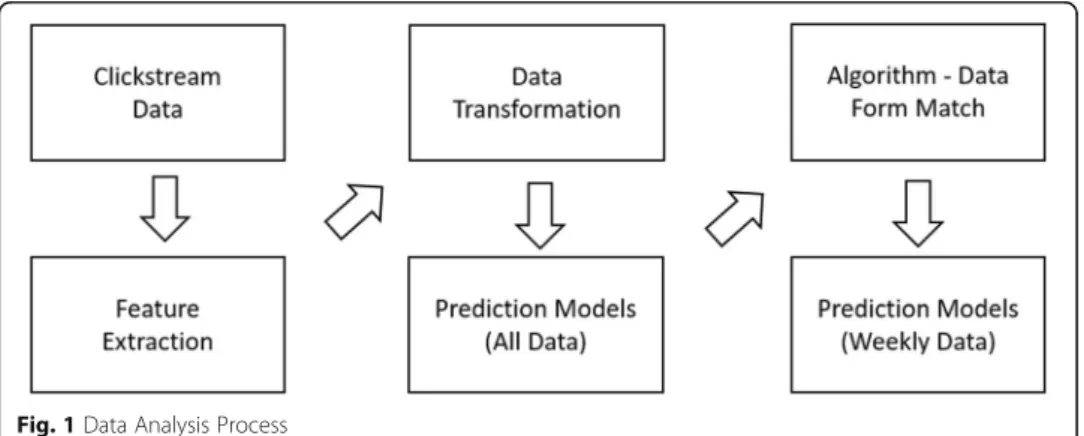
We structured methodology and results section based on the process given in Fig. 1. We first collect clickstream data, then extract features related to students’reading be-haviors. We prepared data in three different forms (raw, transformed, and categorical) to test data transformation effects on prediction algorithms. For data analysis, we first tested different prediction algorithms’ performance on data obtained before the final exam. After that, we determined the best performing algorithm for each data form. Then, we tested these algorithms on data from different weeks of the course to see how early we can predict students’ performances. Details of each section explained below.
Participants and data collection
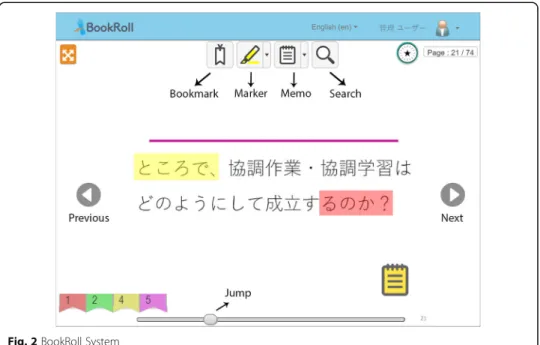
For this study, data were collected from an eBook system (see Fig.2.) named BookRoll that is developed by Ogata et al. (2015). The BookRoll system is currently being used in three universities in Asia. More than 10,000 university-students are using this eBook system to access their course materials inside or outside of the classroom. Fig.2. shows the interface of the BookRoll system.
To elaborate more, the BookRoll system has several features including red and yellow markers to highlight important and difficult parts of a content, respectively. In the sys-tem, students can add memos for remembering important points. Also, the system lets students bookmark pages so that they can access them easily while they are reviewing the contents. Besides, the system has navigation functions such as next, previous, jump, etc. for navigating between different pages. At present, the BookRoll system works within the Learning Analytics framework that is proposed by (Flanagan and Ogata 2017). With the help of this framework, anonymized data regarding students’ reading behaviors in the forms of Experience API (or xAPI) statements are collected. This
framework, by ensuring students’privacy, helps to collect various kinds of interaction data that are related to their eBook reading behaviors.
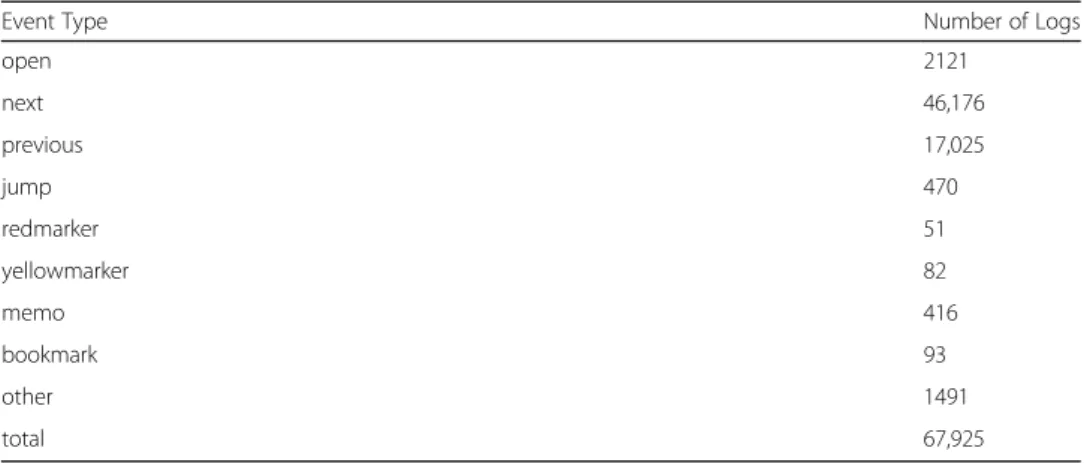
The present study is based on the analysis of over 65,000 click-stream data that are collected from 90 students registered in an Elementary Informatics Course at a univer-sity. The course was offered to first-year undergraduate university students. Students used the eBook system to access the course materials that were uploaded by the in-structor. The frequency of uploading the course materials by the instructor was once a week. Students were given 13 contents in different weeks of the course, and the eBook system recorded their interactions (e.g., next, previous, jump, highlight, adding a memo, bookmark, etc.). The semester was 16 weeks-long consisting of a 2-week-long break (i.e., 14 weeks for the whole course). Students’ academic performance was evaluated based on eight exercises across the semester and one final exam. Students’performance calculated based on these exercises (40%) and final exam score (60%). Table1 provides elaborated information more on the click-stream interaction data used for developing the early warning prediction system.
Data preprocess
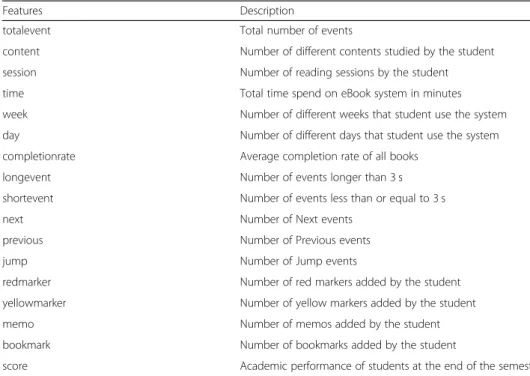
The first step to our analysis was data preprocessing where we preprocessed the raw data and extracted various features which are reflected to students’reading interactions. Raw data were preprocessed in four steps. In the first step, we extracted features from the raw data collected in the database. In the second step, we analyzed descriptive sta-tistics of features. Then, eliminated those features where students’ usage was limited. Table2shows the features used in the prediction models.
In the third step, we created weekly data. The reason we created weekly data is to compare developed models’ performances in different datasets to find optimum time for further interventions. In the fourth step, we applied data transformation and discretization methods to create three different data forms for each week’s interaction data. These three data forms are raw data, transformed data, and cat-egorical data.
For raw data, we used aggregated data without any modification. To prepare transformed data, we used percentile rank transformation to convert raw data be-tween 0 and 1 based on the formula given below (1) where PR is the percentile
Table 1Number of logs in each event
Event Type Number of Logs
open 2121
next 46,176
previous 17,025
jump 470
redmarker 51
yellowmarker 82
memo 416
bookmark 93
other 1491
rank score for each student, fb is the number of values which are less than the sin-gle student’s value of the percentile rank, fw is the number of values which have the same value as the value of the single student percentile rank, and N is the number of values.
PR¼ fbþ1
.
2 fw
N ð1Þ
For categorical data, we discretized transformed values for all features into three cat-egories as Low, Medium, and High by using equal width discretization method. Equal width discretization divides data into k intervals of equal size. We used previously transformed data and discretized each feature into three categories: Low (Score < = 0.33),Medium(0.33 < Score < = 0.66), andHigh(Score > 0.66).
The main reason to create three different data forms is to test the effects of data transformation on prediction performance following the research question. In terms of academic performance, we divided students into two groups: Low Performers (LP) and
High Performers (HP). To do that, we first calculated the percentile rank of students based on their final scores and then labeled them asLow Performers(Score < = 0.5) and
High Performers(Score > 0.5).
Data analysis
In machine learning field, researchers generally test a combination of different algo-rithms, different feature sets, and different data preprocessing methods on their dataset to find the best performing model (Marbouti et al. 2016; Pandey and Taruna 2016; Romero et al.2013). In this research, we followed a similar approach and tested differ-ent algorithms’performance on different data forms to find the best prediction model. Table 2Description of features used in prediction models
Features Description
totalevent Total number of events
content Number of different contents studied by the student
session Number of reading sessions by the student
time Total time spend on eBook system in minutes
week Number of different weeks that student use the system
day Number of different days that student use the system
completionrate Average completion rate of all books
longevent Number of events longer than 3 s
shortevent Number of events less than or equal to 3 s
next Number of Next events
previous Number of Previous events
jump Number of Jump events
redmarker Number of red markers added by the student
yellowmarker Number of yellow markers added by the student
memo Number of memos added by the student
bookmark Number of bookmarks added by the student
We selected and compared performance of following algorithms based on previous re-search findings: AdaBoost, Bayesian Additive Regression Trees (BART), Stochastic Gra-dient Boosting (GBM), Generalized Linear Model (GLM), C4.5-like Trees (J48), Rule-Based Classifier (JRip), k-Nearest Neighbors (kNN), Naïve Bayes (NB), Neural Network (NNET), Random Forest (RF), Classification and Regression Tree (RPART), Support Vector Machines with Linear Kernel (SVMLinear), and eXtreme Gradient Boosting (xgbLinear).
During the data analysis, instead of comparing all algorithms with all data sets we followed the 2-steps analysis. In the first step, we aimed at finding the best-performed algorithm in each data form (e.g., Random Forest-Raw Data, etc.). For this, we took data from the database before the final exam week (we chose this week to eliminate the final exam effect from the data). Then we trained thirteen algorithms mentioned above by using three different data forms (i.e., raw, transformed, and categorical) to find the best-performed algorithm in each data form.
In the second step, we used the best-performed algorithm for each data form and tested its performance on the data obtained from different weeks of the course. In that case, we compared three algorithm-data form pairs’ (e.g., Random Forest-Raw Data, etc.) performance in weekly data.
Each model’s performance was evaluated by 10-fold cross-validation. Since we have a balanced dataset, we used Classification Accuracy as the primary performance criteria to compare the results of the prediction models. We also used Cohen’s Kappa as sec-ondary metrics. It assesses the degree to which the model is better than chance at iden-tifying the low and high performers. A Kappa of 0 indicates the chance level performance while a Kappa of 1 means the perfect performance (Pardos et al.2013).
In this research, data analysis was conducted by R data mining software (R Core Team2017). We used dplry (Wickham et al.2017) and arules (Hahsler et al.2017), two R packages for data preprocessing. Machine learning analysis was conducted by using caret (Kuhn2008) package.
Results
Descriptive statistics and data preprocess
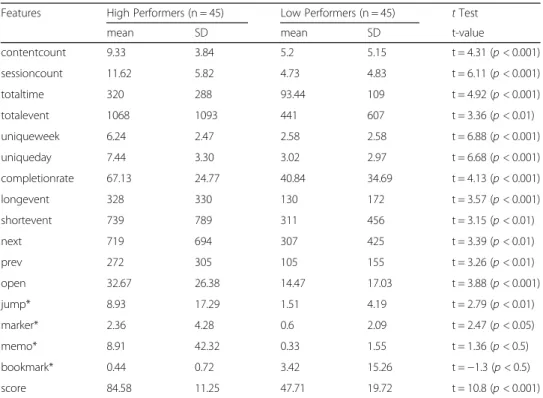
Descriptive statistics of all features for each group and the results of the statistical difference test are shown in Table 3. Result yield that High Performers used Book-Roll system more than Low Performers in terms of total time and the total number of actions. High Performers logged-in to the system more than Low Performers. They spent more time and did more interactions with the contents. Their average completion rates of the 13-contents were also significantly higher than Low Per-formers. With regard to jump, marker, memo, and bookmark, there was a signifi-cant difference observed between the two groups, but both groups’ data were low, especially at the beginning of the semester. Hence, these features were excluded from the dataset.
Table 3Descriptive statistics of features
Features High Performers (n = 45) Low Performers (n = 45) tTest
mean SD mean SD t-value
contentcount 9.33 3.84 5.2 5.15 t = 4.31 (p< 0.001)
sessioncount 11.62 5.82 4.73 4.83 t = 6.11 (p< 0.001)
totaltime 320 288 93.44 109 t = 4.92 (p< 0.001)
totalevent 1068 1093 441 607 t = 3.36 (p< 0.01)
uniqueweek 6.24 2.47 2.58 2.58 t = 6.88 (p< 0.001)
uniqueday 7.44 3.30 3.02 2.97 t = 6.68 (p< 0.001)
completionrate 67.13 24.77 40.84 34.69 t = 4.13 (p< 0.001)
longevent 328 330 130 172 t = 3.57 (p< 0.001)
shortevent 739 789 311 456 t = 3.15 (p< 0.01)
next 719 694 307 425 t = 3.39 (p< 0.01)
prev 272 305 105 155 t = 3.26 (p< 0.01)
open 32.67 26.38 14.47 17.03 t = 3.88 (p< 0.001)
jump* 8.93 17.29 1.51 4.19 t = 2.79 (p< 0.01)
marker* 2.36 4.28 0.6 2.09 t = 2.47 (p< 0.05)
memo* 8.91 42.32 0.33 1.55 t = 1.36 (p< 0.5)
bookmark* 0.44 0.72 3.42 15.26 t =−1.3 (p< 0.5)
score 84.58 11.25 47.71 19.72 t = 10.8 (p< 0.001)
*Features that were excluded from the dataset because of students' low participation
Prediction models
To create an early prediction model, we took data from different weeks of the course and compared the performance of the prediction algorithms on that datasets. Fig. 4 shows the cumulative number of events collected in the learning record store regarding students’ reading interactions. A total number of events is 67,925. The number of events recorded in the last two weeks (just before the final exam) was almost equal to the number of events recorded during the rest of the semester. In Fig. 4, it can also be seen that the number of events did not change between Week 3 and Week 5, Week 6 and Week 7, and Week 9 and Week 13. Therefore, we took data from Week 1, Week 2, Week 3, Week 6, Week 8, Week 9, Week 14, Week 15, and Week 16 to create the prediction models.
Fig. 4Cumulative number of total events in each week
Table 4Average scores of the models in terms of Accuracy and Kappa
Algorithm Raw Data Transformed Data Categorical Data
Accuracy Kappa Accuracy Kappa Accuracy Kappa
Adaboost 0.790 0.580 0.783 0.567 0.748 0.494
bartMachine 0.811 0.620 0.813 0.625 0.792 0.583
gbm 0.795 0.589 0.793 0.586 0.782 0.565
glm 0.753 0.504 0.728 0.454 0.680 0.359
J48 0.813 0.625 0.833 0.665 0.766 0.530
JRip 0.795 0.587 0.782 0.564 0.755 0.509
knn 0.813 0.627 0.798 0.595 0.805 0.611
naive_bayes 0.823 0.646 0.801 0.601 0.811 0.621
nnet 0.710 0.420 0.780 0.558 0.754 0.505
rf 0.823 0.647 0.824 0.644 0.782 0.563
rpart 0.752 0.501 0.759 0.516 0.727 0.454
svmLinear 0.776 0.550 0.749 0.498 0.684 0.369
xgbLinear 0.798 0.596 0.780 0.560 0.726 0.452
Prediction models with all data
We tested all 13 algorithms’ performance on the data taken from the 14th week of the course (before the final exam). Table 4 reports the results of the analysis in terms of average Accuracy and Kappa obtained from cross-validation.
For the raw data, RF outperformed other algorithms in terms of Accuracy and Kappa metrics. However, with the transformed data J48 algorithm performed better. For cat-egorical data, NB outperformed other algorithms. On the other hand, almost all algo-rithms predicted Low andHigh Performerscorrectly with an accuracy between 72% and 84%. In terms of Kappa values, most of the model produced acceptable results (at least 50% better than chance).
Based on these results, we decided the best algorithm for each dataset and continued weekly analysis with selected algorithms. Finally, we used the RF for raw data, J48 for transformed data, and NB for categorical data.
Prediction models with weekly data
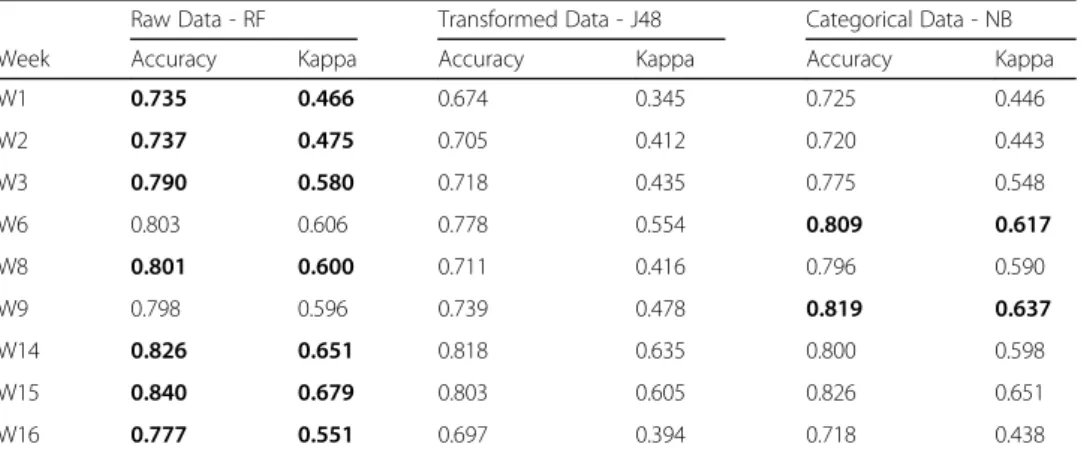
We compared selected algorithms’ performance on data from different weeks of the course. Table5and Fig.5shows the results of the weekly analysis. Best performed algo-rithm’s results for each week is highlighted in bold.
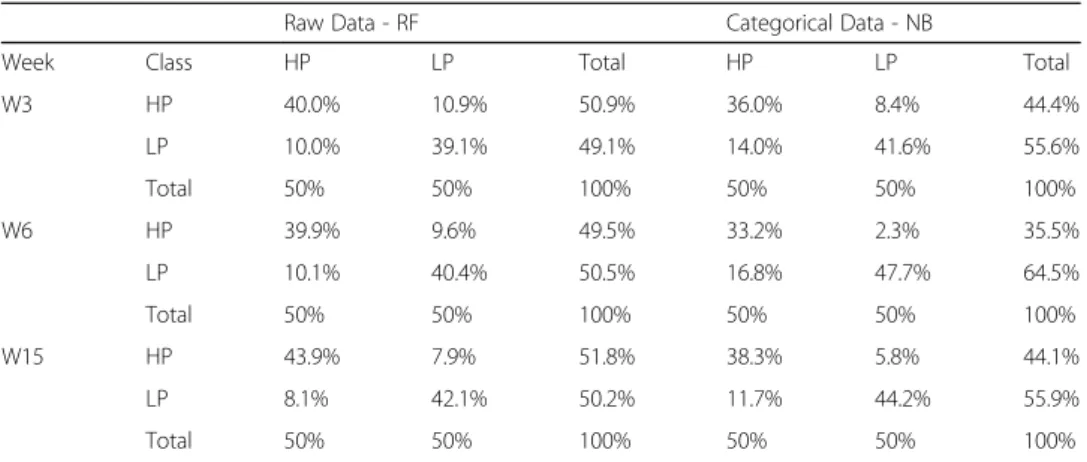
Results indicate that models with transformed data performed lower than the other two models. However, models with categorical data showed similar performance with models with raw data. Based on Accuracy and Kappa values we continued further ana-lysis with the data from Week 3, Week 6, and Week 15. We included Week 3 and Week 6 since these weeks found optimal in previous research to make interventions (Howard et al. 2018). We selected Week15 as a benchmark to compare Week3 and Week6 models’performance. In Table 6, the average performance of the models after cross-validation is given in the forms of the confusion matrix. Columns in Table6 rep-resent the actual data while rows are predicted values. We omitted the results of the models created with transformed data because of their low performance (see Table5).
In Table6, we can see that in Week 3, RF algorithm’s average accuracy is 79.1%. And this algorithm classified 40% of the students as High Performers while 39.1% as Low
Table 5Average scores of the models in terms of Accuracy and Kappa
Raw Data - RF Transformed Data - J48 Categorical Data - NB
Week Accuracy Kappa Accuracy Kappa Accuracy Kappa
W1 0.735 0.466 0.674 0.345 0.725 0.446
W2 0.737 0.475 0.705 0.412 0.720 0.443
W3 0.790 0.580 0.718 0.435 0.775 0.548
W6 0.803 0.606 0.778 0.554 0.809 0.617
W8 0.801 0.600 0.711 0.416 0.796 0.590
W9 0.798 0.596 0.739 0.478 0.819 0.637
W14 0.826 0.651 0.818 0.635 0.800 0.598
W15 0.840 0.679 0.803 0.605 0.826 0.651
W16 0.777 0.551 0.697 0.394 0.718 0.438
Performers. Ideally, 50% of the students should be High Performers (n = 45) and 50% should be Low Performers(n = 45). Performance of the RF algorithm for the data from Week 6 is also similar, but it increased to 43.9% forHigh Performersand 42.1% forLow Performers. On the other hand, for Week 3 data, NB algorithm with categorical data classified 36% of the students as High Performerswhile 41.6% as Low Performers. For Week 6 data, the RF algorithm showed similar performance to Week 3, but NB algo-rithm predicted 64.5% of the students as Low Performers. For Week 15 data, both algo-rithms achieved their best performance. In general, RF predicted both classes equally. However, NB tends to predict Low Performers as High Performers, especially with the Week 3 and Week 6 data. Starting from Week 3 both algorithms predicted more than 80% ofLow Performerscorrectly.
Discussion and conclusion
Low academic performance and high drop-out rates are important problems in education (Villagrá-Arnedo et al.2017). On the other hand, studies showed that timely interventions
Fig. 5Visualization of Accuracy and Kappa values
Table 6Confusion matrix of the best perform models
Raw Data - RF Categorical Data - NB
Week Class HP LP Total HP LP Total
W3 HP 40.0% 10.9% 50.9% 36.0% 8.4% 44.4%
LP 10.0% 39.1% 49.1% 14.0% 41.6% 55.6%
Total 50% 50% 100% 50% 50% 100%
W6 HP 39.9% 9.6% 49.5% 33.2% 2.3% 35.5%
LP 10.1% 40.4% 50.5% 16.8% 47.7% 64.5%
Total 50% 50% 100% 50% 50% 100%
W15 HP 43.9% 7.9% 51.8% 38.3% 5.8% 44.1%
LP 8.1% 42.1% 50.2% 11.7% 44.2% 55.9%
Total 50% 50% 100% 50% 50% 100%
for at-risk students are effective to help them to change their behaviors (Arnold and Pis-tilli2012; Tanes et al.2011). Detection of at-risk students at an early stage of the course is crucial to design interventions. However, especially in large classrooms, this can be a chal-lenging task for instructors without getting technological support.
In this study, we analyzed students’ reading patterns to create an early warning sys-tem to identify at-risk students. One of the key contributions of this present work is to use eBook-based click-stream data for developing an early warning system that can spot at-risk students while the semester is in progress. For our analysis, we first tested thir-teen different prediction algorithms’ performance on data before the final exam. We prepared data in three different forms (raw, transformed, and categorical) and tested all algorithms with these data. After that, we determined the bestalgorithm-data formpair for each case. Then, we tested these algorithms on data from Week1, Week2, Week3, Week6, Week9, Week14, Week15, and Week16 of the course to see how early we can predict students’performances.
Our results revealed that low and high performer students could be correctly identi-fied based on their eBook interaction from the 3rd week of the course. Among all, models created with the 15th week of data outperformed others. In that week, the model was built using raw data predictedLowandHigh Performerstudents with an ac-curacy of 84%. The model’s highest accuracy was noted on the 3rd week and 6th week is 79% and 81%, respectively. Previous studies also revealed that data from the third week could be used for early prediction (He et al.2015).
After the 15th week, we found that the accuracy and kappa values decreased almost the same level as at the beginning of the semester. One of the possible reasons for this is that the low performers might have studied harder before the final exam. Therefore, this week, their interaction increased but they got low scores from the final exam and classifiers could not predict these students accurately.
In this study, we transformed the data into three different forms and tested their effects on prediction models’ performance. We found that, the models with transformed data produced the lowest performance in all datasets. On the other hand, models with categor-ical data showed better performance than models used transformed (continues) data only. These findings are important to creating generic models since the quantity of the data is different in different courses, but it is possible to split data into the same levels (low, medium, high). Researchers also suggest data discretization to generate models that are easy to interpret by non-expert users (Romero et al.2008a; Romero et al.2008b).
The present study has a few limitations. First, we assumed that all students used Book-Roll as the main source for preparing the course. However, we could not ensure the fact that students have not downloaded or printed out the course materials although the sys-tem does not allow these operations. Second, we eliminated features such as Marker and Memo since the usage of these actions were done by limited number of students. How-ever, these features are essential to understanding how actively students engaged with the learning material. In the future, we are planning to implement instructional strategies to encourage students to write a memo or use marker while reading.
help these students to change their reading behaviors and improve their overall success. Hence, in the future, we plan to implement this prediction model into our learning ana-lytics dashboard so that instructors get feedback about their students’ level of inter-action and level of at-risk in a timely manner.
Abbreviations
BART:Bayesian Additive Regression Trees; GBM: Stochastic Gradient Boosting; GLM: Generalized Linear Model; J48: C4.5-like Trees; JRip: Rule-Based Classifier; kNN: k-Nearest Neighbors; NB: Naïve Bayes; NNET: Neural Network; RF: Random Forest; RPART: Classification and Regression Tree; SVMLinear: Support Vector Machines with Linear Kernel; xgbLinear: eXtreme Gradient Boosting
Acknowledgements
Not applicable.
Funding
This work was partly supported by JSPS Grant-in-Aid for Scientific Research (S) 16H06304, NEDO Special Innovation Program on AI and Big Data 18102059–0 and Hacettepe University Scientific Research Projects Coordination Center SBI-2017-16268.
Availability of data and materials
The datasets used and/or analyzed during the current study are available from the corresponding author on reasonable request.
Authors’contributions
GA drafted the initial manuscript and performed data analysis. MNH reviewed the literature. GA and MNH reviewed and revised the manuscript into its final shape. RM and BF provided insight and editing of the manuscript. HO provided supervision of the research. All authors read and approved the final manuscript.
Competing interests
The authors declare that they have no competing interests.
Publisher’s Note
Springer Nature remains neutral with regard to jurisdictional claims in published maps and institutional affiliations.
Received: 11 February 2019 Accepted: 22 April 2019
References
K.E. Arnold, M.D. Pistilli, inProceedings of the 2nd International Conference on Learning Analytics and Knowledge.Course signals at Purdue: using learning analytics to increase student success (ACM, Vancouver, 2012), pp. 267-270.
R.S. Baker, D. Lindrum, M.J. Lindrum, D. Perkowski,Analyzing Early At-Risk Factors in Higher Education e-Learning Courses. Paper presented at the 8th International Conference on Education Data Mining(Madrid, 2015)
J.Y. Chung, S. Lee, Dropout early warning systems for high school students using machine learning. Child Youth Serv. Rev.96, 346–353 (2019).https://doi.org/10.1016/j.childyouth.2018.11.030.
E.B. Costa, B. Fonseca, M.A. Santana, F.F. de Araújo, J. Rego, Evaluating the effectiveness of educational data mining techniques for early prediction of students' academic failure in introductory programming courses. Comput. Hum. Behav.
73, 247–256 (2017).https://doi.org/10.1016/j.chb.2017.01.047.
D.B. Daniel, W.D. Woody, E-textbooks at what cost? Performance and use of electronic v. print texts. Comput. Educ.62, 18–23 (2013).https://doi.org/10.1016/j.compedu.2012.10.016.
B. Flanagan, H. Ogata,Integration of learning analytics research and production systems while protecting privacy. Paper Presented at the 25th International Conference on Computers in Education(APSCE, Christchurch, 2017).
Hahsler, M., Buchta, C., Gruen, B., & Hornik, K. (2017). arules: Mining Association Rules and Frequent Itemsets. Retrieved from https://CRAN.R-project.org/package=arules.
J. He, J. Bailey, B.I.P. Rubinstein, R. Zhang, inProceedings of the Twenty-Ninth AAAI Conference on Artificial Intelligence.
Identifying at-risk students in massive open online courses (ACM, Austin, 2015), pp. 1749-1755
E. Howard, M. Meehan, A. Parnell, Contrasting prediction methods for early warning systems at undergraduate level. Internet High. Educ.37, 66–75 (2018).https://doi.org/10.1016/j.iheduc.2018.02.001.
Y.-H. Hu, C.-L. Lo, S.-P. Shih, Developing early warning systems to predict students’online learning performance. Comput. Hum. Behav36, 469–478 (2014).https://doi.org/10.1016/j.chb.2014.04.002.
R. Junco, C. Clem, Predicting course outcomes with digital textbook usage data. Internet High. Educ.27, 54–63 (2015).
https://doi.org/10.1016/j.iheduc.2015.06.001.
M. Kuhn, Building predictive models in R using the caret package. J. Stat. Softw.28(5), 1–26 (2008).https://doi.org/10.18637/ jss.v028.i05.
J. Kuzilek, M. Hlosta, D. Herrmannova, Z. Zdrahal, A. Wolff,LAK15 Case Study 1: OU Analyse: Analysing At-Risk Students at The Open University, Learning Analytics Review, no. LAK15-1, March 2015, ISSN: 2057-7494. http://www.laceproject.eu/learning-analytics-review/analysing-at-risk-students-at-open-university/
F. Marbouti, H.A. Diefes-Dux, K. Madhavan, Models for early prediction of at-risk students in a course using standards-based grading. Comput. Educ.103, 1–15 (2016).https://doi.org/10.1016/j.compedu.2016.09.005.
H. Ogata, C. Yin, M. Oi, F. Okubo, A. Shimada, K. Kojima, M. Yamada,E-Book-based learning analytics in university education. Paper presented at the International Conference on Computer in Education(APSCE, Hangzhou, 2015).
M. Pandey, S. Taruna, Towards the integration of multiple classifier pertaining to the Student's performance prediction. Perspect. Sci8, 364–366 (2016).https://doi.org/10.1016/j.pisc.2016.04.076.
Z.A. Pardos, R.S.J.D. Baker, M.O.C.Z.S. Pedro, S.M. Gowda, inProceedings of the Third International Conference on Learning Analytics and Knowledge.Affective states and state tests: investigating how affect throughout the school year predicts end of year learning outcomes (ACM, Leuven, 2013), pp. 117-124.
R Core Team. (2017). R: A language and environment for statistical computing: R Foundation for Statistical Computing. Retrieved from https://www.R-project.org/.
C. Romero, M.-I. López, J.-M. Luna, S. Ventura, Predicting students' final performance from participation in on-line discussion forums. Comput. Educ.68, 458–472 (2013).https://doi.org/10.1016/j.compedu.2013.06.009.
C. Romero, S. Ventura, P.G. Espejo, C. Hervás,Data Mining Algorithms to Classify Students. Paper presented at the Educational data mining 2008(2008a).
C. Romero, S. Ventura, E. García, Data mining in course management systems: Moodle case study and tutorial. Comput. Educ.
51(1), 368–384 (2008b).https://doi.org/10.1016/j.compedu.2007.05.016.
Z. Tanes, K.E. Arnold, A.S. King, M.A. Remnet, Using signals for appropriate feedback: Perceptions and practices. Comput. Educ.
57(4), 2414–2422 (2011).https://doi.org/10.1016/j.compedu.2011.05.016.
C.J. Villagrá-Arnedo, F.J. Gallego-Durán, F. Llorens-Largo, P. Compañ-Rosique, R. Satorre-Cuerda, R. Molina-Carmona, Improving the expressiveness of black-box models for predicting student performance. Comput. Hum. Behav.72, 621–631 (2017).
https://doi.org/10.1016/j.chb.2016.09.001.
Wickham, H., Francois, R., Henry, L., & Müller, K. (2017). dplyr: A Grammar of Data Manipulation. Retrieved from https://CRAN.R-project.org/package=dplyr.