Quality by Design for ANDAs:
An Example for
Modified Release Dosage Forms
Introduction to the Example
This is an example pharmaceutical development report illustrating how ANDA applicants can move toward implementation of Quality by Design (QbD).
The purpose of the example is to illustrate the types of pharmaceutical development studies ANDA applicants may use as they implement QbD in their development process and to promote discussion on how OGD would use this information in review.
Although we have tried to make the example as realistic as possible, the development of a real product may differ from this example. The example is for illustrative purposes and, depending on applicants’ experience and knowledge, the degree of experimentation for a particular product may vary. The impact of experience and knowledge should be thoroughly explained in the submission. The risk assessment process is one avenue for this explanation. At many places in this example alternative pharmaceutical development approaches would also be appropriate. Notes to the reader are included in italics throughout the text. Questions and comments may be sent to [email protected]
Pharmaceutical Development Report
Example QbD for MR Generic Drugs
Table of Contents
1.1 Executive Summary... 4
1.2 Analysis of the Reference Listed Drug Product... 7
1.2.1 Clinical...7
1.2.2 Pharmacokinetics...7
1.2.3 Drug Release...8
1.2.4Physicochemical Characterization...9
1.2.5Composition...10
1.3 Quality Target Product Profile for the ANDA Product... 11
1.4 Dissolution Method Development and Bioequivalence Studies... 17
1.4.1Development of a Predictive Dissolution Method...18
1.4.3 Pivotal Bioequivalence Study...26
2.1 Components of Drug Product... 28
2.1.1 Drug Substance...28
2.1.1.1 Physical Properties...28
2.1.1.2 Chemical Properties...30
2.1.1.3 Biological Properties...30
2.1.1.4 Risk Assessment of Drug Substance Attributes...31
2.1.2 Excipients...33
2.1.2.1 Excipients in the IR Granules...33
2.1.2.2 Excipients in the ER Coated Beads...35
2.1.2.3 Excipients in Example MR Tablets, 10 mg...36
2.2 Drug Product... 38
2.2.1 Formulation Development...38
2.2.1.1 Initial Risk Assessment of the Formulation Components...39
2.2.1.2 IR Granule Formulation Development...42
2.2.1.3 ER Bead Formulation Development...43
2.2.1.4 Prototype Tablet Formulation Development...62
2.2.1.5 Prototype Tablet Formulations and Trial BE Studies...71
2.2.1.6 Updated Risk Assessment of the Formulation Components...75
2.2.2 Overages...77
2.2.3 Physicochemical and Biological Properties...77
2.3 Manufacturing Process Development... 78
2.3.1 Initial Risk Assessment of the Drug Product Manufacturing Process...80
2.3.2 IR Granule Process Development...83
2.3.3 ER Bead Process Development...84
2.3.3.1 Drug Layering Process Development...85
2.3.3.2 ER Polymer Coating Process Development...99
2.3.4 Blending and Lubrication Process Development...120
2.3.6 Exhibit Batch...139
2.3.7 Scale-up to Commercial Scale...141
2.3.7.1 Scale-up of IR Granulation...141
2.3.7.2 Scale-up of ER Beads Drug Layering and Polymer Coating...142
2.3.7.3 Scale-up of Blending and Compression...147
2.3.8 Updated Risk Assessment of the Drug Product Manufacturing Process...148
2.4 Container Closure System... 150
2.5 Microbiological Attributes... 150
2.6 Compatibility... 151
2.7 Control Strategy... 151
2.7.1 Control Strategy for IR Granules...151
2.7.2 Control Strategy for ER Coated Beads...153
2.7.3 Control Strategy for Example MR Tablets, 10 mg...155
2.7.4 Product Lifecycle Management and Continual Improvement...158
A.1 Appendix I... 160
1.1 Executive Summary
The following pharmaceutical development report summarizes the development of Example Modified Release (MR) Tablets, 10 mg, a generic version of the reference listed drug (RLD), Brand MR Tablets, 10 mg, indicated for therapeutic relief. We used a Quality by Design (QbD) approach to develop a tablet formulation and manufacturing process that ensures the quality, safety and efficacy of Example MR Tablets.
Initially, the quality target product profile (QTPP) was defined based on the properties of the drug substance, characterization of the RLD product, and consideration of the RLD label and intended patient population. Example MR Tablets were designed to achieve all of the attributes in the QTPP. However, our investigation during pharmaceutical development focused on those critical quality attributes (CQAs) that could be impacted by a realistic change to the drug product formulation or manufacturing process. For Example MR Tablets, these attributes included
physical attributes (size and splitability), assay, content uniformity and drug release.
Example MR Tablets contain drug substance Z, a chemically stable BCS Class I compound. To match the RLD, Example MR Tablets were designed to have immediate release (IR) granules and extended release (ER) coated beads with extragranular cushioning agents and other excipients all compressed into scored tablets. ANDA aaaaaa documents the approved
formulation and manufacturing process for the IR granules. Kollicoat SR 30 D was selected as the release rate controlling polymer and the formulation was optimized using design of
experiments (DOE). Two grades of microcrystalline cellulose (MCC) were used in an optimized ratio to prevent segregation of the IR granules and ER coated beads. The appropriate levels of disintegrant (sodium starch glycolate) and lubricant (magnesium stearate) were also identified to produce a robust formulation.
A predictive dissolution method was a key element of our development program. We developed the method (USP apparatus 3 at 10 dpm in 250 mL of pH 6.8 phosphate buffer) by performing an extensive evaluation of dissolution conditions using our initial prototype formulation (F-1) that failed in our first pilot bioequivalence (BE) study. A subsequent BE study confirmed the theoretical polymer coating level needed to match the RLD performance. We utilized
pharmacokinetic data collected from the BE studies to establish an in vitro-in vivo relationship (IVIVR). The predictive dissolution method will be used for quality control of the final drug product.
Risk assessment was used throughout development to identify potentially high risk formulation and process variables and to determine which studies were necessary to increase our knowledge. Each risk assessment was then updated to capture the reduced the level of risk based on our improved product and process understanding.
As the IR granulation process has been previously established, this development report focuses on four key steps for ER bead and final tablet process development: 1) drug layering, 2) ER polymer coating, 3) blending and lubrication, and 4) compression. We selected a bottom spray fluid bed process for both drug layering and polymer coating of the ER beads. We utilized diffusive mixing for the final blend before compressing the blend into scored tablets. For each
unit operation, we conducted a risk assessment and then utilized DOE to investigate the identified high risk variables to determine the critical material attributes (CMAs) and critical process parameters (CPPs). An inline NIR method was validated and implemented to monitor blend uniformity and to reduce the risk associated with the blending step. Our process
optimization facilitated the creation of a design space at the pilot scale. A pivotal BE study conducted with the exhibit batch manufactured at pilot scale demonstrated equivalence between our product and the RLD.
Our first verification batch at commercial scale failed dissolution testing. Subsequent
investigation showed that film coat thickness increased on the beads manufactured at commercial scale versus beads manufactured at pilot scale due to a difference in process efficiency. A second verification batch was manufactured by decreasing the theoretical polymer coating level from 30% to 28 % to account for improved processing efficiency at commercial scale. The
formulation change resulted in drug product that met our predefined CQA targets.
We propose a control strategy that includes the input material attributes and process parameters identified as potentially high risk variables during the initial risk assessment. Our control strategy also includes in-process and finished product specifications. The process will be monitored during the lifecycle of the product and additional knowledge gained will be utilized to make adjustments to the control strategy as appropriate.
Table 1. Development of Example MR Tablets, 10 mg, presented in chronological order
Study Scale Page
Analysis of the Reference Listed Drug product N/A 7
Evaluation of drug substance properties N/A 28
Excipient compatibility N/A 33
Dissolution of IR granules compressed with placebo beads Lab
(1 kg) 42 Binder optimization and drug substance solid state stabilization (1 kg) Lab 46 Drug layering process development – feasibility and optimization
studies
Lab
(4 kg) 88 Dissolution of drug-layered beads compressed with placebo granules (1 kg) Lab 47 ER polymer coating formulation feasibility and optimization studies (1 kg) Lab 54 ER polymer coating process development – feasibility, screening and
optimization studies
Lab
(4 kg) 105
NIR method for blending endpoint determination N/A 122
Prototype tablet formulation studies – filler, disintegrant and
lubricant optimization (4, 10 kg) Lab 64
Development of formulation for first pilot BE study (prototype F-1) (4 kg) Lab 70
First pilot BE study using prototype F-1 N/A 17
Development of formulation for second pilot BE study (F-2 and F-3) Lab
(4 kg) 71 Second pilot BE study using prototypes F-2 and F-3 N/A 25 Development of a predictive dissolution method and IVIVR N/A 18 Drug layering process robustness study (40 kg) Pilot 96
ER polymer coating process robustness study Pilot
(40 kg) 115
ER bead curing process confirmation study N/A 118
Blending process study – segregation investigation and optimization
of process parameters (40 kg) Pilot 123
Tablet compression process development – optimization of process parameters
Pilot
(40 kg) 133
Pivotal bioequivalence study Exhibit
(40 kg) 26
Exhibit batch Exhibit (40 kg) 139
1.2 Analysis of the Reference Listed Drug Product
1.2.1 Clinical
The reference listed drug (RLD) is Brand MR Tablets, 10 mg, and is a modified release (MR) formulation composed of both an immediate release (IR) and an extended release (ER)
component. The RLD was approved in the United States in 2009 in NDA aaaaaa and is indicated for therapeutic relief. Tablets contain the active ingredient Z that acts through the CNS; however, its mechanism of action remains unknown. Brand MR Tablets, 10 mg, were developed based upon the corresponding IR formulation, Brand IR Tablets, 3 mg, approved in 2005 in NDA bbbbbb. The ANDA approval for Example IR Tablets (ANDA aaaaaa) was in 2010. Brand MR Tablets are designed for once-a-day dosing to provide both immediate onset of therapeutic relief similar to the IR product as well as maintenance of the therapeutic effect. The label-recommended dosing is 10 mg once daily in adults; however, this dose may be titrated to a maximum daily dose of 20 mg. The tablet is scored to allow for 5 mg dosing, particularly for elderly patients or patients with hepatic insufficiency who do not clear the drug as rapidly as normal. The label warns of the potential risk of dose dumping that may occur with the co-ingestion of alcohol.
1.2.2 Pharmacokinetics
Z is metabolized to the corresponding Z* inactive metabolite and has a half-life of approximately 5 hours. In the original Brand IR formulation, the short half-life of Z limits its ability to maintain a therapeutic effect, requiring multiple dosing every 8 hours. The Brand MR formulation was designed to overcome this limitation by releasing the drug in two phases: an IR phase followed by an ER phase. According to the product label, the IR phase achieves plasma concentrations comparable to the IR product (3 mg) through the first two hours for rapid onset of the therapeutic effect. The ER phase sustains plasma concentrations of the drug through 24 hours for
maintenance of the therapeutic effect. The product label indicates that the drug can be taken regardless of meals because there is no food effect. Based upon publically available information (under FOI) and applicable product literature, Figure 1 shows the PK profile of Brand MR.
0 50 100 150 200 250 300
0 4 8 12 16 20 24
Time (h)
Conc
e
n
tr
a
tion (ng/mL)
Figure 1. Plasma concentration of Brand MR Tablets, 10 mg, as a function of time
1.2.3 Drug Release
The drug release of the Brand MR Tablets was characterized using USP apparatus 2 at 50 rpm in 900 mL of various media including water, 0.1 N HCl, pH 4.5 phosphate buffer and pH 6.8 phosphate buffer as shown in Figure 2. The figure includes the drug release profiles for both whole and split tablets.
0 10 20 30 40 50 60 70 80 90 100
0 2 4 6 8 10 12 14 16 18 20 22 24 Time (h)
Dru
g
Rel
eas
ed
(
%
)
Half tablet, Water Half tablet, 0.1 N HCl Half tablet, pH 4.5 buffer Half tablet, pH 6.8 buffer Whole tablet, Water Whole tablet, 0.1 N HCl Whole tablet, pH 4.5 buffer Whole tablet, pH 6.8 buffer
Figure 2. Drug release profiles for Brand MR whole and split tablets using USP apparatus 2 at 50 rpm in 900 mL of media
The drug release profiles convey three critical characteristics of the RLD:
1. Biphasic in vitro drug release suggests that the Brand MR Tablet design contains both IR (30% of the nominal dose) and ER (70% of the nominal dose) components.
Primarily, the IR component provides the first plasma concentration peak shown in Figure 1 which is responsible for the initial onset of the effect. The ER component likely causes the second peak which provides the sustained release exposure to drug for maintenance of the effect.
2. Drug release occurs in a pH-independent manner.
3. Drug release characteristics of whole and split tablets are similar.
To provide a comparable release profile to the RLD, the target for drug release from Example MR Tablets, 10 mg, was based upon rapid release (NMT 30 minutes (min)) of the active
ingredient (30% of the nominal dose) followed by extended release (from 30 min to 24 hours (h)) of the remaining ER component (70% of the nominal dose). The initial dissolution method utilized USP apparatus 2 at 50 rpm in 900 mL of pH 6.8 phosphate buffer.
1.2.4 Physicochemical Characterization
The physicochemical characterization of Brand MR Tablets is summarized in Table 2. Notably, the disintegration observation and cross-sectional examination via optical microscopy and SEM (Figures 3a, 3b, and 3c) are indicative of the Brand MR Tablet being composed of intact beads (~0.45 mm) having 2-3 layers of polymer coating.
Table 2. Physicochemical characterization of Brand MR Tablets, 10 mg
Description White capsule-shaped tablet debossed with “XX” on one side of the break line and “234” on the other side
Batch No. A0420B
Expiry date June 2009
Strength (Label claim) Each scored tablet contains 10 mg of Z
Average weight (mg) 250.70
Score Yes, divides into two equal parts
Coating Uncoated
Length (mm) 10.97 – 11.02
Width (mm) 5.48 – 5.53
Thickness (mm) 5.73 – 5.77
Volume (mm3) 207.50 measured using image analysis
Hardness (kP) 10 – 12
Disintegration time 1 min 30 sec
Disintegration Observation Beads are observed after tablet disintegration
Optical microscopy Cross section of tablet reveals beads with a diameter of ~0.45 mm
SEM Intact beads with 2-3 layers of polymer coating
Assay, % w/w of labeled amount 100.2
b
c
Figure 3. Images of a Brand MR Tablet, 10 mg: (a and b) Cross section of tablet; (c) Cross section of bead showing 2-3 layers of polymer coating
1.2.5 Composition
Based on the RLD labeling, patent literature, product features and reverse engineering, Table 3 lists the composition of Brand MR Tablets, 10 mg. The level provided for each excipient is consistent with previous experience and the IIG level previously FDA-approved for oral solid dosage forms.
Table 3. Composition of Brand MR Tablets, 10 mg
Components Function (mg per tablet) Unit (% w/w) Unit
ER Coated Beads
Z Drug substance 7.0 2.8
Povidone (PVP) Binder 2-4 0.8-1.6 Ethyl Cellulose Coating polymer 3-5 1.2-2.0 Polyethylene Glycol (PEG) Plasticizer 0.2-0.8 0.08-0.3 Sugar Sphere Substrate 18-28 7.2-11.2
ER Coated Beads Subtotal 40 16.0
IR Granules and Final Blend (excluding beads)
Z Drug substance 3.0 1.2
Microcrystalline Cellulose (MCC) Filler 100-140 40.0-56.0 Lactose Monohydrate Filler 40-70 16.0-28.0 Sodium Starch Glycolate (SSG) Disintegrant 10-20 4.0-8.0 Magnesium Stearate Lubricant 1.5-3.5 0.6-1.4
Blend (excluding beads) Subtotal 210 84.0
Total tablet weight 250 100.0
1.3 Quality Target Product Profile for the ANDA Product
Note to Reader: The Quality Target Product Profile (QTPP) is “a prospective summary of the quality characteristics of a drug product that ideally will be achieved to ensure the desired quality, taking into account safety and efficacy of the drug product.”1The QTPP is an essential element of a QbD approach and forms the basis of design for the development of the product. For ANDAs, the target should be defined early in development based on the properties of the drug substance (DS), characterization of the RLD product and consideration of the RLD label and intended patient population. By beginning with the end in mind, the result of development is a robust formulation and manufacturing process with an acceptable control strategy that ensures the performance of the drug product.
A critical quality attribute (CQA) is “a physical, chemical, biological, or microbiological property or characteristic that should be within an appropriate limit, range, or distribution to ensure the desired product quality.”1 The identification of a CQA from the QTPP is based on the severity of harm to a patient should the product fall outside the acceptable range for that
attribute.
All quality attributes are target elements of the drug product and should be achieved through a good quality management system, appropriate formulation/process design and development. From the perspective of pharmaceutical development, we only investigate the subset of CQAs of the drug product that also have a high potential to be impacted by the formulation or process variables. Our investigation culminates in an appropriate control strategy.
Based on the clinical and pharmacokinetic characteristics of Brand MR Tablets given in the product label as well as the in vitro drug release and physicochemical characteristics of the branded drug, a QTPP was defined and justified as shown in Table 4 to guide the development of generic Example MR Tablets that are therapeutically equivalent to the RLD.
Table 4. Quality Target Product Profile (QTPP) for Example MR Tablets, 10 mg
QTPP Element Target Justification
Dosage form MR Tablet Pharmaceutical equivalence requirement: Same dosage form
Route of administration Oral Pharmaceutical equivalence requirement: Same route of administration
Dosage strength 10 mg Pharmaceutical equivalence requirement: Same strength
Pharmacokinetics
Fasting Study and Fed Study 90 % confidence interval of the PK parameters, AUC0-2, AUC 2-24, AUC0-∞ and Cmax, should fall
within bioequivalence limits
Bioequivalence requirement
Initial plasma concentration through the first two hours that provides a clinically significant therapeutic effect followed by a sustained plasma concentration that maintains the therapeutic effect
Stability At least 24-month shelf-life at room temperature Equivalent to or better than RLD shelf-life Physical Attributes
Identification Assay
Content Uniformity Degradation Products Residual Solvents Drug Release Microbial Limits Drug product quality
attributes
Water Content
Pharmaceutical equivalence requirement: Meeting the same compendial or other applicable (quality) standards (i.e., identity, assay, purity, and quality)
Container Closure System
Suitable container closure system to achieve the target shelf-life and to ensure tablet integrity during shipping.
HDPE bottles with Child Resistant (CR) Caps are selected based on similarity to the RLD packaging. No further special protection is needed due to the stability of drug substance Z. A scored tablet can be divided
into two 5 mg tablets. Administration/concurrence
with labeling The tablet can be taken without regard to food (no food effect).
Information is provided in the RLD labeling.
Alternative methods of
administration None None are listed in the RLD labeling.
Table 5 summarizes the quality attributes of Example MR Tablets and indicates which attributes were classified as drug product CQAs. For this product, physical attributes (size and splitability), assay, content uniformity (whole and split tablets) and drug release (whole tablets, split tablets and alcohol-induced dose dumping) are investigated and discussed in detail in subsequent formulation and process development studies.
On the other hand, CQAs including identity, degradation products and microbial limits which are unlikely to be impacted by formulation and process variables will not be discussed in detail in the pharmaceutical development report. However, these CQAs are still target elements of the QTPP and are ensured through the product and process design and the control strategy
Table 5. Critical Quality Attributes (CQAs) of Example MR Tablets, 10 mg Quality Attributes of the Drug
Product Target CQA? Is it a Justification
Appearance Color and shape acceptable to the patient. No visual
tablet defects observed. No
Color, shape and appearance are not directly linked to safety and efficacy. Therefore, they are not critical. . The target is set to ensure patient acceptability.
Odor No unpleasant odor No
In general, a noticeable odor is not directly linked to safety and efficacy, but odor can affect patient acceptability and lead to complaints. For this product, neither the drug substance nor the excipients have an unpleasant odor. No organic solvents will be used in the drug product manufacturing process.
Size Similar to RLD Yes
Tablet size correlates to swallowability; therefore, it is critical. For
comparable ease of swallowing as well as patient acceptance and compliance with treatment regimens, the target for tablet size and volume is set similar to the RLD.
Score and
Splitability Scored and can be split for half-dosing Yes The RLD tablet is scored and labeled for half-dosing; thus, ease of splitting is critical for this drug product design. Physical
Attributes
Friability (whole and split
tablets) Not more than 1.0% w/w No
A target of NMT 1.0% mean weight loss is set according to the compendial requirement and to minimize post-marketing complaints regarding tablet appearance. This target friability will not impact patient safety or efficacy. Identification Positive for drug substance Z Yes*
Though identification is critical for safety and efficacy, this CQA can be effectively controlled by the quality management system and will be monitored at drug product release. Formulation and process variables do not impact identity.
Assay
(whole and split tablets) 100.0% of label claim Yes Variability in assay will affect safety and efficacy; therefore, assay is critical. Whole tablets
Content
Uniformity Split tablets Conforms to USP <905> Uniformity of Dosage Units Yes Variability in content uniformity will affect safety and efficacy. Content uniformity of whole and split tablets is critical.
Degradation Products
Individual unknown degradation product: NMT 0.2%
Total degradation products: NMT 1.0%
Yes*
The limit of degradation products is critical to drug product safety. The limit for individual unknown degradation products complies with ICH Q3B. A limit for the total degradation products is set based on analysis of the RLD near expiry. The molecular structure of drug substance Z contains no functional groups with obvious sensitivities to oxidation, hydrolysis, acid, base, light or heat and its stability was confirmed in a forced degradation study. No chemical interactions were observed during the development of the IR tablet (ANDA aaaaaa, Section 3.2.P.2.1.2 and Section 3.2.P.8.3 (Appendix I)) or during the excipient compatibility studies performed as part of the
development of the MR tablet. Therefore, formulation and process variables are unlikely to impact this CQA.
Quality Attributes of the Drug
Product Target CQA? Is it a Justification
Residual Solvents Conforms to USP <467> Yes*
The drug substance and excipients used in the drug product formulation contain residual solvents. The limit is critical to drug product safety. However, no organic solvent is used in the drug product manufacturing process and the drug product complies with USP <467> Option 1. This CQA will not be discussed in the pharmaceutical development report but will be considered when setting the raw material acceptance criteria.
Whole tablets Similar drug release profile as RLD using a predictive dissolution method.
The drug release profile is important for bioavailability (BA) and
bioequivalence (BE); therefore, it is critical. Since in vitro drug release is a
surrogate for in vivo performance, a similar drug release profile to the RLD is
targeted to ensure bioequivalence. Split tablets Similar drug release to whole tablets: f2 > 50
For tablets containing a multi-particulate system, a non-uniform distribution of beads may cause different drug release profiles between whole and split tablets. Therefore, it is critical and the target is set in accordance with regulatory guidance.
Drug Release
Alcohol-induced dose dumping
Comparable or lower drug release compared to the RLD in 5% (v/v), 20% (v/v), and 40% (v/v) Alcohol USP in 0.1 N HCl dissolution medium
Yes
The drug release profile in alcohol is critical to patient safety. The target is set to ensure that alcohol stress conditions do not alter bioavailability of the generic product and introduce additional risks to the patient.
Water Content Not more than 2.0% w/w No Limited amounts of water in oral solid dosage forms will not impact patient safety or efficacy. Therefore, it is not critical.
Microbial Limits Meets relevant pharmacopoeia criteria Yes*
Non-compliance with microbial limits will impact patient safety. However, as long as raw materials comply with compendial microbial requirements, the formulation and process variables are unlikely to impact this CQA. Water activity will be tested on the final prototype formulation to confirm that the drug product does not support microbial growth.
*Formulation and process variables are unlikely to impact the CQA. Therefore, the CQA will not be investigated and discussed in detail in subsequent risk assessments and pharmaceutical development. However, the CQA remains a target element of the QTPP and is ensured through the product and process design and the control strategy.
Note to Reader: In order for accurate measurement of the product attributes at in-process and finished product stages, the analytical methodology should be evaluated for its capability of producing test data that are closely representative of the true attributes. Before a formulation or manufacturing process is studied for a given product, the analytical method should be assessed to determine the degree of variability in the test data imparted by the analytical method itself versus the degree of variability inherent to the product.
One such approach to conduct measurement system analysis is to use ANOVA-based statistical methods designed for this purpose. This allows quantitative discernment between different sources of variability including, but not limited to, the instrument, the operator and the sample. Analysis of the measurement system and assurance of its capability to produce representative data are even more important when changes in the values of the product attributes are studied as responses to controlled changes in the formulation and the process parameters in a design of experiments (DOE).
1.4 Dissolution Method Development and Bioequivalence Studies
It was important to understand the relationship between in vitro drug release and in vivo
performance in order to 1) evaluate the impact of formulation and process variable changes on drug product quality during development; 2) predict the performance of the commercial batches based on the BE data from the exhibit batch manufactured at the pilot scale, and 3) facilitate the evaluation of post-approval changes. Therefore, we decided to develop a predictive dissolution method and establish an in vitro-in vivo relationship (IVIVR) between in vitro drug release and in vivo
performance of the drug product. A predictive dissolution method should be able to predict in vivo performance of the drug product reasonably well and also discriminate between the formulations that perform differently.
The first prototype formulation F-1 (described in Section 2.2.1.4) contained the drug-layered beads coated with 25% theoretical polymer. A pilot BE study was conducted using prototype F-1. The study was a randomized single dose two-way crossover study comparing the prototype to the RLD in 12 healthy subjects. Table 6 shows the geometric mean ratios of pharmacokinetic parameters for prototype F-1 relative to the RLD.
Table 6. Summary of PK parameters from BE study comparing prototype F-1 to the RLD Prototype/RLD Ratio
AUC0-2 AUC2-24 AUC0-∞ Cmax
Prototype F-1 1.1 1.21 1.10 1.32
The plasma drug concentration obtained for prototype F-1 and the RLD are compared in Figure 4.
0 50 100 150 200 250 300 350
0 2 4 6 8 10 12 14 16 18 20 22 24 Time (h)
Conc
e
n
tr
a
tion (ng/mL)
Prototype F-1 RLD
The RLD provided a biphasic profile representing the IR and ER portions of the formulation which was not observed for prototype F-1. The data suggested the need to slow the release rate from the ER coated beads in the prototype formulation in order to achieve bioequivalence to the RLD. Therefore, prototype F-1 was used to develop a predictive dissolution method.
1.4.1 Development of a Predictive Dissolution Method
The effects of dissolution medium pH, stirring speed or number of dips per minute (dpm) as applicable, and dissolution medium volume were systemically evaluated to develop the predictive dissolution method. The effect of ionic strength of the dissolution medium was considered but not evaluated because a predictive method could be developed using a standard USP buffer.
USP Apparatus 2 (Paddle)
An initial attempt at developing the discriminating dissolution method that would be predictive of in vivo performance was made using USP apparatus 2 because the RLD was extensively characterized as shown in Figure 2 using this apparatus early in the formulation development.
Effect of dissolution medium pH
Both prototype F-1 and the RLD were subjected to dissolution testing using USP apparatus 2 at 50 rpm in 900 mL of various media including water, 0.1 N HCl, pH 4.5 phosphate buffer, and pH 6.8 phosphate buffer. The drug release profiles obtained showed that in vitro drug release of prototype F-1 matched that of the RLD as shown in Figure 5.
0 10 20 30 40 50 60 70 80 90 100
0 2 4 6 8 10 12 14 16 18 20 22 24 Time (h)
Drug Rel
e
a
s
ed (%)
Prototype F-1, Water Prototype F-1, 0.1 N HCl Prototype F-1, pH 4.5 buffer Prototype F-1, pH 6.8 buffer RLD, Water
RLD, 0.1 N HCl RLD, pH 4.5 buffer RLD, pH 6.8 buffer
Figure 5. Comparative in vitro release characteristics of the prototype formulation (F-1) and the RLD using USP apparatus 2 at 50 rpm in 900 mL of various media
The drug release profile of prototype F-1 shows pH-independence similar to the RLD. This is not surprising considering that the drug substance is highly soluble (BCS Class I) and the ER polymer impacts drug release through a pH-independent mechanism. These results indicated that dissolution testing using USP apparatus 2 may not be predictive because prototype F-1 did not exhibit
bioequivalence to the RLD when dosed in healthy human volunteers despite giving almost identical drug release profiles under various pH conditions. Therefore, the effect of pH was not studied further during the development of a predictive dissolution method. The pH 6.8 phosphate buffer was selected as the dissolution medium since this medium is often used for modified release drug products.
Effect of dissolution medium volume
The drug release of prototype F-1 was evaluated using pH 6.8 phosphate buffer volumes of 900 mL, 500 mL and 250 mL. The stirring speed was 50 rpm in each case. Identical drug release profiles were obtained in all three volumes as is evident in Figure 6. The high solubility of drug substance Z provides sink condition in great excess even at 250 mL. Therefore, changing the dissolution
medium volume does not improve the predictive power of the dissolution test using USP apparatus 2.
0 10 20 30 40 50 60 70 80 90 100
0 2 4 6 8 10 12 14 16 18 20 22 24 Time (h)
Dru
g
Rel
eas
ed
(
%
)
900 mL 500 mL 250 mL
Figure 6. Comparative in vitro release characteristics of the prototype formulation (F-1) using USP apparatus 2 at 50 rpm in 900, 500 and 250 mL of dissolution medium
Effect of stirring speed
The drug release of prototype F-1 was also evaluated at 25 rpm in 900 mL of pH 6.8 phosphate buffer. Severe coning at the bottom of the vessel was observed during dissolution testing. This observation was reflected in extremely variable drug release profiles as shown in Figure 7. Therefore, 25 rpm could not be used as the stirring speed. A higher stirring speed (> 50 rpm) was not explored because 50 rpm itself failed to discriminate formulation F-1 and the RLD as shown earlier in Figure 5.
0 10 20 30 40 50 60 70 80 90 100
0 2 4 6 8 10 12 14 16 18 20 22 24 Time (h)
Dru
g
Rel
eas
ed
(
%
)
50 RPM 25 RPM
Figure 7. Comparative in vitro release characteristics of the prototype formulation (F-1) using USP apparatus 2 at 25 and 50 rpm in 900 mL of dissolution medium
Based on the extensive evaluation of USP apparatus 2, it was concluded that this apparatus does not provide predictive conditions for evaluation of in vivo performance of the drug product.
The evaluation of USP apparatus 1 and 3 was limited to stirring speed and the number of dips per minute, respectively. The pH and dissolution medium volume do not provide predictive conditions based on the results obtained during evaluation of USP apparatus 2.
USP Apparatus 1 (Basket)
Dissolution testing of both prototype F-1 and the RLD was conducted at 50, 75, and 100 rpm in 900 mL of pH 6.8 phosphate buffer. Severe coning was observed at 50 and 75 rpm resulting in
extremely variable and incomplete drug release profiles after 24 hours for both prototype F-1 and the RLD as shown in Figure 8. At 100 rpm, the drug release profiles of both formulations were still incomplete after 24 hours but had similarly low variability. The results indicate that USP apparatus 1 does not provide discriminating conditions.
0 10 20 30 40 50 60 70 80 90 100
0 2 4 6 8 10 12 14 16 18 20 22 24 Time (h)
Dru
g
Rel
eas
ed
(
%
)
Prototype F-1, 100 RPM Prototype F-1, 75 RPM Prototype F-1, 50 RPM RLD, 100 RPM
RLD, 75 RPM RLD, 50 RPM
Figure 8. Comparative in vitro release characteristics of the prototype formulation (F-1) and the RLD using USP apparatus 1 at 100, 75 and 50 rpm in 900 mL of dissolution medium
USP Apparatus 3 (Reciprocating Cylinder)
The evaluation of USP apparatus 3 was limited to the number of dips per minute. Dissolution testing on both prototype F-1 and the RLD was conducted at 5 and 10 dpm in 250 mL of pH 6.8 phosphate buffer. Figure 9 shows the drug release profiles.
0 10 20 30 40 50 60 70 80 90 100
0 2 4 6 8 10 12 14 16 18 20 22 24 Time (h)
Dru
g
Rel
eas
ed
(
%
)
RLD, 10 dpm RLD, 5 dpm
Prototype F-1, 10 dpm Prototype F-1, 5 dpm
Figure 9. Comparative in vitro release characteristics of the prototype formulation (F-1) and the RLD using USP apparatus 3 at 5 and 10 dpm in 250 mL of dissolution medium
Based on these results, discriminating dissolution conditions were obtained at 5 and 10 dpm using USP apparatus 3. The next step was to evaluate if either of these conditions could reasonably predict the in vivo performance of the drug product.
1.4.2 Establishment of the IVIVR
The PK profile of prototype F-1 was deconvoluted to obtain the fraction of in vivo drug release. The fraction of in vivo drug release was plotted against the fraction of in vitro drug release using USP apparatus 3 at 5 and 10 dpm. Figures 10 and 11 show the IVIVR obtained at 5 and 10 dpm, respectively.
0 0.1 0.2 0.3 0.4 0.5 0.6 0.7 0.8 0.9 1
0 0.2 0.4 0.6 0.8 1
Fraction Released In Vitro
F
ract
io
n
Re
lea
sed
In Vivo
Figure 10. IVIVR using USP apparatus 3 at 5 dpm and the prototype formulation (F-1)
Figure 10 clearly indicates that the dissolution testing at 5 dpm under predicts in vivo performance of prototype F-1. The fraction of drug released in vitro is consistently lower than the fraction of drug released in vivo indicating over-discriminating dissolution conditions. The coefficient of determination (R2) value of 0.65 also indicates poor predictive capability of the relationship. Similar results were obtained for the RLD formulation (R2 = 0.55, data not shown).
Figure 11 gives a reasonably good relationship between the fractions of in vivo and in vitro drug release at 10 dpm with an R2 value of 0.85.
Relationship established using Prototype F-1: y = 1.1114x - 0.1382
0 0.1 0.2 0.3 0.4 0.5 0.6 0.7 0.8 0.9 1
0 0.2 0.4 0.6 0.8 1
Fraction Released In Vitro
F
ract
io
n
Re
lea
sed
In Vivo
Figure 11. IVIVR using USP apparatus 3 at 10 dpm and the prototype formulation (F-1)
This relationship could be used to predict the in vivo performance of both the prototype and RLD formulations with prediction errors of approximately 10% for PK parameters such as Cmax, AUC0-2,
AUC2-24 and AUC0-∞. Based on the results of the failed BE study using prototype F-1, the predictive
dissolution method using USP apparatus 3 at 10 dpm in 250 mL of pH 6.8 phosphate buffer was developed and the IVIVR was established.
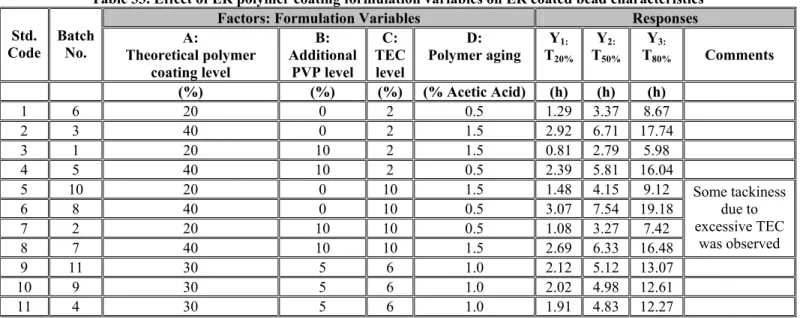
The drug release profiles for all of the batches from the ER polymer coating development work (Batch No. 1-12) were reevaluated using the new dissolution method. It was observed that the T20%,
T50% and T80% values of prototype F-1 were considerably shorter when measured by the new
dissolution method. Therefore, the formulation needed an adjustment in the theoretical polymer coating level to achieve the optimal release profile. Formulation of the ER coated beads was further modified to develop two new prototypes, F-2 and F-3, as described in Formulation Development 2.2.1.4. Prototypes F-2 and F-3 contained ER beads coated with 30% and 35% polymer levels, respectively.
In vitro drug release profiles were generated for prototypes F-2 and F-3 using the predictive USP apparatus 3 dissolution method and compared against the original non-discriminating USP apparatus 2 method in Figure 12. The increase in the theoretical polymer coating level from 25% (F-1) to 30% (F-2) led to a formulation exhibiting a drug release profile which was similar to the RLD drug release profile using USP apparatus 3. However, 35% theoretical polymer coating (F-3) showed a slower drug release profile.
0 10 20 30 40 50 60 70 80 90 100
0 2 4 6 8 10 12 14 16 18 20 22 24 Time (h)
Drug Rel
e
as
ed (%) Prototype F-1Prototype F-2
Prototype F-3 RLD
0 10 20 30 40 50 60 70 80 90 100
0 2 4 6 8 10 12 14 16 18 20 22 24 Time (h)
Drug Rel
e
as
ed (%) Prototype F-1
Prototype F-2 Prototype F-3 RLD
USP Apparatus 3 at 10 dpm in 250 mL of pH 6.8 phosphate buffer
USP Apparatus 2 at 50 rpm in 900 mL of pH 6.8 phosphate buffer
Figure 12. Comparative in vitro release characteristics of the prototype formulations (F-1, F-2 and F-3) and the RLD using the predictive method (top) and non-predictive method (bottom)
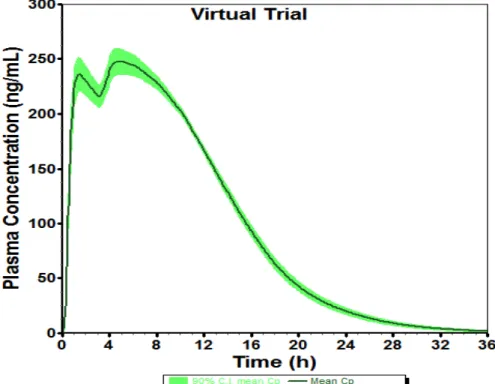
The drug release data of prototypes F-2 and F-3 were convoluted using the established IVIVR (y = 1.1114x - 0.1382) to predict mean plasma concentration-time profiles. Virtual trial simulations were conducted to assess the variability of the PK parameters before undertaking a second BE study. For virtual trial simulations, distributions for each parameter were pre-defined for previously fixed model parameters. In each simulation, a random number was generated from the pre-defined distribution and used as the model parameter. Thus, the in vivo performance of F-2 and F-3 were assessed in a virtual population. The mean plasma concentration-time profile and the 90% CI of mean plasma concentration for prototype F-2 are presented in Figure 13. These virtual simulation trials provided confidence that prototype F-2 had a strong likelihood of being equivalent to the RLD.
Figure 13. Predictive virtual trial generated using the test formulation (F-2) drug release data
A second pilot BE study was conducted comparing prototypes F-2 and F-3 to the RLD. The study consisted of a randomized single dose three-way crossover study in 12 healthy subjects. Table 7 shows the geometric mean ratios of pharmacokinetic parameters for prototypes F-1, F-2 and F-3 relevant to the RLD. While the Cmax ratio for prototypes F-1 and F-3 did not meet the
bioequivalence limit (0.8-1.25), all ratios were acceptable for prototype F-2.
Table 7. Summary of PK parameters from BE studies comparing the prototype formulations to the RLD Prototype/RLD Ratio
AUC0-2 AUC2-24 AUC0-∞ Cmax
Prototype F-1 1.1 1.21 1.10 1.32
Prototype F-2 0.97 0.98 0.96 1.03
Prototype F-3 0.81 0.95 0.95 0.75
A comparison of plasma concentration profiles for the RLD and the two prototypes, F-2 and F-3, is presented in Figure 14.
0 50 100 150 200 250 300
0 2 4 6 8 10 12 14 16 18 20 22 24 Time (h)
Conc
e
n
tr
a
tion (ng/mL)
Prototype F-2 Prototype F-3 RLD
Figure 14. Comparison of plasma drug concentrations after oral administration of the prototype test formulations (F-2 and F-3) and the RLD
A final IVIVR was built ( y = 1.1131x – 0.1242, R2 = 0.87) using PK data obtained for the three prototypes F-1, F-2, and F-3 used in the two BE studies and the in vitro drug release data obtained using the predictive dissolution method. This final IVIVR could be used to perform convolution of the in vitro data for the prototypes and RLD formulations. This IVIVR could also predict the failed study outcome from the drug release data obtained for prototypes F-1 and F-3 using USP apparatus 3. In addition, this IVIVR can be used to establish the linkage between exhibit and commercial batches.
1.4.3 Pivotal Bioequivalence Study
Note to Reader: Several options are available to ensure that drug product lots manufactured at both the pilot and commercial scale (scaled-up batches) are bioequivalent to the RLD. A discussion of each option follows:
1. In Vivo – In Vitro Correlation (IVIVC)
Establishment of an IVIVC is one of the more robust options to assure continued BE of the commercial lots. It establishes a control for post-approval changes to the critical material
attributes (CMAs) and critical process parameters (CPPs) and ensures continued product quality and BE. However, IVIVC is difficult to establish.
2. Predictive in vitro method (In Vivo – In Vitro Relationship (IVIVR))
A product designed and developed using QbD principles should lead to the establishment of a predictive in vitro dissolution method. Establishing an IVIVR, although less robust than an IVIVC, may be sufficient to assure product quality when combined with product and process
understanding. Such an in vitro method will also be useful in assessing post-approval changes. 3. Bioequivalence study of commercial scale batches
It is well recognized that an ER product developed at pivotal batch scale may not always scale-up to commercial scale and yield a drug product that is BE to the RLD. Both fed and fasting
bioequivalence studies may be necessary to assure that the commercial batches are BE to the RLD. It is also expected that the risk assessment of a product developed on QbD principles will identify all the CMAs and CPPs and include adequate controls; one of these controls will be a
discriminating in vitro method. While the bioequivalence study of commercial batches will assure BE of the drug product, a discriminating in vitro method will assure product quality through its life-cycle (post-approval changes).
From the product and process understanding gained throughout pharmaceutical development and the established IVIVR, an exhibit batch based on the formulation of prototype F-2 (Batch No. ZAb041911) was manufactured and used for a randomized single dose two-way crossover pivotal
fasting BE study conducted in 36 healthy subjects. The exhibit batch was found to be bioequivalent to the RLD. The 90% confidence interval meets the bioequivalence limit of 80-125% for Cmax,
AUC0-2, AUC2-24, and AUC0-∞, as shown in Table 8. Figure 15 shows the plasma concentration
profiles under fasting conditions. A fed bioequivalence study was also conducted and passed (data not shown). Similar to the RLD, the proposed generic drug product showed no food effect on pharmacokinetic parameters.
Table 8. Pivotal Fasting BE Study No. 1234 Example MR Tablets Batch No. ZAb041911
Drug Substance: Z Dose: 10 mg
Test RLD Test/RLD
Parameter Least Squares Geometric Mean (LSGM) LSGM Ratio 90% Confidence Interval
AUC0-2 332.40 329.31 1.02 94-108
AUC2-24 3308.88 3340.12 0.98 92-105
AUC0-∞ 3316.86 3345.88 1.01 96-107
Cmax 238.86 243.92 0.96 88-105
0 50 100 150 200 250
0 2 4 6 8 10 12 14 16 18 20 22 24 Time (h)
Conc
e
n
tr
a
tion (ng/mL)
Test - Fasted RLD - Fasted
Figure 15. Plasma drug concentration of the test product versus the RLD
2.1 Components of Drug Product
2.1.1 Drug Substance
2.1.1.1 Physical Properties
Physical description:Appearance: white to off white crystalline powder Particle Morphology: irregular shaped crystals
Particle Size (ranges based on ten batches of drug substance used in Example IR Tablets; measured by Malvern Insitec X):
d10 - Observed 3-8 µm
d50 - Observed 20-25 µm
d90 - Observed 32-38 µm Solid State Form:
Z is the free form (i.e. not a salt form) of the drug substance.
There is only one known crystalline form of Z. Supporting XRD and DSC data were submitted in ANDA aaaaaa (Appendix I). To date, no other crystalline forms have been identified in the literature. This is substantiated by a broad range of crystallization experiments using solvents of varying polarity at several temperatures each.
Drug substance Z can also exist as an amorphous form. Conditions that introduce mechanical stress and mimic the manufacture of oral solid dosage forms (e.g., during granulation, drying, and
compression) were evaluated to determine if a form change of Z was induced. During the manufacture of Example IR Tablets, the crystalline form remains the same.
The physical stability of both the crystalline and amorphous form of Z under stress conditions is discussed further in 2.1.1.2 Chemical Properties.
Melting point: 246-251 °C
Aqueous solubility as a function of pH:
The aqueous solubility of the crystalline form of Z is high and constant across physiological pH as shown in Table 9 and Figure 16. The solubility and permeable nature of Z are consistent with BCS Class I compounds. The solubility of the amorphous form is approximately 10-fold that of the crystalline form.
Table 9. pH solubility profile of Z (crystalline)
pH Solubility of Z Medium
(mg/mL)
1.2-1.4 124.0 0.1 N Hydrochloric Acid 4.5 124.0 Sodium Acetate buffer 6.8 124.0 Phosphate buffer 7.5 123.7 Phosphate buffer
120 121 122 123 124 125
0 2 4 6 8
pH
S
o
lubility
(mg/mL)
Figure 16. Aqueous solubility of drug substance Z as a function of pH
Hygroscopicity:not hygroscopic
Density (Bulk, Tapped, and True) and Flowability: ~0.22 g/cc (bulk), ~0.41 g/cc (tapped), and ~0.68 g/cc (true). The angle of repose is 75 degrees and the compressibility index is 46 suggesting very poor flow properties. The particle size distribution of the batch used for density measurements was as follows: d10 - 5 µm; d50 - 20 µm; d90 - 35 µm.
2.1.1.2 Chemical Properties
pKa:7.0Chemical stability in solid state (crystalline & amorphous) and in solution:
Stress testing of drug substance Z was conducted to gain insight into the intrinsic stability of the molecule, to identify any likely degradation products, and to facilitate the development of a stability-indicating analytical method. A more comprehensive overview of the forced degradation studies of Z is located in ANDA aaaaaa, Section 3.2.S.4.3 (Appendix I). Table 10 summarizes the results of the stress testing.
Table 10. Stability of drug substance Z under stress conditions
Stress Conditions Assay Impurities Solid State Form
(% w/w) (% w/w)
Untreated 99.6 ND Crystalline
In Solution
1% solution (Purified Water, RT, 14 days) 99.3 ND N/A Acid (0.1% solution, 1.0 N HCl, RT, 14 days) 99.5 ND N/A
Base (0.1% solution, 1.0 N NaOH, RT, 14 days) 99.2 ND N/A Peroxide (0.1% solution, 3% H2O2, RT, 7 days) 99.1 ND N/A Crystalline Material
Humidity and heat (open container, 90% RH, 40 °C, 7 days) 99.6 ND Crystalline Dry heat (105 °C, 96 hrs) 99.5 ND Crystalline Photostability according to ICH Q1B Option 1 99.6 ND Crystalline
Amorphous Material
Humidity and heat (open container, 90% RH, 25 °C, 7 days) 99.5 ND Amorphous Humidity and heat (open container, 90% RH, 40 °C, 7 days) 99.5 ND Crystallization observed Humidity and heat (open container, 90% RH, 60 °C, 7 days) 99.3 ND Crystallization observed Photostability according to ICH Q1B Option 1 99.6 ND Amorphous Dry heat (105 °C, 96 hrs) 99.4 ND Amorphous
Overall, Z is chemically stable and insensitive to light, oxidation, and heat. A 1% solution was stable at room temperature for two weeks. The amorphous form of Z crystallizes under combined conditions of high humidity and temperature greater than 40 ºC. No degradation products were identified. These results concur with information provided by the DMF holder.
2.1.1.3 Biological Properties
Partition Coefficient: log P 0.5 (25 °C, pH 6.8)
2.1.1.4 Risk Assessment of Drug Substance Attributes
A risk assessment of the drug substance attributes was performed to evaluate the impact that each attribute could have on the drug product CQAs. The outcome of the assessment and the
accompanying justification is provided as a summary in the pharmaceutical development report. The relative risk that each drug substance attribute presents was ranked as high, medium, or low. Those attributes that could have a high impact on the drug product CQAs warranted further investigation whereas those attributes that had low impact on the drug product CQAs required no further investigation. The same relative risk ranking system was used throughout the pharmaceutical development and is summarized in Table 11. For each risk assessment performed, the rationale for the risk assessment tool selection and the details of the risk identification, analysis, and evaluation are available to the FDA Reviewer upon request.
Table 11. Overview of relative risk ranking system
Low Broadly acceptable risk. No further investigation is needed.
Medium Risk is accepted. Further investigation may be needed in order to reduce the risk. High Risk is unacceptable. Further investigation is needed to reduce the risk.
Note to Reader: According to ICH Q9 Quality Risk Management, it is important to note that “it is neither always appropriate nor always necessary to use a formal risk management process (using recognized tools and/or internal procedures e.g. standard operating procedures). The use of
informal risk management processes (using empirical tools and/or internal procedures) can also be considered acceptable. Appropriate use of quality risk management can facilitate but does not obviate industry’s obligation to comply with regulatory requirements and does not replace appropriate communications between industry and regulators.”
The two primary principles that should be considered when implementing quality risk management: • The evaluation of the risk to quality should be based on scientific knowledge and ultimately
link to the protection of the patient; and
• The level of effort, formality and documentation of the quality risk management process should be commensurate with the level of risk.
Risk assessment of the drug substance attributes on the drug product CQAs is presented in Table 12 and Table 13 provides the justification for the level of risk that was assigned to each attribute. Both solid state form and solubility were identified as high risks and need to be further investigated.
Table 12. Risk assessment of the drug substance attributes Drug Substance Attributes Drug Product
CQAs Solid State Form Particle Size/Bulk Density Hygroscopicity Solubility Residual Solvents Impurities Process Chemical Stability Physical Attributes
(size and splitability) Low Low Low Low Low Low Low
Assay Low Low Low Low Low Low Low
Content Uniformity Low Low Low Low Low Low Low
Drug Release High Low Low High Low Low Low
Table 13. Justification for the risk assessment of the drug substance attributes
Drug Substance Attributes Drug Product CQAs Justification
Physical Attributes (size and splitability) Assay
Content Uniformity
Solid state form does not affect tablet physical attributes (size and splitability), assay or content uniformity (CU).
Solid State Form
Drug Release
Example IR Tablets contain crystalline drug substance Z and no solid state form transformation occurs during manufacture. However, the drug substance may convert to its amorphous state during the drug layering process used to manufacture Example MR Tablets. This transformation may impact drug release. Furthermore, if Example MR Tablets contain amorphous drug substance that crystallizes during storage of the finished product, the drug release profile may change. The risk of solid state form to impact drug release from the tablets is high.
Physical Attributes (size and splitability) Assay
Content Uniformity Particle Size/Bulk Density
Drug Release
As discussed in ANDA aaaaaa, drug substance Z has poor flow characteristics. Particle size distribution (PSD) was optimized (d10:
1-10 µm; d50: 10-30 µm; d90: 25-50 µm) during the IR granulation
development. The risk of starting PSD and bulk density to impact the IR granules is low.
The drug substance Z is dissolved in the drug layering solution used to manufacture the drug-layered beads. The risk of starting PSD and bulk density to impact the ER coated beads is low.
Therefore, the risk of PSD or bulk density to impact the drug product CQAs is also low.
Physical Attributes (size and splitability) Assay
Content Uniformity Hygroscopicity
Drug Release
Because the drug substance is not hygroscopic, the risk of sorbed water to impact tablet physical attributes (size and splitability), assay, CU or drug release is low.
Physical Attributes (size and splitability) Assay
Content Uniformity
Drug substance solubility has no impact on tablet physical attributes (size and splitability), assay, or CU. The risk is low.
Solubility
Drug Release
Drug substance Z has a high intrinsic dissolution rate and a high solubility. It may migrate into the ER polymer film and potentially impact the drug release profile. The risk is high.
Drug Substance Attributes Drug Product CQAs Justification Physical Attributes
(size and splitability) Assay
Content Uniformity Residual Solvents
Drug Release
The residual solvents in the drug substance are well below the ICH Q3C levels (based on ten commercial batches). As such, the risk of drug substance residual solvents to impact the drug product CQAs is low.
Physical Attributes (size and splitability) Assay
Content Uniformity Process Impurities
Drug Release
The drug substance supplied by the vendor is consistently pure with total impurities < 0.05% (based on ten commercial batches). The risk of process impurities in drug substance Z to impact the drug product CQAs is low.
Physical Attributes (size and splitability) Assay
Content Uniformity Chemical Stability
Drug Release
Both crystalline and amorphous forms of the drug substance are stable both in the solid state and in solution. The risk of the drug substance chemical stability to impact the drug product CQAs is low.
2.1.2 Excipients
The choice of excipients for the formulation of Example MR Tablets, 10 mg, was based on the intent to combine the IR granules used in Example IR Tablets, 3 mg, (ANDA aaaaaa) with ER coated beads to provide a drug product with an extended release profile of Z.
2.1.2.1 Excipients in the IR Granules
Excipients used in the IR portion of the formulation for Example MR Tablets are the same as the excipients used in the formulation for Z granules in ANDA aaaaaa (Appendix I). The drug substance Z was demonstrated to be compatible with MCC, lactose, PVP,sodium starch glycolate
(SSG), and magnesium stearate. Table 14 lists the excipients used in the IR portion of Example MR Tablets.
Table 14. Composition of the IR portion of Example MR Tablets, 10 mg
Components Function Compendial Reference mg per tablet % w/w
IR Granules
Z Drug substance In-house 3.00 4.8
Microcrystalline Cellulose (MCC), Grade 200 Filler NF 32.62 52.2 Lactose Monohydrate Filler NF 21.88 35.0 Povidone (PVP), K30 Binder USP 2.50 4.0 Sodium Starch Glycolate (SSG), Type A Disintegrant NF 2.50 4.0
Purified Water Solvent USP --
No additional formulation work for the IR granules was performed during development of Example MR Tablets. The excipient compatibility studies performed in ANDA aaaaaa have been reproduced below for ease of review.
The excipient compatibility was assessed through HPLC analysis of binary mixtures of excipient and drug substance Z at a 1:1 ratio in the solid state except for the lubricants where the ratio was 1:10. Samples were stored at 25 °C/60 % RH and 40 °C/75 % RH in both open and closed
containers for 1 month. Common excipients functioning as fillers, disintegrants, and lubricants were evaluated in the excipient compatibility study. Table 15 summarizes the results for the samples stored at the most aggressive condition (40 °C/75 % RH, open container).
Table 15. Excipient compatibility (Binary Mixtures) Binary Mixture
Condition: 40 °C/75 % RH, open container, 1 month
Assay (% w/w)
Degradants (% w/w)
Lactose Monohydrate/DS (1:1) 99.6 ND Microcrystalline Cellulose (MCC), Grade 200/DS (1:1) 99.2 ND Dibasic calcium phosphate/DS (1:1) 100.2 ND
Mannitol/DS (1:1) 99.8 ND
Povidone (PVP), K30/DS (1:1) 99.6 ND HPMC 2910 6 cP/DS (1:1) 100.4 ND
HPC-EF/DS (1:1) 100.1 ND
Pregelatinized Starch/DS (1:1) 99.1 ND Croscarmellose Sodium/DS (1:1) 100.5 ND Crospovidone/DS (1:1) 99.2 ND Sodium starch glycolate (SSG), Type A/DS (1:1) 99.1 ND
Talc/DS (1:10) 99.7 ND
Magnesium Stearate/DS (1:10) 100.1 ND
No loss of assay was observed in any of the binary mixtures at 40 °C/75% RH in open containers. In addition, no degradants were observed indicating that the excipients investigated were
compatible with the drug substance in the respective binary mixtures.
An additional study was conducted to investigate the potential for drug degradation due to
interaction between several excipients and the drug. In this experiment, several different mixtures of drug and excipients were prepared. The first mixture consisted of drug and all excipients in the ratio representative of the proposed finished product formulation. In subsequent sets, one excipient was removed at a time. These mixtures were stored at 25 °C/60 % RH and 40 °C/75 % RH in both open and closed containers for 1 month. The results of the study are presented in Table 16.
Table 16. Excipient compatibility (Interaction Study) Mixture
Condition: 40 °C/75 % RH, open container, 1 month (% w/w) Assay Degradants (% w/w)
All excipients 99.8 ND
All excipients except Lactose Monohydrate 99.6 ND All excipients except Microcrystalline Cellulose (MCC), Grade 200 100.3 ND All excipients except Povidone (PVP), K30 100.2 ND All excipients except Sodium Starch Glycolate (SSG), Type A 100.8 ND All excipients except Talc 99.9 ND All excipients except Magnesium Stearate 100.5 ND
The results indicate that there are no interactions between the excipients and the drug substance that can cause drug degradation.
2.1.2.2 Excipients in the ER Coated Beads
The ER coated beads consist of a substrate for drug layering, binder, ER polymer, plasticizer and an anti-tacking agent as listed in Table 17.
Table 17. Composition of the ER portion of Example MR Tablets, 10 mg
Components Function Compendial Reference mg per tablet % w/w Comments
ER Beads
Z Drug substance In-house 7.00 18.6
Microcrystalline Cellulose
(MCC) Beads Substrate NF 19.98 53.0
Povidone (PVP), K30 Binder USP 1.24 3.3
Purified Water Solvent USP -- -- Evaporates during processing
Drug-layered Beads Subtotal 28.22 74.9
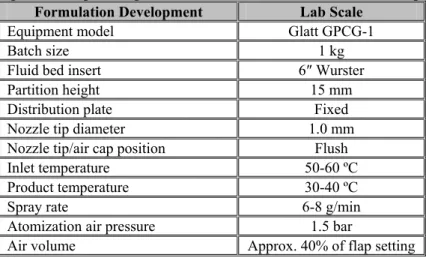
Kollicoat SR 30 D* Coating polymer NF 7.90 20.9 28% theoretical polymer coating based on drug-layered bead weight Triethyl Citrate (TEC) Plasticizer NF 0.40 1.1 5% of dry polymer Talc Anti-tacking agent USP 1.19 3.2 15% of dry polymer Purified Water Solvent USP -- -- Evaporates during processing
ER Polymer Coating Subtotal 9.49 25.2
ER Coated Beads Subtotal 37.71 ≈ 100.0
*Kollicoat SR 30 D contains 27% Polyvinyl Acetate (PVAc), 2.7% Povidone (PVP) and 0.3% Sodium Lauryl Sulfate (SLS) as per vendor’s product technical data sheet.
Povidone (PVP) K30 was selected as the binder because it was used as such in the IR tablets described in ANDA aaaaaa. Likewise, as microcrystalline cellulose (MCC) was used as the filler in the IR tablet, MCC beads were chosen as the substrate for drug layering. The compatibility of PVP and MCC with crystalline drug substance Z was demonstrated during the formulation of the IR
tablet. However, further testing was conducted to demonstrate the compatibility of these excipients with the amorphous form of drug substance Z resulting from the drug layering process.
Drug substance Z and PVP were dissolved in water at the target drug concentrations. The MCC beads were crushed using a mortar and pestle and added to the drug/PVP solution to form a suspension. An aliquot of this suspension was allowed to air dry. Drug substance (control) and the dried residue from the drug substance/PVP/MCC suspension were exposed to 40 °C/75% RH for 4 weeks. Drug substance stability was monitored using HPLC for the drug substance and impurities. The drug substance assay and impurities were unchanged (compared to the drug substance control) throughout the test period, indicating that the drug substance was chemically compatible with PVP and MCC under the conditions that approximate those encountered during processing. The XRPD scans confirmed the amorphous nature of the drug substance in the dried residue throughout the duration of the compatibility study. This observation was also verified in binder optimization studies conducted during formulation development as described in Section 2.2.1.3 Binder Optimization and Drug Substance Solid State Stabilization.
As discussed in Section 2.2.1.3 Selection of Coating Polymer, Kollicoat SR 30 D was selected as the ER polymer based on favorable physico-mechanical properties that can withstand downstream compression conditions. Triethyl citrate (TEC) and talc were chosen as the plasticizer and anti-tacking agent, respectively. For the compatibility study, 1% drug substance Z was spiked into a prototype coating dispersion containing 82.8% Kollicoat 30 SR D, 4% TEC and 12.2% Talc. An aliquot of the spiked coating dispersion was allowed to air dry. Drug substance Z (control) and the spiked dispersion were exposed to 60 °C/75% RH for 1, 7 and 14 days and to 40 °C/75% RH for 1, 2 and 4 weeks. Drug substance stability was monitored using HPLC for drug substance Z and impurities.
Drug substance assay and impurities were unchanged (compared to the drug substance control) throughout the test period. This demonstrated that the prototype coating dispersion was chemically compatible with drug substance Z under conditions which mimicked those expected during the ER polymer coating and curing (if needed) processes.
2.1.2.3 Excipients in Example MR Tablets, 10 mg
It was important to choose a formulation that would maintain bead structural integrity during compression while exhibiting consistent, optimal drug release. Premature crushing or damage to the beads would alter the drug release profile leading to an inconsistent pharmacokinetic profile of the extended release portion of the drug product. The components in the final formulation of the Example MR Tablets are listed in Table 18. Because the compatibility of the excipients used in the extragranular matrix was already demonstrated during the IR tablet development, no additional compatibility study was conducted.