RELEASE 18.0
REPORTS GUIDE
DOCUMENT VERSION 2
BroadWorks
®Guide
Copyright NoticeCopyright © 2011 BroadSoft, Inc. All rights reserved.
Any technical documentation that is made available by BroadSoft, Inc. is proprietary and confidential and is considered the copyrighted work of BroadSoft, Inc.
This publication is for distribution under BroadSoft non-disclosure agreement only.
No part of this publication may be duplicated without the express written permission of BroadSoft, Inc. 9737 Washingtonian Boulevard, Gaithersburg, MD 20878.
BroadSoft reserves the right to make changes without prior notice. Trademarks
BroadWorks® and BroadWorks Assistant–Enterprise™, BroadWorks Call Center™, BroadWorks
Communicator™, BroadWorks Receptionist™, and BroadWorks Deployment Studio™ are trademarks of BroadSoft, Inc.
Microsoft, MSN, Windows, and the Windows logo are registered trademarks of Microsoft Corporation. Other product names mentioned in this document may be trademarks or registered trademarks of their respective companies and are hereby acknowledged.
Table of Contents
1 Summary of Changes . . . 8
1.1 Changes for Release 18.0 . . . 8
1.2 Changes for Release 17.0, Document Version 2 . . . 8
1.3 Changes for Release 17.0, Document Version 1 . . . 8
2 About This Document . . . 8
2.1 Audience . . . 8
2.2 Additional Resources . . . 8
3 Overview . . . 9
3.1 Report Types . . . 9
3.2 Canned Report Layout . . . .10
4 Agent Report Templates . . . .11
4.1 Agent Report Introduction Section . . . .12
4.2 Agent Call Report . . . .14
4.2.1 Number of Calls by Call Type Pie Chart . . . .14
4.2.2 Number of Calls by Call Type Table . . . .15
4.3 Agent Duration Report . . . .16
4.3.1 Call Duration by Call Type Bar Chart . . . .16
4.3.2 Call Duration by Call Type Table . . . .17
4.4 Agent Call Detail Report . . . .19
4.4.1 Call Detail Table . . . .19
4.4.2 Transfer Summary Bar Chart . . . .21
4.5 Agent Activity Report . . . .21
4.5.1 Activity Duration Bar Chart . . . .22
4.5.2 Availability Duration Pie Chart . . . .23
4.5.3 Agent Activity Counts Table . . . .23
4.5.4 Activity Duration Table . . . .25
4.6 Agent Summary Report . . . .26
4.6.1 Call Summary Bar Chart . . . .28
4.6.2 Activity Summary Bar Chart . . . .29
4.6.3 High Water Marks Bar Chart . . . .30
4.6.4 Call Summary Table . . . .30
4.6.5 Activity Summary Table . . . .32
4.6.6 High Water Marks Table . . . .34
4.7 Agent Unavailability Report . . . .35
4.7.1 Unavailable Codes Pie Chart . . . .35
4.7.2 Unavailable Code Duration Bar Chart . . . .36
4.7.3 Unavailable Codes Table . . . .37
4.7.4 Unavailable Code Duration Table . . . .38
4.8.1 Disposition Codes Pie Chart . . . .40
4.8.2 Disposition Codes Table . . . .41
4.9 Agent Sign In Sign Out Report . . . .42
4.9.1 Sign In Sign Out Table . . . .42
4.9.2 Average Staffed Duration Bar Chart . . . .43
5 Call Center Report Templates . . . .43
5.1 Call Center Report Introduction Section . . . .44
5.2 Call Center Incoming Calls Report . . . .46
5.2.1 Inbound Calls To Call Center Pie Chart . . . .46
5.2.2 Inbound Calls Table . . . .47
5.3 Call Center Report . . . .48
5.3.1 Call Center Activity by Answered Calls Pie Chart . . . .49
5.3.2 Call Center Activity Bar Chart . . . .50
5.3.3 Call Center Activity Table . . . .51
5.3.4 High Water Marks Table . . . .53
5.4 Call Center Presented Calls Report . . . .54
5.4.1 Call Center Activity by Presented Calls Pie Chart . . . .55
5.5 Abandoned Call Report . . . .56
5.5.1 Abandoned Calls Bar Chart . . . .56
5.5.2 Abandoned Calls Table . . . .57
5.6 Call Center Summary Report . . . .59
5.6.1 Call Center Summary Line Chart . . . .59
5.6.2 Call Center Summary Table . . . .60
5.7 Service Level Report . . . .62
5.7.1 Service Level Deviation Line Chart . . . .62
5.7.2 Service Level Average Bar Chart . . . .63
5.7.3 Service Level Table . . . .63
5.8 Call Center Call Detail Report . . . .65
5.8.1 Call Detail Table . . . .65
5.9 Call Center Disposition Code Report . . . .67
5.9.1 Disposition Codes Pie Chart . . . .67
5.9.2 Disposition Codes Table . . . .68
5.10 Call Center Overflow Matrix Report . . . .69
5.10.1 Overflow Matrix . . . .70
6 Glossary and Definitions . . . .71
6.1 Performance Parameters . . . .71
6.2 Call Types . . . .72
6.3 Other Terms used in Statistics Measurements . . . .73
Table of Figures
Figure 1 Canned Report Layout . . . 10
Figure 2 Introduction Section of Interval-based Historical Report for All Agents . . . 13
Figure 3 Introduction Section of Interval-based Real-time Report for Selected Agents . . . 13
Figure 4 Introduction Section of Interval-based Historical Report for Single Agent . . . 13
Figure 5 Introduction Section of Non-interval-based Historical Report for Single Agent . . . 13
Figure 6 Agent Call Report – Number of Calls by Call Type Pie Chart . . . 15
Figure 7 Agent Call Report – Number of Calls by Call Type Table (Multiple Agents) . . . 16
Figure 8 Agent Call Report – Number of Calls by Call Type Table (Single Agent) . . . 16
Figure 9 Agent Duration Report – Call Duration by Call Type Bar Chart . . . 17
Figure 10 Agent Duration Report – Call Duration by Call Type (Multiple Agents) . . . .18
Figure 11 Agent Duration Report – Call Duration by Call Type Table (Single Agent) . . . .19
Figure 12 Agent Call Detail Report – Call Detail Table . . . .21
Figure 13 Agent Call Detail Report – Transfer Summary Bar Chart . . . .21
Figure 14 Agent Activity Report – Activity Duration Bar Chart . . . .22
Figure 15 Agent Activity Report – Availability Duration Pie Chart . . . .23
Figure 16 Agent Activity Report – Agent Activity Counts Table (Multiple Agents) . . . .24
Figure 17 Agent Activity Report – Agent Activity Counts Table (Single Agent) . . . .25
Figure 18 Agent Activity Report – Activity Duration Table (Multiple Agents) . . . .26
Figure 19 Agent Activity Report – Activity Duration Table (Single Agent) . . . .26
Figure 20 Agent Summary Report – Call Summary Bar Chart . . . .29
Figure 21 Agent Summary Report – Activity Summary Bar Chart . . . .30
Figure 22 Agent Summary Report – High Water Marks Bar Chart . . . .31
Figure 23 Agent Summary Report – Call Summary Table (Multiple Agents) . . . .32
Figure 24 Agent Summary Report – Call Summary Table (Single Agent) . . . .32
Figure 25 Agent Summary Report – Activity Summary Table (Multiple Agents) . . . .33
Figure 26 Agent Summary Report – Activity Summary Table (Single Agent) . . . .33
Figure 27 Agent Summary Report – High Water Marks Table (Multiple Agents) . . . .35
Figure 28 Agent Summary Report – High Water Marks Table (Single Agent) . . . .35
Figure 29 Agent Unavailability Report – Unavailable Codes Pie Chart . . . .36
Figure 30 Agent Unavailability Report – Unavailable Code Duration Bar Chart . . . .36
Figure 31 Agent Unavailability Report – Unavailable Codes Table (Multiple Agents) . . . .37
Figure 32 Agent Unavailability Report – Unavailable Codes Table (Single Agent) . . . .38
Figure 33 Agent Unavailability Report – Unavailable Code Duration Table (Multiple Agents) . . . .39
Figure 34 Agent Unavailability Report – Unavailable Code Duration Table (Single Agent) . . . .39
Figure 35 Agent Disposition Code Report – Disposition Codes Pie Chart . . . .40
Figure 36 Agent Disposition Code Report – Disposition Codes Table (Multiple Agents) . . . .41
Figure 37 Agent Disposition Code Report – Disposition Codes Table (Single Agent) . . . .42
Figure 38 Agent Sign In Sign Out Report – Sign In Sign Out Table (Single Agent) . . . .43
Figure 39 Agent Sign In Sign Out Report – Average Staffed Duration Bar Chart . . . .43
Figure 41 Introduction Section of Interval-based Real-time Report for Selected Call Centers . . . .45
Figure 42 Introduction Section of Interval-based Historical Report for Single Call Center . . . .45
Figure 43 Introduction Section of Interval-based Historical Report for Selected DNISs . . . .45
Figure 44 Introduction Section of Non-interval-based Historical Report for Single DNIS . . . .46
Figure 45 Call Center Incoming Calls Report – Inbound Calls To Call Center Pie Chart . . . .47
Figure 46 Call Center Incoming Calls Report – Inbound Calls Table (Multiple Call Centers or DNISs) . . . 48
Figure 47 Call Center Incoming Calls Report – Inbound Calls Table (Single Call Center or DNIS) . . . 48
Figure 48 Call Center Report – Call Center Activity by Answered Calls Pie Chart . . . .49
Figure 49 Call Center Report – Call Center Activity Bar Chart . . . .51
Figure 50 Call Center Report – Call Center Activity Table (Multiple Call Centers or DNISs) . . . .53
Figure 51 Call Center Report – Call Center Activity Table (Single Call Center or DNIS) . . . .53
Figure 52 Call Center Report – High Water Marks Table (Multiple Call Centers or DNISs) . . . .54
Figure 53 Call Center Report – High Water Marks Table (Single Call Center or DNIS) . . . .54
Figure 54 Call Center Presented Calls – Call Center Activity by Presented Calls Pie Chart . . . .56
Figure 55 Abandoned Call Report – Abandoned Calls Bar Chart . . . .57
Figure 56 Abandoned Call Report – Abandoned Calls Table (Multiple Call Centers or DNISs) . . . .59
Figure 57 Abandoned Call Report – Abandoned Calls Table (Single Call Center or DNIS) . . . .59
Figure 58 Call Center Summary Report – Call Center Summary Line Chart . . . .60
Figure 59 Call Center Summary Report – Call Center Summary Table (Multiple Call Centers or DNISs) . . . 61
Figure 60 Call Center Summary Report – Call Center Summary Table (Single Call Center or DNIS) . . . 62
Figure 61 Service Level Report – Service Level Deviation Line Chart . . . .63
Figure 62 Service Level Report – Service Level Average Bar Chart . . . .63
Figure 63 Service Level Report – Service Level Table (Multiple Call Centers or DNISs) . . . .65
Figure 64 Service Level Report – Service Level Table (Single Call Center or DNIS) . . . .65
Figure 65 Call Center Call Detail Report – Call Detail Table (Multiple Call Centers or DNISs) . . . .67
Figure 66 Call Center Disposition Code Report – Disposition Codes Pie Chart . . . .68
Figure 67 Call Center Disposition Code Report – Disposition Codes Table (Multiple Call Centers or DNISs) . . . 69
Figure 68 Call Center Disposition Code Report – Disposition Codes Table (Single Call Center or DNIS) . . . 69
1 Summary of Changes 1.1 Changes for Release 18.0
There were no changes for Release 18.0.
1.2 Changes for Release 17.0, Document Version 2
The following changes were made in this version of the document:
• Updated sections 4.4.1 Call Detail Table and 5.8.1 Call Detail Table to clarify the behavior of default disposition codes when a code is actually entered by the agent.
• Updated section 4.6.1 Call Summary Bar Chart for EV 141682. • Updated section 4.6 Agent Summary Report for EV 140379.
• Updated screen shots in section 5.3.3 Call Center Activity Table for EV 140566.
• Updated section 5.5 Abandoned Call Report to clarify that “Calls Abandoned after Entrance Message Completes” is computed from the counters “Calls Abandoned” and “Calls Abandoned before Entrance Message Completes”.
• Updated section 5.8.1 Call Detail Table to include the description of the Call Answer Time column for EV 140957.
1.3 Changes for Release 17.0, Document Version 1
This document was created for Release 17.0. However, the content applies to Release 17.sp2 on BroadWorks.
2 About This Document
This guide describes canned report templates available on BroadWorks in Release 18.0 as part of the Enhanced Call Center Reporting feature.
2.1 Audience
This document is intended for BroadWorks administrators and call center agents and supervisors who generate and view Call Center Reports.
This document may also be used as reference information by BroadWorks administrators who configure Enhanced Call Center Reporting for their administrative entities.
2.2 Additional Resources
For more information, see the following documents:
• For information on scheduling reports from the web portal, see the BroadWorks Application Server Group Web Interface Administration Guide – Part 2.
• For information on generating on-demand reports and scheduling reports from a Call Center client, see the BroadWorks Hosted Thin Call Center Agent/Supervisor User Guide.
3 Overview
BroadWorks Enhanced Call Center Reporting feature allows users to generate enhanced reports and schedule reports to be run in the future. It provides a set of canned report templates and allows administrators to define customized templates.
• Call center agents and supervisors can generate reports on demand and schedule reports from the Hosted Thin Call Center client application. For information on generating and scheduling reports from the Call Center client, see the BroadWorks Hosted Thin Call Center Agent/Supervisor User Guide. NOTE:Agents can only request reports about themselves.
• BroadWorks group and enterprise administrators can schedule reports from the web portal. They cannot generate reports on demand. For information on scheduling reports from the web portal, see the BroadWorks Application Server Group Web Interface Administration Guide – Part 2.
The report template defines the layout and to some extent the contents of a report. When requesting a report, the user first selects a template, enters some input parameters, and then runs or schedules a report. The input parameters include information such as the reporting period and the list of agents or call centers for which the report is requested. In addition, certain reports require you to provide performance parameters that are used to make report calculations. The performance parameters you need to provide when requesting a report are listed in each report template section. The list of performance parameters used in canned templates is included in section 6.1 Performance Parameters.
This document describes the canned report templates available from BroadWorks as part of the Enhanced Call Center Reporting feature.
• Section 3.1 Report Types describes the different types of reports.
• Section 3.2 Canned Report Layout describes the general layout of a report generated using a canned template.
• Section 4 Agent Report Templates describes the canned Agent Reports.
• Section 5 Call Center Report Templates describes the canned Call Center Reports. NOTE: The report templates that are available to you depend on your system configuration. 3.1 Report Types
Reports templates are divided into two categories: Agent and Call Center
• Agent Report templates allow you to generate reports containing statistical information about one or more agents.
• Call Center Report templates allow you to generate reports that include statistics related to one or more call centers or one or more Dialed Number Identification Services (DNISs) for a selected call center. In addition, reports can be real-time or historical and they can be interval-based or not interval-based. • A real-time report includes statistics for a period that has a start date and time, but no end date
and time.
• A historical report includes statistics for a specified time period in the past.
• A real-time report template can be used to generate both real-time and historical reports. • A historical report template can only be used to generate historical reports.
• An interval-based report template is a template that is used to generate reports that include interval statistics.
3.2 Canned Report Layout
The report template defines the layout and to a certain extent the contents of a report. Canned reports follow a common presentation pattern that is illustrated in the following figure.
Header
Introduction section
Footer Body section
Figure 1 Canned Report Layout
A report contains a header, an introduction section, a body section, and a footer. • The introduction section consists of the following elements:
− Title – This is the title of the report.
− Time frame – This is the start date and start time, and optionally the end date and end time of the reporting period. The end date and end time are conditional and are only included for historical reports.
− Time zone – This is the time zone used when generating the report, in a localized display format, for example, “(GMT-04:00) (US) Eastern Time”.
Note that the offset from Greenwich Mean Time (GMT) is computed at the time of report generation and not necessarily in relation to the requested time frame.
− Date run – This is the date and time at which the report was run.
− Agent, call center, or DNIS information – The information is conditional and only included when an Agent Report is run for a single agent or when a Call Center Report is run for a single call center or DNIS.
• The body section is made up of one or more of the following elements: − Pie chart
− Bar chart − Line chart − Matrix − Table
Note that pie charts are not displayed if the report does not contain data for the requested time frame. Unless otherwise specified, bar charts, line charts, and tables are always displayed; however, they may be empty. For interval-based reports, rows that do not have data to display are not shown on the report. Although most canned reports may be printed on A4 paper in landscape mode, you may need to use legal size paper and/or enable the fit to page option for reports that have tables that have a large number of columns.
4 Agent Report Templates
BroadWorks Call Center Enhanced Reporting provides the following canned Agent Report templates: • Agent Call Report
• Agent Duration Report • Agent Call Detail Report • Agent Activity Report • Agent Summary Report • Agent Unavailability Report • Agent Disposition Code Report • Agent Sign In Sign Out Report
4.1 Agent Report Introduction Section
The introduction section of an Agent Report displays the report title, the time frame of the reported data, the date that the report was run, and the details of the agent if the report was generated for a single agent. The same pattern is used for all canned Agent Report templates and is described in the following table.
ELEMENT DESCRIPTION
Title The title of the report depends on the report template, agents, and sampling
period selected for the report.
• If the report is requested for more than one agent, then the title is set to “<Report Name> – Multiple Agents – <Sampling Period>”.
• If the report is requested for a single agent, then the title is set to “<Report Name> – <Agent Name> – <Sampling Period>”.
Note that the sampling period is only present for interval-based reports. Start Time
(End Time) • Start Time displays the start date and time of the report.• End Time displays the end date and time of the report.
• Start Time is displayed for all reports, but End Time is only displayed for historical reports.
For an interval-based report template, if the requested start time does not align with a sampling period boundary, then it is adjusted to the previous sampling period boundary. If the end time does not align with a sampling period boundary, then it is adjusted to the next sampling period boundary. For example, if the sampling period is hourly, the start time provided is 11:46 A.M. and the end time is 12:10 P.M. Then the start time is adjusted to 11:00 A.M. and the stop time is adjusted to 1:00 P.M.
The time frame of the generated report is inclusive for the start date and start time and exclusive for the end date and end time. For example, if the time frame is specified as 06/01/2010 0:00 A.M. to 07/01/2010 0:00 A.M., then the report generated actually runs from 06/01/2010 0:00:00.000 A.M. to 06/30/2010 11:59:59.999 P.M.
If the time frame of a report crosses a daylight savings time change, then the report generated either shows no results for the hour skipped (clock is moved forward) or it shows both time periods combined in a single-time interval (clock is moved backward).
Time Zone This is the time zone used for the generation of the report in a localized display
format, for example “(GMT-04:00) (US) Eastern Time”.
Note that the offset from GMT displayed in this introduction section is relative to the time of the report generation and not necessarily to the requested time frame. The time intervals provided in the contents of the report are always presented relative to the offset from GMT that is applicable at the time the statistics were collected for that time zone.
Date Run Date Run displays the date and time at which the report was generated.
Agent Information • If the report is generated for a single agent, then the detailed information for
the agent is provided. The agent name, user ID, phone number, and extension are displayed.
• If the agent only has a phone number configured, then only the phone number is displayed.
• If the agent only has an extension configured, then only the extension is displayed.
Figure 2 provides an example of the introduction section of a historical report for all agents within the requesting user’s scope. The sampling period is 15 minutes.
Figure 2 Introduction Section of Interval-based Historical Report for All Agents
Figure 3 provides an example of the introduction section of a real-time report for a subset of agents within
the requesting user’s scope. The sampling period is 30 minutes.
Figure 3 Introduction Section of Interval-based Real-time Report for Selected Agents
Figure 4 provides an example of the introduction section of a historical report for a single agent within the
requesting user’s scope. The sampling period is hourly.
Figure 4 Introduction Section of Interval-based Historical Report for Single Agent
Figure 5 provides an example of the introduction section of a non-interval-based historical report for a
single agent within the requesting user’s scope.
The format of the phone numbers displayed on Agent Reports depends on the country code of the requesting entity.
• When an agent requests the report, the phone number (if present) is always displayed as a national prefixed number.
• When a supervisor, a group administrator, or an enterprise administrator requests the report and the agent’s country code matches the country code of the requesting entity (supervisor, group, or enterprise), then the phone number is displayed as a national prefixed number. Otherwise, the phone number is displayed as an E.164 number.
4.2 Agent Call Report
The Agent Call Report template is a real-time report template that can be used by administrators, agents, and supervisors to request real-time or historical reports. This is an interval-based report template.
The report provides information about the number of calls handled by agents, reported by call type. The report name is “Agent Call Report” and is displayed in the introduction section of the generated re-port as described in section 4.1 Agent Report Introduction Section.
The report includes the following elements: • Number of Calls by Call Type Pie Chart • Number of Calls by Call Type Table
The report does not require any performance parameters. 4.2.1 Number of Calls by Call Type Pie Chart
The Number of Calls by Call Type pie chart shows the percentage and counts for each type of call handled by the agent(s) for the reporting period.
The call types reported are summarized in the following table.
LABEL DESCRIPTION
ACD Calls This is the number of Automatic Call Distribution (ACD) calls received by the
agent(s). Only answered calls are counted.
Outbound ACD Calls This is the number of outbound ACD calls made by the agent(s). Only answered calls are counted.
Route Point Calls This is the number of route point calls received by the agent(s). Only answered
calls are counted. Outbound Route
Point Calls This is the number of outbound route point calls made by the agent(s). Only answered calls are counted.
Inbound Calls This is the number of inbound calls (non-ACD/route point calls outside the
company ) received by the agent(s). Only answered calls are counted.
Outbound Calls This is the number of outbound calls (non-ACD/route point calls outside the
company) made by the agent(s). Only answered calls are counted.
Internal Calls This is the number of internal calls (non-ACD/route point calls within the
Figure 6 provides an example of a Number of Calls by Call Type pie chart.
Figure 6 Agent Call Report – Number of Calls by Call Type Pie Chart
4.2.2 Number of Calls by Call Type Table
The Number of Calls by Call Type table displays a column for each counter described in the following table. The Number of Calls by Call Type table includes a row per interval for each agent who is active over the interval. It also includes the following summary rows:
• An interval summary row is provided for each interval if multiple agents have been selected. For all counters, the summary row represents the sum of the counter values for all agents reported in that interval.
• An agent summary row is provided for each agent over all intervals if multiple agents have been selected. For all counters, the summary row of an agent represents the sum of the counter values over all intervals for that agent.
• A report summary row is provided for all intervals and all agents. For all counters, the report summary row represents the sum of the counter values over all intervals for all agents reported.
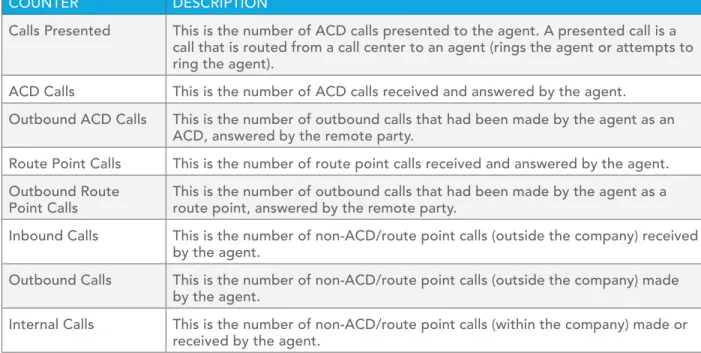
COUNTER DESCRIPTION
Calls Presented This is the number of ACD calls presented to the agent. A presented call is a
call that is routed from a call center to an agent (rings the agent or attempts to ring the agent).
ACD Calls This is the number of ACD calls received and answered by the agent.
Outbound ACD Calls This is the number of outbound calls that had been made by the agent as an
ACD, answered by the remote party.
Route Point Calls This is the number of route point calls received and answered by the agent.
Outbound Route
Point Calls This is the number of outbound calls that had been made by the agent as a route point, answered by the remote party.
Inbound Calls This is the number of non-ACD/route point calls (outside the company) received
by the agent.
Outbound Calls This is the number of non-ACD/route point calls (outside the company) made
by the agent.
Internal Calls This is the number of non-ACD/route point calls (within the company) made or
Figure 7 provides an example of a Number of Calls by Call Type table in a report for multiple agents.
Figure 7 Agent Call Report – Number of Calls by Call Type Table (Multiple Agents)
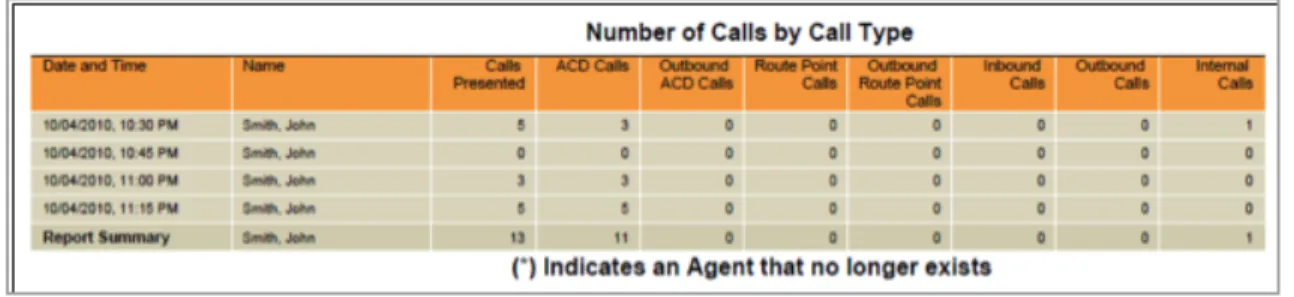
Figure 8 provides an example of a Number of Calls by Call Type table in a report for a single agent.
Figure 8 Agent Call Report – Number of Calls by Call Type Table (Single Agent)
4.3 Agent Duration Report
The Agent Duration Report template is a real-time report template that can be used by administrators, agents, and supervisors to request real-time or historical reports. This is an interval-based report template. The report provides information related to the duration of calls handled by agents.
The report name is “Agent Duration Report” and is displayed in the introduction section of the generated report described in section 4.1 Agent Report Introduction Section.
The report includes the following elements: • Call Duration by Call Type Bar Chart • Call Duration by Call Type Table
The report does not require any performance parameters. 4.3.1 Call Duration by Call Type Bar Chart
The Call Duration by Call Type bar chart shows the amount of time spent by the agent(s) on calls of specific call types for the reporting period.
The call types reported are summarized in the following table.LABEL DESCRIPTION
ACD Calls This is the total call time of ACD calls received by the agent(s). Only answered calls are counted.
Outbound ACD Calls This is the total call time of outbound ACD calls made by the agent(s). Only answered calls are counted.
Route Point Calls This is the total call time of route point calls received by the agent(s). Only answered calls are counted.
Outbound Route Point Calls This is the total call time of outbound route point calls made by the agent(s). Only answered calls are counted.
Inbound Calls This is the total call time of inbound calls (non-ACD/route point calls outside the company) received by the agent(s).
Only answered calls are counted.
Outbound Calls This is the total call time of outbound calls (non-ACD/route point calls outside the company) made by the agent(s). Only
answered calls are counted.
Internal Calls This is the total call time of internal calls (non-ACD/route point calls within the company) made or received by the
agent(s). Only answered calls are counted.
Figure 9 provides an example of a Call Duration by Call Type bar chart.
Figure 9 Agent Duration Report – Call Duration by Call Type Bar Chart
4.3.2 Call Duration by Call Type Table
The Call Duration by Call Type table contains a column for each counter described in the following table. The Call Duration by Call Type table includes a row per interval for each agent who is active over the interval. It also includes the following summary rows:
• An interval summary row is provided for each interval if multiple agents have been selected. For all counters, the summary row represents the sum of the counter values for all agents reported in that interval.
• An agent summary row is provided for each agent over all intervals if multiple agents have been selected. For all counters, the summary row of an agent represents the sum of the counter values over all intervals for that agent.
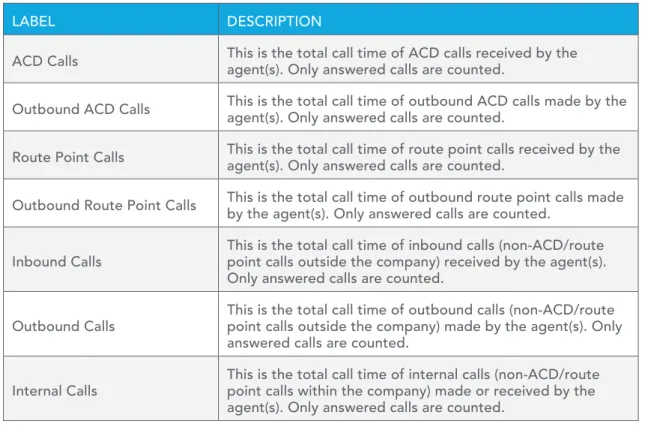
• A report summary row is provided for all intervals and all agents. For all counters, the report summary row represents the sum of the counter values over all intervals for all agents reported.
Figure 10 provides an example of a Call Duration by Call Type table in a report for multiple agents.
Figure 10 Agent Duration Report – Call Duration by Call Type (Multiple Agents)
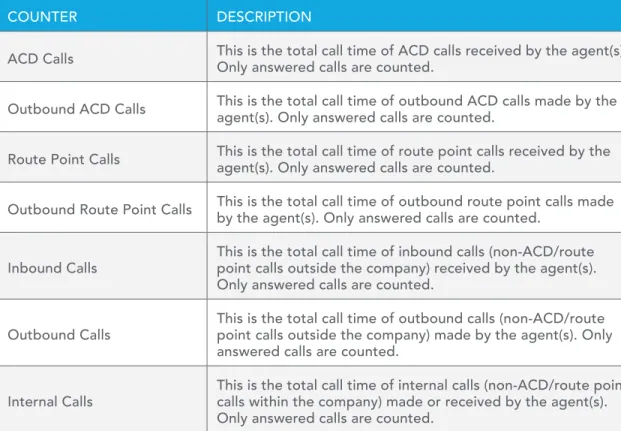
COUNTER DESCRIPTION
ACD Calls This is the total call time of ACD calls received by the agent(s). Only answered calls are counted.
Outbound ACD Calls This is the total call time of outbound ACD calls made by the agent(s). Only answered calls are counted.
Route Point Calls This is the total call time of route point calls received by the agent(s). Only answered calls are counted.
Outbound Route Point Calls This is the total call time of outbound route point calls made by the agent(s). Only answered calls are counted.
Inbound Calls This is the total call time of inbound calls (non-ACD/route point calls outside the company) received by the agent(s).
Only answered calls are counted.
Outbound Calls This is the total call time of outbound calls (non-ACD/route point calls outside the company) made by the agent(s). Only
answered calls are counted.
Internal Calls This is the total call time of internal calls (non-ACD/route point calls within the company) made or received by the agent(s).
Figure 11 provides an example of a Call Duration by Call Type table in a report for a single agent.
Figure 11 Agent Duration Report – Call Duration by Call Type Table (Single Agent)
4.4 Agent Call Detail Report
The Agent Call Detail Report template is a historical report template that can be used by administrators, agents, and supervisors to request historical reports. This is a non-interval-based template.
The report provides information related to calls made or received by agents, whether or not they were answered.
The report name is “Agent Call Detail Report” and is displayed in the introduction section of the generated report, as described in section 4.1 Agent Report Introduction Section.
The report includes the following elements: • Call Detail Table
• Transfer Summary Bar Chart
The report does not require any performance parameters. 4.4.1 Call Detail Table
The Call Detail table shows the details for each call made or received by the agent(s) for the reporting period.
Only completed calls are shown in this report. A call is completed when the following conditions are met: • Agent releases or transfers a non-ACD call.
• Agent releases or transfers an ACD call and the call completion timer expires. The purpose of the call completion timer is to allow the agent to make a transition to the Wrap-Up state following the end of an ACD call. The completion timer is a system option that is configured by the system administrator. The completion timer’s default value is 5 seconds.
• Agent makes a transition out of the Wrap-Up state following the end of an ACD call.
Note that the agent may re-enter the Wrap-Up state following the completion of a call and the agent may enter additional disposition codes. In such cases, reports run at different times may provide different details for a given call, specifically the wrap-up time of the call and the disposition codes entered for that call.
The call details reported are summarized in the following table.
LABEL DESCRIPTION
Call Start Time This is the time that the call with the agent started.
This corresponds to the time the call was answered by the agent or remote party.
Call End Time This is the time that the call with the agent ended.
This corresponds to the time that the call was released by the agent or remote party, or the time that the call was transferred by the agent.
Call Type This is the call type, and can be any of the following values:
• Inbound ACD • Inbound • Outbound ACD • Outbound • Inbound Route Point • Internal • Outbound Route Point
Callers/Called Number This the number calling the agent or the number the agent called.
Number Called This is the DNIS or call center number called by the caller for an ACD call.
This value is only present for ACD calls.
Wait Time in Queue This is the wait time in queue for an ACD call, including preserved wait time. The value
corresponds to the wait time recorded the moment the call was presented to the agent.
This value is only present for ACD calls.
Staffed This indicates whether the agent was signed in (that is in any state except sign-out)
the moment the agent made or received a call.
Talk Time This is the talk time of the call. This does not include the time that the agent put the
caller on hold.
Hold Time This is the hold time for the call. Specifically, this is the amount of time that the agent
put the caller on hold.
Wrap Up Time This is the wrap-up time for an inbound or outbound ACD call. This is the time that the
agent spent in Wrap-Up state (in association with this call).
This value is only present for inbound or outbound ACD calls. If there is no wrap-up time associated with the ACD call, then the value is set to “0”.
Transfer Number This indicates whether the agent initiated a transfer by including the transfer
destination.
Transfer Location This indicates the transfer destination type. This can be any of the following values:
• Call Center
• Call Center – Long Hold • Outside Enterprise • Within Enterprise
Disposition Codes This lists all disposition codes entered by the agent during the call or during the
subsequent wrap-up period.
Note that disposition codes entered by agents in the context of a route point call are not reported.
In a scenario in which a default disposition code is configured for a call center, the default code is listed in the report as long as the agent does not explicitly enter a code during the call or during a subsequent wrap-up period.
For example, if the agent does not enter a code during a call or in the subsequent wrap-up period, the default code appears in the report for the entry corresponding to the call. The agent may decide to return to the wrap-up state and enter one or more disposition codes. If this occurs, when the report is generated again, the entered disposition code(s) replaces the default code for the entry corresponding to the call.
Figure 12 provides an example of a Call Detail table.
Figure 12 Agent Call Detail Report – Call Detail Table
4.4.2 Transfer Summary Bar Chart
The Transfer Summary bar chart displays a bar for each of the top 10 transfer destinations. Underneath the bar chart, the number of ACD calls and the number of ACD calls transferred for the reporting period are also displayed. The bar chart is not displayed when there are no ACD calls transferred during the reporting interval.
Figure 13 provides an example of a Transfer Summary bar chart.
Figure 13 Agent Call Detail Report – Transfer Summary Bar Chart
4.5 Agent Activity Report
The Agent Activity Report template is a real-time report template that can be used by administrators, agents, and supervisors to request real-time or historical reports. This is an interval-based report template. The report provides information related to the activity of agent(s), such as the time that an agent spends in various states.
The report name is “Agent Activity Report” and is displayed in the introduction section of the generated report, as described in section 4.1 Agent Report Introduction Section.
The report includes the following elements: • Activity Duration Bar Chart
• Availability Duration Pie Chart • Agent Activity Counts Table
• Activity Duration Table
The report requires the following performance parameters: • Call Completion
• Short Duration
Performance parameters are described in section 6.1 Performance Parameters. 4.5.1 Activity Duration Bar Chart
The Activity Duration bar chart shows the amount of time spent by the agent(s) in various states for the reporting period.
The states reported are summarized in the following table. LABEL DESCRIPTION
Available This is the total time that the agent spent in the Available state.
Unavailable This is the total time that the agent spent in the Unavailable state.
Wrap-Up This is the total time that the agent spent in the Wrap-Up state, specifically
for ACD calls.
Talk This is the total time that the agent spent talking, for ACD calls. This does
not include ring time or hold time.
Hold This is the total time that the agent spent holding the remote party for ACD
calls.
Idle This is the total time that the agent was in the Available state and not on a
call. This does not include ring time or the time during which the whisper announcement was playing for an answered ACD call.
Staffed This is the total time that the agent was signed in (that is any state except
Sign-Out).
Figure 14 provides an example of an Activity Duration bar chart.
4.5.2 Availability Duration Pie Chart
The Availability Duration pie chart shows the percentage and amount of time spent by the agent(s) in the Available, Unavailable, and Wrap-Up states for the reporting period.
The agent states reported are summarized in the following table. LABEL DESCRIPTION
Available This is the total time that the agent has spent in the Available state.
Unavailable This is the total time that the agent has spent in the Unavailable state.
Wrap-Up This is the total time that the agent has spent in the Wrap-Up state,
specifically for ACD calls.
Figure 15 provides an example of an Availability Duration pie chart.
Figure 15 Agent Activity Report – Availability Duration Pie Chart
4.5.3 Agent Activity Counts Table
The Agent Activity Counts table displays a column for each counter described in the following table. The values of the Call Completion and Short Duration performance parameters are shown at the top of the table as Service Level and Short Call Threshold respectively.
The Agent Activity Counts table includes a row per interval for each agent who is active over the interval. It also includes the following summary rows:
• An interval summary row is provided for each interval if multiple agents have been selected. For all counters, the summary row represents the sum of the counter values for all agents reported in that interval.
• An agent summary row is provided for each agent over all intervals if multiple agents have been selected. For all counters, the summary row of an agent represents the sum of the counter values over all intervals for that agent.
• A report summary row is provided for all intervals and all agents. For all counters, the report summary row represents the sum of the counter values over all intervals for all agents reported.
COUNTER DESCRIPTION
ACD Calls This is the number of ACD calls made or received by the agent.
Short Duration
Calls This is the number of short duration ACD calls received by the agent. This value depends on the value of the Short Duration performance parameter
provided by the user when requesting the report.
A call is a short duration call if the call time (that is, talk time + hold time) is less than the value of the performance parameter provided by the user. Calls Completed in
Service Level This is the number of ACD calls completed within the requested service level. This value depends on the value of the Call Completion
performance parameter provided by the user in the report request. A call is completed in service level if the call time (that is, talk time + hold time) is less than the value of the performance parameter provided by the user.
Bounced Calls This is the number of ACD calls that were presented to the agent and
bounced.
A bounced call is a call that was presented to the agent but for some reason was not answered by the agent and remained in the queue.
Transferred Calls This is the number of ACD calls made or received by the agent that were
transferred to a new destination. Long Hold
Bounced Calls This is the number of ACD calls received by the agent, which were transferred back to the call center after being held too long.
Note that these types of transferred calls are not accounted for under the
Transferred Calls column.
Escalated Calls This is the number of non-emergency escalations performed by the agent.
Emergency Calls This is the number of emergency escalations performed by the agent.
Figure 16 provides an example of an Agent Activity Counts table in a report for multiple agents.
Figure 17 provides an example of an Agent Activity Counts table in a report for a single agent.
Figure 17 Agent Activity Report – Agent Activity Counts Table (Single Agent)
4.5.4 Activity Duration Table
The Activity Duration table displays a column for each duration counter. The table includes a row per interval for each agent who is active over the interval. It also includes the following summary rows: • An interval summary row is provided for each interval if multiple agents have been selected. For
all counters, the summary row represents the sum of the counter values for all agents reported in that interval.
• An agent summary row is provided for each agent over all intervals if multiple agents have been selected. For all counters, the summary row of an agent represents the sum of the counter values over all intervals for that agent.
• A report summary row is provided for all intervals and all agents. For all counters, the report summary row represents the sum of the counter values over all intervals for all agents reported.
COUNTER DESCRIPTION
Available This is the total time that the agent spent in the Available state.
Unavailable This is the total time that the agent spent in the Unavailable state.
Wrap Up This is the total that the agent spent in the Wrap-Up state, specifically
for ACD calls.
Talk This is the total time that the agent spent talking, for ACD calls. This
does not include ring time or hold time.
Hold This is the total time that the agent spent holding the remote party
for ACD calls.
Idle This is the total time that the agent was in the Available state and not
on a call. This does not include ring time or the time during which the whisper announcement was playing for an answered ACD call.
Staffed This is the total time that the agent was signed in (that is, in any state
Figure 18 provides an example of an Activity Duration table in a report for multiple agents.
Figure 18 Agent Activity Report – Activity Duration Table (Multiple Agents)
Figure 19 provides an example of an Activity Duration table in a report for a single agent.
Figure 19 Agent Activity Report – Activity Duration Table (Single Agent)
4.6 Agent Summary Report
The Agent Summary Report template is a historical report template that can be used by administrators and supervisors to request historical reports. This is an interval-based report template.
The report provides summary information related to the performance of the agent(s), including the average and longest times spent on various types of calls and in various states.
The report name is “Agent Summary Report” and is displayed in the introduction section of the generated report, as described in section 4.1 Agent Report Introduction Section.
The report includes the following elements: • Call Summary Bar Chart
• Activity Summary Bar Chart • High Water Marks Bar Chart • Call Summary Table
• Activity Summary Table • High Water Marks Table
The report does not require any performance parameters.
This report includes averages that are most relevant when the report request is for a larger number of agents or when the report request is for a larger sampling period (for example, daily). The following examples illustrate this point by describing how the average staffed time and average talk time statistics are computed for the activity of one or two agents.
Example 1 – Average Staffed Time
The formula for calculating the average staffed time of a given interval is as follows: Total staffed time/Number of sign-ins in the interval
Because the average staffed time is a function of the number of sign-ins during the reported interval(s), the averages provided in the interval or summary rows may yield values that appear odd if the report is run for a single agent who has very few sign-ins for the requested interval.
For example, consider an agent who signs in twice during the day. The agent signs in first at 8:30 A.M. and signs out at 12:00 noon. The agent signs in again at 2:00 P.M. and signs out at 5:00 P.M.
Use case 1:
If a report is run for the agent for the time frame from 8:00 A.M. to 5:00 P.M. with an hourly sampling pe-riod, then the interval rows for the report (for the most part) indicate an average staffed time of 00:00:00 (total staffed time of one hour for no sign-in events during the interval), with the exception of the:
• 8:00 A.M. interval row that indicates an average staffed time of 00:30:00 (total staffed time of 30 minutes for a single sign-in)
• 2:00 P.M. interval row that indicates an average staffed time of 01:00:00 (total staffed time of one hour for a single sign-in)
• Summary row for the agent that indicates an average staffed time of 03:30:00 (total staffed time of seven hours for two sign-ins)
Use case 2:
If a report is run for the agent for the time frame from 10:00 A.M. to 5:00 P.M. with an hourly sampling period, then the interval rows for the report (for the most part) indicate an average staffed time of 00:00:00 (total staffed time of one hour for no sign-in events during the interval), with the exception of the:
• 2:00 P.M. interval row that indicates an average staffed time of 01:00:00 (total staffed time of one hour for a single sign-in)
• Summary row for the agent that indicates an average staffed time of 05:00:00 (total staffed time of five hours for a single sign-in)
Example 2 − Average Talk Time
The formula for calculating the average talk time of a given interval is as follows: Total talk time/Number of ACD calls received in the interval
Because the average talk time is a function of the number of ACD calls received (that is, answered) during the reported interval(s), the averages provided in the interval or summary rows may yield values that appear odd if the report is run for a single agent or for agents who receive a very low number of calls during the requested interval.
For example, Agent 1 receives an ACD call at 9:25 A.M. and releases the call at 9:50 P.M. Agent 2 receives an ACD call at 9:35 A.M. and releases the call at 9:45 A.M.
Use case 1:
If a report is run for the two agents for the time frame from 9:15 A.M. to 10:00 A.M. with a quarter hourly sampling period, then the report includes the following:
• The 9:15 A.M. interval row indicates:
− Agent 1 − Average talk time of 00:05:00 (total talk time of 5 minutes for a single ACD call received)
− Agent 2 − No activity
− Summary – Average talk time of 00:05:00 (total talk time of 5 minutes for a single ACD call received)
• The 9:30 A.M. interval row indicates:
− Agent 1 − Average talk time of 00:00:00 (total talk time of 15 minutes, but no ACD call received during the interval)
− Agent 2 − Average talk time of 00:10:00 (total talk time of 10 minutes for a single ACD call received) − Summary − Average talk time of 00:25:00 (total talk time of 25 minutes for a single ACD call received) • The 9:45 A.M. interval row indicates:
− Agent 1 − Average talk time of 00:00:00 (total talk time of 5 minutes, but no ACD call received during the interval)
− Agent 2 − No activity
− Summary − Average talk time of 00:00:00 (total talk time of 5 minutes, but no ACD call received during the interval)
• The summary row indicates:
− Agent 1 − Average talk time of 00:25:00 (total talk time of 25 minutes for a single ACD call received) − Agent 2 − Average talk time of 00:10:00 (total talk time of 10 minutes for a single ACD call received) − Summary − Average talk time of 00:17:30 (total talk time of 35 minutes for a two ACD calls received) Use case 2:
If a report is run for the agent for the time frame from 9:00 A.M. to 10:00 A.M. with an hourly sampling period, then the report includes a single set of interval rows that indicate the following:
• Agent 1 – Average talk time of 00:25:00 (total talk time of 25 minutes for a single ACD call received) • Agent 2 − Average talk time of 00:10:00 (total talk time of 10 minutes for a single ACD call received) • Summary − Average talk time of 00:17:30 (total talk time of 35 minutes for two ACD calls received) 4.6.1 Call Summary Bar Chart
The Call Summary bar chart shows the average amount of time spent by the agent(s) on calls of various types for the reporting period.
The values reported are summarized in the following table.
LABEL DESCRIPTION
Average ACD
Duration This is the ∑ (ACD call time [that is, talk time + hold time] for all agents for all time periods)/∑ (Answered ACD calls for all agents for all time periods).
Average Outbound
ACD Duration This is the ∑ (Outbound ACD call time [that is, talk time + hold time] for all agents for all time periods)/∑ (Outbound ACD calls for all agents for all time periods).
Average Route
Point Duration This is the ∑ (Route point call time [that is, talk time + hold time] for all agents for all time periods)/∑ (Answered route point calls for all agents for all time periods).
Average Outbound Route Point Duration
This is the ∑ (Outbound route point call time [that is, talk time + hold time] for all agents for all time periods)/∑ (Outbound route point calls for all agents for all time periods).
Average Inbound
Duration This is the ∑ (Inbound call time [that is, talk time + hold time] for all agents for all time periods)/∑ (Inbound calls for all agents for all time periods).
Average Outbound
Duration This is the ∑ (Outbound call time [that is, talk time + hold time] for all agents for all time periods)/∑ (Outbound calls for all agents for all time periods).
Average Internal
Figure 20 provides an example of a Call Summary bar chart.
Figure 20 Agent Summary Report – Call Summary Bar Chart
4.6.2 Activity Summary Bar Chart
The Activity Summary bar chart shows the average amount of time spent by the agent for the various agent and call states for the reporting period.
The values reported are summarized in the following table. LABEL DESCRIPTION
Average Staffed
Time This is the ∑ (Sign-in time for all agents for all time periods)/∑ (Number of sign-ins for all agents for all time periods).
Average
Wrap-Up Time This is the ∑ (Wrap-up time for ACD calls for all agents for all time periods)/∑ (Number of times an agent was in Wrap-Up state for ACD calls
for all agents for all time periods). Average
Unavailable Time
This is the ∑ (Unavailable time for all agents for all time periods)/∑ (Number of times an agent was in Unavailable state for all agents for all time
periods). Average Talk
Time This is the ∑ (Total talk time for all agents for all time periods)/∑ (ACD calls for all agents for all time periods).
Average Hold
Time This is the ∑ (Total hold time for all agents for all time periods)/∑ (ACD calls for all agents for all time periods).
Average Handle
Time This is the ∑ (Total talk time for all agents for all time periods) + ∑ (Total hold time for all agents for all time periods) + ∑ (Wrap-up time for ACD
calls for all agents for all time periods)/∑ (ACD calls for all agents for all time periods).
Figure 21 provides an example of an Activity Summary bar chart.
Figure 21 Agent Summary Report – Activity Summary Bar Chart
4.6.3 High Water Marks Bar Chart
The High Water Marks bar chart shows the longest amount of time spent by the agent on calls of various call types for the reporting period.
The values reported are summarized in the following table. The duration of calls used to determine the high water mark is captured in the interval in which the call is ended. For example, if an ACD call is started at 10:50 P.M. and ends at 11:10 P.M., then the 20-minute ACD call duration is captured as a high water mark for the 11:00 P.M. interval of an hourly report.
LABEL DESCRIPTION
Longest ACD Call This is the longest amount of time spent on an ACD call.
Longest Outbound ACD Call This is the longest amount of time spent on an outbound
ACD call.
Longest Route Point Call This is the longest amount of time spent on a route point call.
Longest Outbound Route Point Call This is the longest amount of time spent on an outbound route
point call.
Longest Inbound Call This is the longest amount of time spent on an inbound call
(non-ACD/route point outside company).
Longest Outbound Call This is the longest amount of time spent on an outbound call
(non-ACD/route point outside company).
Longest Internal Call This is the longest amount of time spent on an internal call
Figure 22 provides an example of a High Water Marks bar chart.
Figure 22 Agent Summary Report – High Water Marks Bar Chart
4.6.4 Call Summary Table
The Call Summary table displays a column for each counter described in the following table. The Call Summary table includes a row per interval for each agent who is active over the interval. It also includes the following summary rows:
• An interval summary row is provided for each interval if multiple agents have been selected. The following formula is used to compute the interval summary:
∑ (Time for all agents in the time interval)/∑ (Occurrences for all agents in the time interval) • An agent summary row is provided for each agent over all intervals if multiple agents have been
selected. The following formula is used to compute the agent summary:
∑ (Time for the agent over all intervals/∑ (Occurrences for the agent over all time intervals) • A report summary row is provided for all intervals and all agents:
∑ (Time for all agents over all intervals)/∑ (Occurrences for all agents over all time intervals)
COUNTER DESCRIPTION
Average ACD Duration This is the ∑ (ACD call time for the agent in the time interval)/
∑ (ACD calls for the agent in the time interval). Average Outbound ACD
Duration This is the ∑ (Outbound ACD call time for the agent in the time interval)/∑ (Outbound ACD calls for the agent in the time interval).
Average Route Point
Duration This is the ∑ (Route point call time for the agent in the time interval)/∑ (Route point calls for the agent in the time interval).
Average Outbound Route
Point Duration This is the ∑ (Outbound route point call time for the agent in the time interval)/∑ (Outbound route point calls for the agent in the
time interval).
Average Inbound Duration This is the ∑ (Inbound call time for the agent in the time interval)/
∑ (Inbound calls for the agent in the time interval). Average Outbound
Duration This is the ∑ (Outbound call time for the agent in the time interval)/∑ (Outbound calls for the agent in the time interval).
Average Internal Duration This is the ∑ (Internal call time for the agent in the time interval)/
Figure 23 provides an example of a Call Summary table in a report for multiple agents.
Figure 23 Agent Summary Report – Call Summary Table (Multiple Agents)
Figure 24 provides an example of a Call Summary table in a report for a single agent.
Figure 24 Agent Summary Report – Call Summary Table (Single Agent)
4.6.5 Activity Summary Table
The Activity Summary table displays a column for each duration counter described in the following table. The Activity Summary table includes a row per interval for each agent who is active over the interval. It also includes the following summary rows:
• An interval summary row is provided for each interval if multiple agents have been selected. The following formula is used to compute the interval summary:
∑ (Time for all agents in the time interval)/∑ (Occurrences for all agents in the time interval) • An agent summary row is provided for each agent over all intervals if multiple agents have been
selected. The following formula is used to compute the agent summary:
∑ (Time for the agent over all intervals)/∑ (Occurrences for the agent over all time intervals) • A report summary row is provided for all intervals and all agents:
Average Staffed
Time This is the ∑ (Sign-in time for the agent in the time interval)/ ∑ (Number of sign-ins for the agent in the time interval).
Average Wrap-up
Time This is the ∑ (Wrap-up time for ACD calls for the agent in the time interval)/∑ (Number of time the agent was in Wrap-Up state for ACD
calls in the time interval). Average Unavailable
Time This is the ∑ (Unavailable time for the agent in the time interval)/∑ (Number of times the agent was in Unavailable state in the time
interval).
Average Talk Time This is the ∑ (Total talk time for the agent in the time interval)/
∑ (ACD calls for the agent in the time interval).
Average Hold Time This is the ∑ (Total hold time for the agent in the time interval)/∑
(ACD held calls for the agent in the time interval). Average Handle
Time This is the ∑ (Total talk time for the agent in the time interval) + ∑ (Total hold time for the agent in the time interval) + ∑ (Wrap-up time
for ACD calls for the agent in the time interval)/∑ (ACD calls for the agent in the time interval).
Figure 25 provides an example of an Activity Summary table in a report for multiple agents.
Figure 25 Agent Summary Report – Activity Summary Table (Multiple Agents)
Figure 26 provides an example of an Activity Summary table in a report for a single agent.
4.6.6 High Water Marks Table
The High Water Marks table displays a column for each duration counter.
The table includes a row per interval for each agent who is active over the interval. It also includes the following summary rows:
• An interval summary row is provided for each interval if multiple agents have been selected. This represents the maximum value for all agents in that interval.
• An agent summary row is provided for each agent over all intervals if multiple agents have been selected. This represents the maximum value for that agent over all intervals.
• A report summary row is provided for all intervals and all agents. This represents the maximum value for all agents over all intervals.
The duration counters included in the report are described in the following table. The duration of calls used to determine the high water mark is captured in the interval in which the call is ended. For example, if an ACD call is started at 10:50 P.M. and ends at 11:10 P.M., then the 20-minute ACD call duration is captured as a high water mark for the 11:00 P.M. interval of an hourly report.
COUNTER DESCRIPTION
Longest ACD Call This is the longest amount of time spent on an ACD call by the
agent for that interval. Longest Outbound
ACD Call This is the longest amount of time spent on an outbound ACD call by the agent for that interval.
Longest Route Point Call This is the longest amount of time spent on a route point call
by the agent for that interval. Longest Outbound Route
Point Call This is the longest amount of time spent on an outbound route point call by the agent for that interval.
Longest Inbound Call This is the longest amount of time spent on an inbound call
(non-ACD/route point outside company) by the agent for that interval.
Longest Outbound Call This is the longest amount of time spent on an outbound call
(non-ACD/route point outside company) by the agent for that interval.
Longest Internal Call This is the longest amount of time spent on an internal call
(non-ACD/route point within company) by the agent for that interval.
Figure 27 provides an example of a High Water Marks table in a report for multiple agents.
Figure 27 Agent Summary Report – High Water Marks Table (Multiple Agents)
Figure 28 provides an example of a High Water Marks table in a report for a single agent.
Figure 28 Agent Summary Report – High Water Marks Table (Single Agent)
4.7 Agent Unavailability Report
The Agent Unavailability Report template is a historical report template that can be used by administrators and supervisors to request historical reports. This is an interval-based report template.
The report provides information related to the unavailability codes used by agents when setting their state to Unavailable.
The report name is “Agent Unavailability Report” and is displayed in the introduction section of the generated report, as described in section 4.1 Agent Report Introduction Section.
The report includes the following elements: • Unavailable Codes Pie Chart
• Unavailable Code Duration Bar Chart • Unavailable Codes Table
• Unavailable Code Duration Table
The report does not require any performance parameters. 4.7.1 Unavailable Codes Pie Chart
Each label represents one of the top 10 codes used.
• For a single agent report, these are the top 10 codes used by the agent. • For a multiple agent report, these are the top 10 codes used by all agents.
In addition, the Other label is displayed (when applicable) and represents the sum of all other codes. The No Code label is displayed (when applicable) and represents the sum of all times where an unavailability code was not used.
Figure 29 provides an example of an Unavailable Codes pie chart.
Figure 29 Agent Unavailability Report – Unavailable Codes Pie Chart
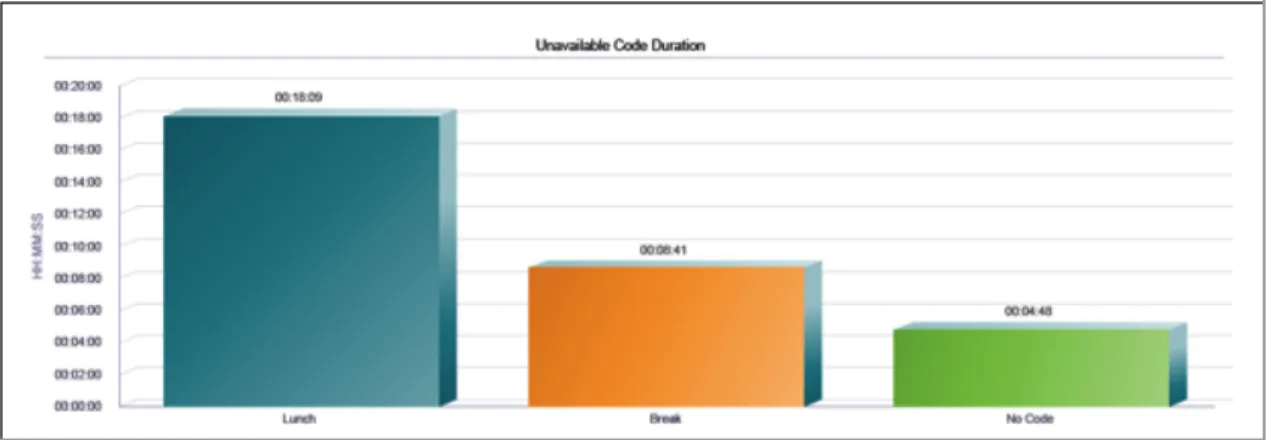
4.7.2 Unavailable Code Duration Bar Chart
The Unavailable Code Duration bar chart shows the amount of time that an unavailability code is used for the reporting period.
Each label represents one of the top 10 codes used.
• For a single agent report, these are the top 10 codes used by the agent. • For a multiple agent report, these are the top 10 codes used by all agents.
In addition, the Other label is displayed (when applicable) and represents the sum of all other codes and the No Code label is displayed (when applicable) and represents the sum of all times that an unavailability code was not used. The bars are first ordered by size and then by name. The bars Other and No Code, when applicable, are always displayed to the far right, in that order. The bar chart is not displayed when there are no unavailability codes used during the reporting interval.
Figure 30 provides an example of an Unavailable Code Duration bar chart.