Knowledge base and research front of Information science 2006-2010:
An author co-citation and bibliographic coupling analysis
Dangzhi Zhao1
School of Library and Information Studies, University of Alberta, Edmonton, Alberta, Canada T6G 2J4. Phone: (780) 492-2814, Fax: (780) 492-2430, Email: [email protected]
Andreas Strotmann
GESIS – Leibniz Institute for the Social Sciences, Unter Sachsenhausen 6-8, 50667 Cologne, Germany. Email: [email protected]
Abstract
This study continues a long history of author co-citation analysis (and, more recently, author bibliographic coupling analysis) of the intellectual structure of information science (IS) into the time period of 2006-2010. It finds that Web technologies continue to drive developments, especially for the research front, although perhaps more indirectly than before. A broadening of perspectives is visible in IS 2006-2010, where network science became influential and full text analysis methods complement traditional computer science influences. Research in the areas of h-index and mapping of science appears to have been highlights of IS 2006-2011. This study tests and confirms a forecast made previously by comparing knowledge base and research front findings for IS 2001-2005, which expected the IR systems and Webometrics specialties both to shrink in 2010. A corresponding comparison of knowledge base and research front of IS 2006-2010 suggests a continuing decline of the IR systems specialty in the near future, but also a considerable (re-)growth of the Webometrics area after a period of decline from
2001-2005 to 2006-2010, the latter due perhaps in part to its contribution to an emerging Web Science.
Introduction
The intellectual structure of information science (IS) as defined by 12 core IS journals in the field of library and information science has been the focus of a series of studies covering a long continuous time period (34 years) using the same data source and a similar methodology.
The first and most comprehensive of these studies was White & McCain (1998), which examined IS 1972 – 1995 using Web of Science data and mainly author co-citation analysis (ACA) methodology. It identified highly influential scholars on IS, studied the intellectual structure of IS as represented by these scholars, and examined the evolution of this structure over three 8-year periods.
Following up on this study and using the same data source and a similar ACA
methodology, Zhao & Strotmann (2008a) studied IS 1996-2005, which corresponded to the first decade of the rise to prominence of the World Wide Web, and introduced an improved method for visualizations of the intellectual structures identified. It revealed the intellectual structure of IS during that period, identified changes in this structure
compared to previous years, and showed the important impact of the Web on IS. Zhao & Strotmann (2008b) broke up these ten years (1996-2005) into two 5-year periods and studied the evolution of the intellectual structure of IS over these two time periods. They used an ACA methodology similar to their 2008a study, but enriched it by a simultaneous author bibliographic coupling analysis (ABCA), a method they introduced there.
Throughout, these studies found IS to consist of two largely separated camps, one focusing on information representation, retrieval, users and use (Information retrieval camp), and the other on quantitative studies of science and technology (Knowledge domain analysis camp). While this two-camp structure has been a constant feature of the intellectual structure of the IS field, research areas within each camp have been evolving continuously over the years, largely driven by information technology, especially Internet technologies.
For the Knowledge domain analysis camp, these studies found a relatively stable core of three approximately equally sized areas of study (evaluative bibliometrics, bibliometric distributions, and relational bibliometrics), with the addition of Webometrics in 2001-2005. The IR camp, on the other hand, was found to have undergone significant internal restructuring several times over the years, first around library automation and OPACs and then evolving a focus on information behavior.
Findings from these studies have informed Saracevic’s article on information science for the 2010 Encyclopedia of LIS edited by M. J. Bates (Saracevic, 2010; Bates, & Maack, 2010).
The present study brings this line of studies up to date and attempts to forecast future research trends in IS by examining IS 2006-2010 using a combination of ACA and ABCA similar to Zhao & Strotmann (2008b) but with further improved visualizations.
Related studies
While general bibliometric profiling of research fields has been performed for many research fields, bibliometric studies of intellectual structures of research fields have tended to concentrate on Library and Information Science (LIS) and a few other
research fields, likely due in part to higher requirements by this type of studies for the researchers’ knowledge of the research fields being studied.
As reviewed by Zhao & Strotmann (2008a; 2008b), earlier bibliometric studies of the intellectual structure of the LIS field examined various discrete time periods using methods such as co-word analysis and document co-citation analysis. More recent studies have examined the evolution of topics studied in LIS over extensive time periods (1930-2009 or 1988-2007) through text analysis of LIS dissertations or articles (Finlay, Sugimoto, Li, & Russell, 2012; Milojević, Sugimoto, Yan, & Ding, 2011; Sugimoto, Li, Russell, Finlay, & Ding, 2011). Shifts in subject areas are also detailed in Larivière, Sugimoto & Cronin (2012) that provided a bibliometric chronicling of LIS’s first century using a variety of bibliometric methods.
These studies found that the main topics studied in LIS have been evolving continuously and that the subject areas currently covered are substantially different from its early years. It is very noticeable that studies on library-related topics have been declining steadily. A main driving force for these changes has been the rapid development of information technologies. LIS appears to consist of three main branches focusing on library, information, and science respectively. These findings are thus consistent with those from the line of studies that the present study is building on, with “information” corresponding to the Information retrieval camp and “science” to the Knowledge domain analysis one mentioned earlier.
Methods for mapping intellectual structures of research fields have also been further studied in recent years. Zhao & Strotmann (2008c, 2011a, 2011b) studied how to apply ACA to highly collaborative research fields, and provided a field delineation method that combines citation databases with subject bibliographic databases (e.g., Scopus with
PubMed). Strotmann & Zhao (2012) showed the importance of author name
disambiguation in bibliometrics. Lu & Wolfram (2012) compared three types of measures of author research relatedness, and Yan & Ding (2012) examined the similarities
between these two and several other types of bibliometric networks. Chen, Ibekwe-SanJuan & Hou (2010) studied automatic labeling of clusters of documents in science mapping for IS. Klavans & Boyack (2011) compared the view of the IS field from within to that of the field in a global context of science mapped via document bibliographic coupling analysis.
Methodology
Co-citation analysis and bibliographic coupling analysis are two dominant bibliometric methods for mapping intellectual structures of research fields, and have been frequently studied, used and improved upon since their introduction. Authors as the unit of analysis (vs documents or journals) have the advantage of a nice balance in granularity and the potential for studying people in addition to their works (White, 1990).
The present study combines ACA and ABCA to examine the intellectual structure of IS 2006-2010 in terms of both its knowledge base and its research front, and to attempt identifying trends in this structure. A field’s knowledge base is what current research heavily draws on, and its research front is what its currently active research deals with. As ACA normally studies a research field by examining a set of authors highly cited in this field, the structure that is revealed by ACA represents the field’s knowledge base. ABCA, on the other hand, examines directly the active researchers in the field and thus provides a view of the structure of the research front of the field (Cornelius, Landström, & Persson, 2006; Persson, 1994).
The evolution of the intellectual structure of IS from 2001-2005 to 2006-2010 will be examined by comparing results obtained from the present dataset with those from the 2001-2005 time period studied in Zhao & Strotmann (2008b). In order to make these results comparable, we collected and analyzed data for the present study in much the same way as in Zhao & Strotmann (2008b), as described below.
Data collection
We downloaded Web of Science full records (including cited references) for all articles published during the years 2006 to 2010 in 12 core IS journals. These journals were used to define the IS research field in all previous ACA studies of IS that the present study aims to update.
This 5-year dataset includes 4,567 records of source papers. Compared to the 10-year dataset for 1996-2005, which comprised 4,422 records of source papers (Zhao &
Strotmann, 2008b), it is evident that IS publications in these 12 journals have increased dramatically over the years, from 442 papers per year on average in 1996-2005 to 913 papers per year on average in 2006-2010.
We processed this dataset to identify “core” authors and to calculate their co-citation counts or bibliographic coupling frequencies (BCFs). The 250 most highly cited authors are taken to be core authors in the case of ACA, and the 300 most highly published authors with high average BCFs are considered core authors in the case of ABCA. As in Zhao & Strotmann (2008b), the co-citation count of authors A and B is the total number of articles that cite at least one document from A’s oeuvre and at least one from B’s where an author’s oeuvre is the complete set of documents written by that author as the first author (McCain, 1990); a document that is cited by N documents in author A’s
oeuvre and by M documents in author B’s oeuvre would contribute min(N, M) (i.e., the smaller of N and M) to the BCF of authors A and B; and an author’s average BCF is the sum of this author’s BCFs with all of the other authors in the dataset, divided by the total number of authors in the dataset less one.
Note that the co-citation count of authors A and B is thus defined mathematically as the size of the intersection of the two sets of documents that cite A’s and B’s oeuvres,
respectively, whereas the bibliographic coupling frequency of authors A and B is defined as the size of the intersection of the two multisets of all documents that are cited in A’s and B’s oeuvres, respectively.
For these core authors, we constructed author-by-author matrices of co-citation counts and BCFs respectively, leaving the diagonals of these two matrices empty. We then manually examined the matrices and checked author names that are known to likely each represent multiple individuals, such as Liu Y, Kim H, Kim S, Lee S, Liu X, and Li X. As suggested in Strotmann & Zhao (2012), we removed such author names from the ABCA, and, with the exception of those names that correspond to a dominant individual, from the ACA as well. An individual was deemed dominant in the latter case if citations to this author accounted for at least 90% of the citations to the corresponding name (e.g., Chen C, Smith A, and Meyer M). The result was a 244 x 244 co-citation matrix and a 251 x 251 BCF matrix.
Factor analysis
These two matrices were each read into SPSS (version 21), and each time the first-ranked 150 authors of the matrix were analyzed as variables using SPSS’ Factor
Analysis routine to explore the underlying structure of the interrelationships between the selected authors. Because of the increase in the number of publications that define the
field, we used a larger number of authors here (i.e., 150) than the 120 authors used in previous studies, in order to represent the IS field as well as before. We also used a higher case-to-variable ratio as suggested by statistics textbooks (Hair, Anderson, Tatham, & Black, 1998).
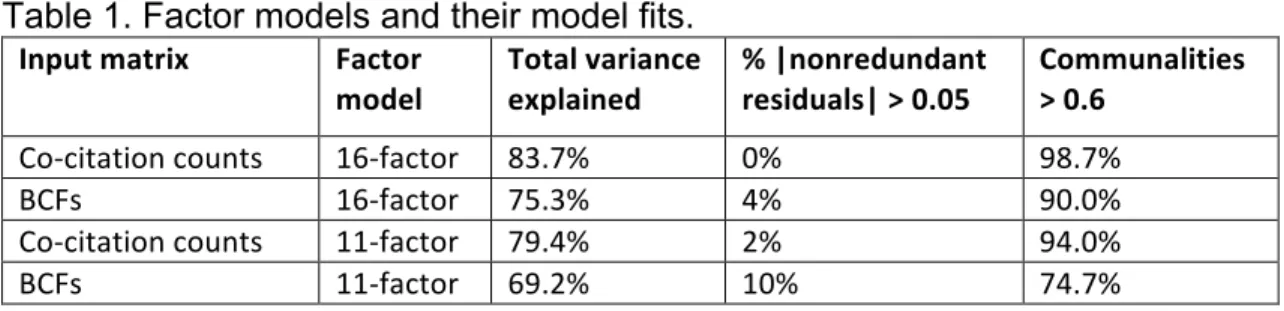
The diagonal values were treated as missing values and replaced by the mean in the Factor Analysis routine. Factors were extracted by Principal Component Analysis (PCA), and the number of factors extracted from the co-citation matrix was determined based on Kaiser’s rule of eigenvalue greater than one. This resulted in a 16-factor model that had a good model fit in terms of the total variance explained, communalities – how well a variable (i.e., an author’s oeuvre here) is explained by the factor model, and
correlation residuals – the differences between observed correlations and correlations implied by the factor model (Hair, Anderson, Tatham, & Black, 1998). The same number of factors (i.e., 16) was extracted from the BCF matrix, and this 16-factor model also had a good model fit although not as good as the co-citation results.
In both cases, we also produced an 11-factor model as in Zhao & Strotmann (2008b) in order to ease comparison of results from the current dataset (2006-2010) with those from the 2001-2005 dataset in Zhao & Strotmann (2008b) for the purpose of studying the evolution of the intellectual structure of the IS field.
The model fits of these four models are provided in Table 1. For example, the 16-factor model extracted from the co-citation matrix explains 83.7% of the total variance, and the differences between observed and implied correlations were smaller than 0.05 for the most part (close to 100%). About 98.7% of the communalities are above 0.6.
Visualization of factor structures
We applied an oblique rotation (SPSS Oblimin) to these factor models in the factor analysis, resulting in a pattern matrix and a structure matrix. The pattern matrix tends to be very sparse after low loadings (e.g., those smaller than 0.3) are removed, as a loading here represents an author’s unique contribution to a specialty and authors tend to be quite focused in their research. The structure matrix, on the other hand, is often quite dense and authors tend to load moderately or strongly on several specialties in this matrix because loadings here represent a combination of correlations between
specialties and authors’ unique contributions to specialties and specialties within a research field are fundamentally interlinked. For example, CroninB has loadings greater than 0.3 in seven factors in the structure matrix, but in none of the factors in the pattern matrix in the ABCA results presented later in this paper. He appears to have cited from such a wide range of literature that he does not get placed strongly as a member in any one of the specialties in the IS field, but he does cite enough papers that others cite in seven specialties to underscore the correlations between these specialties.
Both the pattern and structure matrices thus provide important information about the structure of the field: the pattern matrix shows the memberships of authors in specialties while the structure matrix indicates the interrelationships between specialties. They are visualized in the present study in a single two-dimensional map, which combines the informative features of both matrices and other important information (citation counts), and improves the visualization technique introduced in Zhao & Strotmann (2008a) and used in most of their later studies on ACA and ABCA. The central idea of this technique is to directly visualize the factor analysis results as a bipartite network of authors and
factors (specialties) linked to each other according to the loadings of authors on the factors.
For a combined visual representation of the structure, we use the densely connected structure matrix to automatically position the factor and author nodes in relation to each other in order to obtain a stable (and therefore potentially meaningful) layout of the visual map, and the sparse pattern matrix to draw lines connecting author and factor nodes in order to clearly show authors’ memberships in specialties. The width of a line that connects an author with a factor is proportional to the loading of this author on this factor in the pattern matrix, as is its gray-scale value, with wider and darker lines signifying higher loadings (thus stronger memberships). We have found it useful to retain the structure matrix links as a muted background to the main visualization, however, especially in the case where the pattern matrix network disintegrates into several disconnected components.
As before, authors are represented by square nodes and factors by circular nodes in these maps. The color of an author node represents the number of specialties to which this author belongs (i.e., how many factors this author loads on in the pattern matrix), with yellow, green, red, and blue indicating one, two, three, and four specialties
respectively. The color of a factor node is not meaningful for the purpose of representing features of intellectual structures.
The size of an author node now corresponds to the total citation count of the author (instead of the author’s loadings), and the size of a factor node is now determined by the sum of the citation counts of all authors who load sufficiently on its factor (i.e., with a value of 0.3 or higher in the pattern matrix in this case), weighted by their loadings. For example, if an author has a citation count of 100 and loads 0.8 on a factor, this author
adds 100x0.8=80 to the sum representing this factor’s approximate total citation count. The weighting takes into account that an author may contribute to several specialties, but only the part of the author's oeuvre that corresponds to this specialty should be counted. Node sizes now show the relative prominence of authors and specialties measured by citation counts, an obviously important feature of the intellectual structure of a research field.
Combining the informative features of both the pattern and structure matrices as well as citation impact into one map, the visualization now is a single uncluttered map with a stable layout. The map shows visually more clearly the level of impact of each author (author node size), the prominence of each specialty (factor node size), the
interrelationships between specialties and authors (map layout and node positions), and the memberships of authors in specialties (connecting lines).
Unfortunately, node colors of these figures are not available in print, and a few author names may be difficult to read in crowded areas. For detailed examination of the maps, readers are referred to the online copy of this paper, which includes high-resolution full-color versions of these figures.
Interpretation of results
We interpret large factors as specialties and small factors as topics. Factors are labeled upon examination of articles written by authors who load primarily in each factor. A factor is labeled as undefined (UD) if all loadings in this factor are lower than 0.7, although an attempt may still be made at interpreting it.
In the tables below, the highest loading of a factor indicates its distinctiveness. The size of a factor is the number of authors who load primarily on this factor in the pattern matrix, and this number divided by the total number of authors analyzed estimates the
relative size (%Size) of the factor. The size of a factor node (circle) in the maps, however, is the weighted sum of the citation counts of all authors in this factor as discussed above. Both sizes indicate the relative prominence of a specialty, one by the number of authors working on the specialty and the other by these authors’ collective citation impact.
Research front in IS 2006-2010
Figure 1 visualizes the 16-factor model (after an oblique rotation) extracted from the BCF matrix, showing the structure of the research front of the IS field as seen from the ABCA. Table 2 is a summary of the factors’ labels, sizes and distinctiveness.
[Insert Figure 1 here] [Insert Table 2 here]
Figure 1 shows that the two-camp structure of the IS field that was observed in several previous studies is still clearly visible in the research front of IS 2006-2010, with strong and dense connections within each camp but weak and sparse ones between camps. The Knowledge domain analysis (KDA) camp (top-left) is concerned with quantitative studies of science and technology and the Information retrieval (IR) camp (bottom-right) with information representation, retrieval, users and use.
The KDA camp is dominated by research on the h-index (in the context of Bibliometric distributions and of Research evaluation), followed by research on Mapping of science and Webometrics, and completed by three small areas of research: Patenting & patent analysis, Citation content & context analysis, and an area that cannot be defined clearly. The latter two small research areas are closely related to research on h-index related topics as seen from their close locations in Figure 1. The undefined area appears to be
concerned with Open Access and Bibliometrics such as the impact of open access resources and bibliometric studies using open access data sources (e.g., arxiv.org). Research on the h-index is also by far the most prominent area of research in the entire field of IS 2006-2010. It appears that this “clever find” (Rousseau, Garcia-Zorita, & Sanz-Casado, 2013, p. 294) made by J.E. Hirsch in 2005 for measuring individuals’ lifetime achievements (Hirsch, 2005) quickly generated a huge amount of attention from IS researchers, including some highly influential authors (large square nodes in Figure 1) in the areas of research evaluation and bibliometric distributions (e.g., EggheL, GlanzelW). Research has attempted to evaluate its effectiveness as an indicator for research
evaluation, to improve on it by proposing various variants such as g-index and r-index, and to extend its use from measuring individuals to other types of objects such as journals and institutions.
In the IR camp, research on information behavior, especially on information seeking in various contexts and everyday information seeking, attracted the largest number of researchers. The citation impact of this area, however, is lower (i.e., a smaller size in Figure 1) than that of the Relevance area which has almost 50% fewer researchers. In other words, as shown clearly in Figure 1, IS researchers with high citation impact (large square nodes in Figure 1) were not working primarily on information behavior, but on relevance and theoretical foundations in 2006-2010. Interestingly, the only exception was Spink whose citation impact was the highest in the IR camp. Similarly, there were a good number of researchers (9) working in the IR systems specialty, but they all appear to have low citation impact in IS. This specialty, therefore, appears much smaller in Figure 1 than the IS Theories and Foundations specialty that has the same number of researchers.
Small areas of study in the IR camp included Virtual communities, Web searching, Use of e-journals & other e-resources, and Image representation & retrieval. Research on virtual communities appears only related to information seeking, searching and use (i.e., soft IR) as seen from the links in Figure 1, but research on image representation and retrieval appears to have connections to both soft IR and hard IR (i.e., IR systems). It is interesting to observe that the IR systems specialty has moved far away from the rest of the IR camp towards the KDA camp, bridging between the two camps in fact. Research on IS theories and foundations, on the other hand, appears located largely in the IR camp although it would be expected to integrate the entire IS field.
As seen clearly in Figure 1, all of the 150 core authors studied here have strong memberships (i.e., loadings greater than 0.3) in only one or two research areas (corresponding to yellow and green square nodes in Figure 1 respectively), except BrownC (red square) who belongs to three and CroninB (turquoise square) who appears to strongly focus on none.
Among the authors who have multiple memberships, almost all belong to only one of the two camps, with only nine exceptions: AhlgrenP, OppenheimC, PintoM, GalvezC,
LewandowskiD, PeruginiS, FryJ, DavisP, and BrownC. Most of these nine authors
connect the Webometrics and Open Access & Bibliometrics specialties in the KDA camp with the IR systems and Use of e-journals & other e-resources ones in the IR camp. It thus appears that the two camps were connected largely through Web-related topics. It is interesting to observe that as an active researcher Howard White has been placed in the Relevance specialty during 2006-2010, even though he has always been (and still is in this period as shown below) recognized by citation analysis as a leading author in the Mapping of science specialty for his pioneering and continuous work on ACA. This
placement actually makes good sense considering his actual publications during this time period, most of which study relevance theory as a central concept unifying Bibliometrics and IR.
It appears that ABCA has worked quite well capturing and showing characteristics of authors’ research contributions and of the research front in IS 2006-2010, and better than ACA recognizing authors’ contributions in different areas during different time periods.
Knowledge base in IS 2006-2010
Figure 2 visualizes the 16-factor model (after oblique rotation) extracted from the co-citation matrix, showing the structure of the knowledge base of the IS field. Table 3 provides the factors’ labels, sizes, and their distinctiveness.
[Insert Figure 2 here] [Insert Table 3 here]
As is to be expected, the structure of the knowledge base of IS 2006-2010 is largely consistent with that of the research front in terms of the two-camp structure and of major specialties identified as well as their relative prominence, although the specialties
sometimes do have different size, scope and emphasis. There are also a few small research areas that appear in either the knowledge base or the research front but not both: Virtual communities, Citation content & context analysis, and Web searching in the research front, and Network science, Text categorization, and Abstracting in the
knowledge base.
Research areas that appear only in the knowledge base represent ideas imported from outside of IS. Network science is a multi-disciplinary research field concerned with the
analysis of all types of large and complex systems that can be modeled as networks. Results from this field appear to have primarily influenced IS researchers related to Mapping of science but also to Webometrics and Patent analysis of innovations as seen from Figure 2. Text mining, mostly text categorization and primarily using machine learning technologies, is shown to have mostly influenced research related to IR
systems (hard IR), while Abstracting appears to be closely related to soft IR as authors in this area are mostly concerned with the quality and structure of abstracts in academic writing rather than automation of abstracting.
Examples of specialties with different scope and emphasis between research front and knowledge base include h-index, image retrieval and patent analysis. The H-index specialty is almost completely focused on the h-index in the research front but also includes research on other bibliometric distributions in the knowledge base. Research related to patent analysis of innovations appears to have drawn on knowledge that goes beyond patent analysis to include how science and innovation systems work in general. Similarly, research on image representation and retrieval appears to have also drawn on usability studies. We labeled the corresponding specialties in the knowledge base
accordingly.
Substantial differences in size between knowledge base and research front occur with the Information behavior, Bibliometric distributions (h-index), Webometrics, and IR systems specialties.
The Information behavior specialty is much stronger in the knowledge base than its presence in the research front (19% vs. 11% in Tables 2 & 3). It apparently provided a solid knowledge base to not only research on information behavior itself but also to
research in other specialties such as Virtual communities, Web searching, Use of e-journals & other e-resources, and Image representation & retrieval.
Hard IR also has a stronger presence in the knowledge base than in the research front. IR systems is 10% and 6% of the IS whole respectively, and the Text categorization area is 3% of the knowledge base but does not appear as a separate research area in the research front.
By contrast, Webometrics has a weaker presence in the knowledge base than in the research front (6% vs. 9.3%). However, research on Webometrics appears to also have drawn on network science in the knowledge base, as evidenced by the links between the two in Figure 2.
Research on the h-index appears to have a weaker presence in the knowledge base than in the research front as well. The number of researchers is 11% and 17% of the IS whole respectively, and its citation impact completely dominates in the research front but has a few competitors in the knowledge base (e.g., Information behavior). It appears that research on the h-index became the emphasis of two specialties during 2006-2010 that were separate before, namely, the Bibliometric distributions specialty, which
changed focus towards testing, critiquing, extending and improving the h-index itself, and the Research evaluation one, which shifted focus to the use (and abuse) of the h-index in actual research evaluations. This common current theme was apparently strong enough to pull together these two specialties to form the most prominent research area in the research front. In the knowledge base, however, these two specialties remain separate. H-index related research is placed in the knowledge base as part of the Bibliometric distributions specialty, and Research evaluation is a separate specialty of a good size (6%).
It is interesting to observe that the specialty in which research on h-index was the focus had almost 80% fewer researchers but a higher citation impact than the information behavior specialty. In addition, its citation impact was much higher than the Mapping of science and IR systems specialties although the number of researchers working in these three specialties is only slightly different. Clearly, the intense and strong research on h-index in 2006-2010 manifests itself here as well.
The two loosely connected camps are clearly visible in the knowledge base as well. Bridging between the two camps is provided primarily by IS theories and foundations, but also by the Use of e-journals and other e-resources specialty in the KDA camp and the Abstracting research area in the IR camp. Interestingly, while Use of e-journals and other e-resources appears more closely related to the KDA camp in the knowledge base (Figure 2), it belongs to the IR camp in the research front (Figure 1). In other words, research in this area drew more on earlier information behavior-related research in 2006-2010, but was used more in current knowledge domain analysis research during that time period, which is an interesting way to bridge the two camps.
Authors who have strong membership in both the IR camp and the KDA camp are even rarer in the knowledge base than in the research front. In other words, authors are normally recognized only for their contributions in one of these two parts of IS even if they have contributed to both. As is to be expected, there are more authors who were influential in more than one area than those who worked in more than one (non-yellow squares in the maps). While most of the eight authors who were influential in three areas (red squares) are located in the IR camp, authors who stand out in citation impact
(GarfieldE, LeydesdorffL, EggheL, and GlanzelW) are all in the KDA camp. Authors with lower levels of citation impact are spread quite evenly in the entire IS field.
Evolution of IS from 2001-2005 to 2006-2010
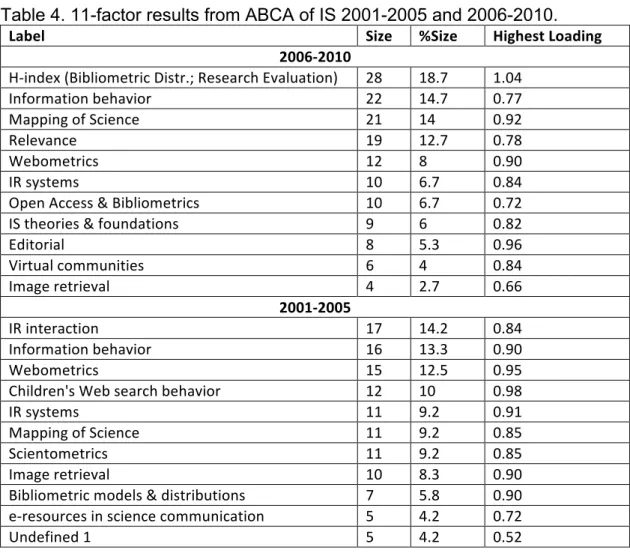
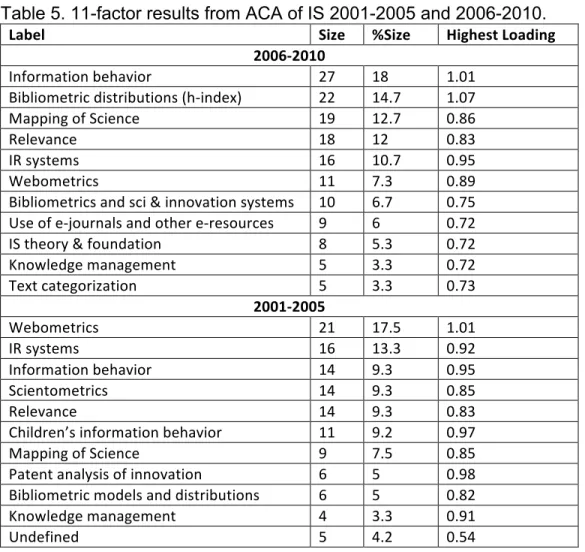
Table 4 is a summary of the factors, their sizes and distinctiveness of the 11-factor model extracted from the BCF matrix as compared with corresponding previously published results for the 2001-2005 time period (Zhao & Strotmann, 2008b). Table 5 shows the corresponding information for results from the co-citation matrix. The “%Size” column is the size relative to the total number of authors analyzed, i.e., 150 for 2006-2010 and 120 for 2001-2005.
[Insert Table 4 here] [Insert Table 5 here]
As seen from Tables 4 and 5, the IS field has changed quite substantially from 2001-2005 to 2006-2010, especially regarding the research front.
Research front
Three research areas emerged (Open Access & Bibliometrics, IS theories &
foundations, and Virtual communities), and three dissolved as separate research areas (Children's Web search behavior, Scientometrics / Research evaluation, and
E-resources in science communication). Two existing research areas have grown substantially smaller (Webometrics, Image representation & retrieval) and one
substantially larger (Mapping of science), i.e., by more than 50% in terms of percentage in the IS whole. In addition, as analyzed earlier, research on h-index emerged strongly, which pulled two otherwise separate specialties (Bibliometric distributions and Research evaluation) together into the most prominent research area accounting for 19% of the IS whole.
It is interesting to observe the continuing strong effect of information technology on IS research. In 2001-2005 when the Web was changing the way how information was created, transmitted, searched and used both in everyday life (by children, for example) and in science, it was clearly important to study how people were adapting, such as how children were using the Web and how scientists were utilizing e-resources in their work. Research in these areas became so strong that these became noticeable as separate research areas in the analysis (e.g., Children’s Web search behavior, E-resources in science communication). As life and work became centered around the Web and as e-resources became more and more the norm, these areas of research declined gradually and lost their prominence as separate specialties in 2006-2010. The emergence of the Virtual communities specialty may be another example of this effect. Internet technology was changing the way people communicate, again both in everyday life and in science, which has raised enough significant questions about how people behave and interact differently in virtual communities as compared to “real” life that they apparently attracted sufficient research interest to form a separate research area in 2006-2010.
It is also interesting to observe that the specialty labeled Scientometrics dissolved as a separate specialty on the one hand and that research on the h-index on the other hand recruited the cores of Scientometrics (i.e., Research evaluation) and of Bibliometric distributions to become the most prominent research area in IS 2006-2010. It appears that research in the Scientometrics area was waiting for breakthrough ideas on the one hand, and was feeling the pressures of a huge demand for practical tools for research evaluation on the other, and therefore moved immediately and almost completely to a focus on the h-index once this “clever find” was made in 2005 as a simple way to measure individual scientists’ lifetime achievements.
While the “h-bubble” may burst anytime (Rousseau, Garcia-Zorita, & Sanz-Casado, 2013, p. 294), which would likely result in Research evaluation and Bibliometric distributions going back to being separate specialties, the more than 50% increase in research on Mapping of science appears to have been a result of intellectual
achievements in several research areas including network science, information visualization and natural language processing. Research in this area may thus well sustain.
Overall in the IS research front from 2001-2005 to 2006-2010, the IR camp appears to have gained a stable core of soft IR, experienced a further decline in hard IR research, and added some “current” topics (or perhaps bubbles?). The stable core of soft IR includes Information behavior, Relevance, and user-system interaction in IR, and accounts for about 28% of IS in both time periods. The hard IR research includes IR systems and parts of Image representation & retrieval. Its decline had been observed for previous time periods (Zhao & Strotmann, 2008a; 2008b), and was from 9.2% to 6.7% this time. “Current” topics are those that become prominent of their own for a while before merging again into the more general areas, such as Children’s Web search behavior in 2001-2005 and, perhaps, Virtual communities in 2006-2010.
Meanwhile, the KDA camp appears to have seen a relative decline in Webometrics (from 12.5% to 8%), experienced a substantial growth in the areas of Mapping of science (from 9.2% to 14%), Open Access & Bibliometrics (new at 6.7%), and H-index, and refocused research in the areas of Bibliometric distributions and Research
evaluations on h-index related topics. Research in the area of IS theory and foundations, which as a separate area of research was observed in earlier time periods but not in 2001-2005 (White & McCain, 1998; Zhao & Strotmann, 2008b), became strong (6%)
and distinct enough to form a separate specialty again in 2006-2010, which is encouraging as a sign of increasing work on integrating the IS field.
Knowledge base
Changes in the knowledge base of IS from 2001-2005 to 2006-2010 are also
substantial, but there are fewer such changes than with the research front, which shows the nature of these two aspects of intellectual structures of research fields: the
knowledge base remains relatively stable and evolves slowly while the research front moves more quickly and experience more dynamic changes.
Three research areas (Use of e-journals and e-resources, IS theories & foundations, and Text categorization) newly emerged in 2006-2010, and one existing research area (Mapping of science) grew substantially by almost 70% in terms of percentage in the IS total (from 7.5% to 12.7%). Smaller growth occurred in the areas of Relevance and Patent analysis of innovations (from 9.3% and 5% to 12% and 6.7% respectively). The Webometrics specialty became substantially smaller from 17.5% as the most prominent one in 2001-2005 to 7.3% as the 6th of the total of 11 specialties identified in 2006-2010. Early indications for this relative decline had been observed in Zhao & Strotmann (2008b) based on data for 2001-2005, and is evidenced strongly here during 2006-2010. It appears that research in this area has become stable as the heat gained from the “invasion” of the Web cooled down. However, the decline caused by the
bursting of the initial bubble is showing signs of having abated, as discussed in the next section, and a more steady growth in research in this field may have resumed.
Another substantial and interesting change between the two 5-year time periods is that two mergers occurred, one appearing to have been due to a strong new common emphasis in research and the other, paradoxically, to the loss of a research focus. As
analyzed above, research on the h-index emerged strongly, which pulled two otherwise separate specialties (Bibliometric distributions, Research evaluation) together into the most prominent active research area, hence the disappearance of the Scientometrics (research evaluation) specialty and the exploding of the Bibliometric distributions (h-index) specialty in the knowledge base. By contrast, a focus in information behavior research in 2001-2005 on the population of Children appears to have lost strength in 2010, which led to the Children’s information behavior specialty dissolving in 2006-2010 and to the general Information behavior specialty growing to become the most prominent. This observation is supported by the fact that several authors who loaded highly in the Children specialty in 2001-2005 were placed with moderate loadings into the general Information behavior specialty in 2006-2010.
Research trends
Research on mapping of science using co-citation analysis or bibliographic coupling analysis has been successful in studying intellectual structures of research fields for past time periods, but has yet to find good ways to forecast future trends in intellectual structure.
Zhao and Strotmann (2008b) introduced ABCA, and experimented for the first time with predicting future trends by combining ABCA and ACA of the same time slice.
Specifically, as ACA reveals the structure of highly influential authors on a research field, i.e., the field’s past, and ABCA that of highly active researchers, i.e., the field’s presence, a specialty may be in the process of growing, or declining, respectively, if its size in ABCA is larger, or smaller, respectively, than in ACA. Using IS 1996-2000 data, it found that predictions might have been possible for IS 2001-2005 by this rule of thumb.
Applying this rule to data of IS 2001-2005, that study observed that IR systems and Webometrics were both going through a phase of decline, and predicted that both would be found to be less prominent in 2006-2010, the period examined in the present study. This prediction appears to be supported by data of IS 2006-2010 for both specialties. The IR systems specialty declined from 9.2% in 2001-2005 to 6.7% in 2006-2010 (or by about one quarter), and Webometrics from 12.5% to 8% (i.e., by one third) in the
research front (Table 4). We will therefore dare to make the same type of trend analysis based on the results from ACA and ABCA of IS 2006-2010. We will use the more
detailed structure as summarized in Tables 2 and 3 for this purpose, and restrict our analysis to large and distinct specialties and to large differences in size, considering that small or vague factors and small differences may not provide clear and reliable
information. Readers may perhaps wish to analyze other specialties in a similar way but with lower levels of confidence.
The IR systems specialty appears to be continuing its decline as its size in the research front is substantially smaller than in the knowledge base in 2006-2010 (6% in Table 2 vs. 10% in Table 3). The difference in sizes is even greater for the information behavior specialty (11% vs 19%), suggesting that research in this area may be declining as well and perhaps more sharply.
The Webometrics specialty on the other hand is 9.3% and 6% of the IS whole in the research front and in the knowledge base, respectively, and appears to be growing again after a period of decline from 2001-2005 to 2006-2010. Part of this is likely the resumption of a typical steady growth pattern once the initial bubble has burst, but given the considerable growth by about one half in a five-year period, there must be other contributing factors involved. The impetus provided by a growing interaction with the
emerging Web science field is apparent as one of these factors from our analysis. The interdisciplinary field of Web Science aims to consolidate a wide range of research views of the Web – both as a communication technology and as the complex system of social and of knowledge spaces that emerges from its ubiquitous presence.
Conclusions
Combining ABCA and ACA, the present paper studied the intellectual structure of IS 2006-2010 in terms of its research front and knowledge base, and examined the changes in this structure from 2001-2005 to 2006-2010. Finding that research trend predictions derived previously from 2001-2005 data are indeed borne out by the analysis of 2006-2010 data, it also made the same type of predictions regarding research trends in IS for the near future (e.g., 2011-2015).
From 2001-2005 to 2006-2010, the IR part of IS appears to have a stable core of soft IR, a further decline in hard IR research, and some “current” topics that become prominent of their own for a while before merging again into the more general areas, such as Children’s Web search behavior in 2001-2005 and, perhaps, Virtual communities in 2006-2010. Meanwhile, the Knowledge domain analysis part of IS appears to have experienced a relative decline in Webometrics and a substantial growth in the areas of Mapping of science and h-index that appear to have been two highlights of IS 2006-2010. Citation context and content analysis emerged as a separate research area during this time period. After a decade or so of fading into the background, the IS Theoretical foundations have again become a major element in the intellectual structure of the field. Bridging between the two largely separated parts of IS appears to be forged mainly through research on Web-related topics and through a common interest of the two
camps in different aspects of scholarly communication that draw on sociologists of science and innovation like Kuhn and Latour.
Web technology apparently continues to drive developments in IS, which is true for both the knowledge base and ongoing research activity in the field.
For the knowledge base of IS, the strong impact of the Web manifests itself in the emergence of network science and text categorization as influential research areas. As a result, a significant broadening of close interactions with external research fields became visible. Adding network science to the knowledge base creates direct strong connections to the general complex systems community, and adds researchers from physics and biology who have been influential in network science to the traditional roster of social scientists on the Knowledge domain analysis side and cognitive and computer scientists on the Information retrieval side of IS. The largely machine-learning-based text categorization research area broadens the traditional ties of IS to computer science. For ongoing research activities, the driving force of Web technologies is most obvious in the emergence of a Virtual communities research area. The free and simple access to research information provided by the Web has almost certainly been a major factor in creating demand for an easily determined and effective research performance metric for individuals and institutions alike. The focus on the h-index apparent in IS 2006-2010 certainly derives to a significant extent from this demand. The re-generalization of information behavior studies observed in the present study can also be attributed to the near-total ubiquity that the Web has attained as an information source during this time period.
Looking into the near future, the IR systems specialty appears to be declining even further in 2006-2010 continuing the trend from previous time periods, and research on
information behavior appears to be going through a phase of decline as well. Both specialties would therefore likely be found to be less prominent in the near future (e.g., in 2011-2015). The Webometrics specialty on the other hand appears to be growing again in 2006-2010 after a period of decline from 2001-2005 to 2006-2010, due perhaps in part to its contributions to the emerging Web science.
It appears that ABCA has worked quite well capturing and showing characteristics of authors’ research contributions and of the research front in IS 2006-2010. It appears better at recognizing authors’ contributions to different areas during different time periods compared to ACA. Combining ABCA and ACA provides the possibility of
studying research trends, which was first proposed and examined in Zhao & Strotmann (2008b), and borne out strongly in the present study. We hope that future studies will further test whether combining ABCA and ACA is indeed an effective citation analysis method to study major future research trends in addition to past intellectual structures. The improved visualization method used in this paper provides concise, uncluttered yet informative science maps. These maps show clearly the level of impact of each author, the prominence of each specialty, the interrelationships between specialties, and the membership of authors in specialties, from which we gleaned different interesting aspects of the story of information science 2006-2010.
References
Bates, M. J., & Maack, M. N. (Eds.). (2010). Encyclopedia of Library and Information Sciences, 3rd Ed. New York: CRC Press.
Chen, C., Ibekwe-SanJuan, F., & Hou, J. (2010). The structure and dynamics of cocitation clusters: A multiple-perspective cocitation analysis. Journal of the
American Society for Information Science and Technology, 61, 1386-1409. Cornelius, B., Landström, H., & Persson, O. (2006). Entrepreneurial studies: The
dynamic research front of a developing social science. Entrepreneurship Theory and Practice, 30, 375-398.
Finlay, C.S., Sugimoto, C.R., Li, D., Russell, T.G. (2012). LIS dissertation titles and abstracts (1930-2009): Where have all the librar* gone? Library Quarterly, 82, 29-46. Hair, J.F. Anderson, R.E., Tatham, R.L., & Black, W.C. (1998). Multivariate Data Analysis
(5th edition). Upper Saddle River, NJ: Prentice Hall.
Hirsch, J. E. (2005). An index to quantify an individual’s scientific research output. Proceedings of the National Academy of Sciences of the United States of America, 102, 16569–16572.
Klavans, R., & Boyack, K.W. (2011). Using global mapping to create more accurate document-level maps of research fields. Journal of the American Society for Information Science and Technology, 62, 1-18.
Larivière, V., Sugimoto, C.R., & Cronin, B. (2012). A bibliometric chronicling of library and information science's first hundred years. Journal of the American Society for Information Science and Technology, 63, 997-1016.
Lu, K., & Wolfram, D. (2012). Measuring author research relatedness: A comparison of word-based, topic-based, and author cocitation approaches. Journal of the American Society for Information Science and Technology, 63, 1973–1986.
McCain, K.W. (1990). Mapping authors in intellectual space: A technical overview. Journal of the American Society for Information Science, 41(6), 433-443.
Milojević, S., Sugimoto, C.R., Yan, E., Ding, Y. (2011). The cognitive structure of Library and Information Science: Analysis of article title words. Journal of the American Society for Information Science and Technology, 62, 1933-1953.
Persson, O. (1994). The intellectual base and research fronts of JASIS 1986- 1990. Journal of the American Society for Information Science, 45, 31-38.
Rousseau, R., Garcia-Zorita, C., & Sanz-Casado, E. (2013). The h-bubble. Journal of Informetrics. 7, 294-300.
Saracevic, T. (2010). Information Science. In M. J. Bates, & M. N. Maack (Eds.), Encyclopedia of Library and Information Sciences (pp. 2570-2582), 3rd Ed. New York: CRC Press.
Strotmann, A., & Zhao, D. (2012). Author name disambiguation: What difference does it make in author-based citation analysis? Journal of the American Society for
Information Science and Technology, 63, 1820-1833.
Sugimoto, C.R., Li, D., Russell, T.G., Finlay, S.C., & Ding, Y. (2011). The shifting sands of disciplinary development: Analyzing North American library and information science dissertations using latent dirichlet allocation. Journal of the American Society for Information Science and Technology, 62, 185-204.
White, H. D. (1990). Author co-citation analysis: Overview and defense. In C. L.
Borgman (Ed.), Scholarly Communication and Bibliometrics (pp. 84-106). Newbury Park, CA: Sage.
White, H. D., & McCain, K.W. (1998). Visualizing a discipline: An author co-citation analysis of information science, 1972-1995. Journal of the American Society for
Information Science, 49, 327-355.
Yan, E., & Ding, Y. (2012). Scholarly network similarities: How bibliographic coupling networks, citation networks, cocitation networks, topical networks, coauthorship networks, and coword networks relate to each other. Journal of the American Society for Information Science and Technology, 63, 1313-1326.
Zhao, D., & Strotmann, A. (2008a). Information Science during the first decade of the Web: An enriched author co-citation analysis. Journal of the American Society for Information Science and Technology, 59, 916-937.
Zhao, D., & Strotmann, A. (2008b). Evolution of research activities and intellectual influences in Information Science 1996-2005: Introducing author bibliographic
coupling analysis. Journal of The American Society for Information Science and
Technology, 59, 2070-2086.
Zhao, D., & Strotmann, A. (2008c). Comparing all-author and first-author co-citation analyses of Information Science. Journal of Informetrics, 2, 229-239.
Zhao, D., & Strotmann, A. (2011a). Counting first, last, or all authors in citation analysis: A comprehensive comparison in the highly collaborative Stem Cell research field.
Journal of The American Society for Information Science and Technology, 62, 654
-676.
Zhao, D., & Strotmann, A. (2011b). Intellectual structure of Stem Cell research: A comprehensive author co-citation analysis of a highly collaborative and multidisciplinary field. Scientometrics, 87, 115-131.
Table 1. Factor models and their model fits. Input matrix Factor
model Total variance explained % |nonredundant residuals| > 0.05 Communalities > 0.6 Co-‐citation counts 16-‐factor 83.7% 0% 98.7%
BCFs 16-‐factor 75.3% 4% 90.0%
Co-‐citation counts 11-‐factor 79.4% 2% 94.0%
BCFs 11-‐factor 69.2% 10% 74.7%
Table 2. 16-factor results from ABCA of IS 2006-2010.
Label Size %Size HighestLoading
H-‐index (Bibliometric Distr.; Research Evaluation) 25 16.7 1.024
Information Behavior 16 10.7 0.914
Mapping of Science 15 10.0 0.886
Webometrics 14 9.3 0.897
Relevance 11 7.3 0.736
IR systems 9 6.0 0.914
IS Theories & Foundations 9 6.0 0.869 UD (Open Access & Bibliometrics) 8 5.3 0.600
Journal Editors 8 5.3 0.963
Virtual Communities 6 4.0 0.877
Citation Content & Context Analysis 6 4.0 0.837
Web Searching 6 4.0 0.778
Use of e-‐journals & other e-‐resources 6 4.0 0.777 Patenting and Patent Analysis 6 4.0 0.744 Image Representation & Retrieval 4 2.6 0.894
UD 1 0.7 0.511
Table 3. 16-factor results from ACA of IS 2006-2010.
Label Size %Size HighestLoading
Information Behavior 28 18.7 1.02
Mapping of science 18 12 0.77
Bibliometric Distributions (h-‐index) 16 10.7 1.08
IR systems 15 10 0.99
Relevance 11 7.3 0.82
Webometrics 9 6 0.91
Research Evaluation 9 6 0.69
Use of e-‐journals and other e-‐resources 8 5.3 0.80 Bibliometrics & Science and Innovation Systems 8 5.3 0.73
Network Science 6 4 0.76
Image Representation & Retrieval 5 3.3 0.82 UN (IS Theories & foundations) 5 3.3 0.58
Text Categorization 4 2.7 0.95
Abstracting 3 2 0.90
Knowledge Management 3 2 0.89
Table 4. 11-factor results from ABCA of IS 2001-2005 and 2006-2010.
Label Size %Size Highest Loading
2006-‐2010
H-‐index (Bibliometric Distr.; Research Evaluation) 28 18.7 1.04
Information behavior 22 14.7 0.77
Mapping of Science 21 14 0.92
Relevance 19 12.7 0.78
Webometrics 12 8 0.90
IR systems 10 6.7 0.84
Open Access & Bibliometrics 10 6.7 0.72 IS theories & foundations 9 6 0.82
Editorial 8 5.3 0.96 Virtual communities 6 4 0.84 Image retrieval 4 2.7 0.66 2001-‐2005 IR interaction 17 14.2 0.84 Information behavior 16 13.3 0.90 Webometrics 15 12.5 0.95
Children's Web search behavior 12 10 0.98
IR systems 11 9.2 0.91
Mapping of Science 11 9.2 0.85
Scientometrics 11 9.2 0.85
Image retrieval 10 8.3 0.90
Bibliometric models & distributions 7 5.8 0.90 e-‐resources in science communication 5 4.2 0.72
Table 5. 11-factor results from ACA of IS 2001-2005 and 2006-2010.
Label Size %Size Highest Loading
2006-‐2010
Information behavior 27 18 1.01
Bibliometric distributions (h-‐index) 22 14.7 1.07
Mapping of Science 19 12.7 0.86
Relevance 18 12 0.83
IR systems 16 10.7 0.95
Webometrics 11 7.3 0.89
Bibliometrics and sci & innovation systems 10 6.7 0.75 Use of e-‐journals and other e-‐resources 9 6 0.72 IS theory & foundation 8 5.3 0.72
Knowledge management 5 3.3 0.72 Text categorization 5 3.3 0.73 2001-‐2005 Webometrics 21 17.5 1.01 IR systems 16 13.3 0.92 Information behavior 14 9.3 0.95 Scientometrics 14 9.3 0.85 Relevance 14 9.3 0.83
Children’s information behavior 11 9.2 0.97
Mapping of Science 9 7.5 0.85
Patent analysis of innovation 6 5 0.98 Bibliometric models and distributions 6 5 0.82
Knowledge management 4 3.3 0.91
Undefined 5 4.2 0.54