in Human Occipito-Temporal Cortex? An fMRI Study
a low level baseline such as a fixation point in an other-wise blank screen.
The existence of partial responses to nonpreferred
Mona Spiridon1and Nancy Kanwisher1 Department of Brain and Cognitive Sciences Massachusetts Institute of Technology, NE20-464
stimuli is open to two different interpretations. Ac-Cambridge, Massachusetts 02139
cording to one, the partial response to a shoe in the FFA (for example) encodes information about the shoe and forms part of the neural representation of the shoe.
Summary
On this view, the information about shoes would be encoded across much of extrastriate visual cortex,
in-We used fMRI to study the distribution of object
cate-cluding the FFA and other regions of cortex that respond
gory information in the ventral visual pathway.
Ex-selectively to things other than shoes.
tending the findings of Haxby et al. (2001), we find that
The alternative interpretation is that the response to
categories of stimuli can be distinguished by the
pat-a shoe in the FFA reflects the pat-autompat-atic but
epiphenom-tern of activation they elicit across this entire pathway,
enal engagement of this system by any visual stimulus,
even when the stimuli within a category differ in
view-with the resulting weak response not forming part of the
point, exemplar, or image format. However, regions
representation of the shoe. That is, even a specialized
within the ventral visual pathway are neither inter- face processor may have no way to “know” that a given changeable nor equipotential. Although the FFA and
input is not a face, other than to try processing it as
PPA permit excellent discrimination between pre- such. Thus, the mere existence of partial responses to ferred versus nonpreferred stimuli (e.g., faces-bottles nonpreferred stimuli in a category-selective region of and houses-bottles, respectively), we find that neither cortex does not guarantee that these responses encode region alone permits accurate discrimination between any information about the category of those stimuli, or pairs of nonpreferred stimuli (e.g., bottles-shoes). that any such information forms a critical part of the These findings indicate that the ventral visual pathway representation of those stimuli.
is not homogeneous, but contains some regions (in- In attempting to determine which of these interpreta-cluding FFA and PPA) that are primarily involved in the tions is correct, a great deal is at stake. If nonpreferred analysis of a single class of stimulus. responses play an important functional role in vision,
then the implications will extend far beyond the FFA and PPA, to encompass many if not most prior studies in
Introduction
visual neuroscience. It has been a standard assumption in both neuroimaging and neurophysiology that the best Central to any theory of visual object recognition is the
way to determine the function of a neuron or cortical question of how objects are internally represented. Here
region is by discovering the stimulus that elicits the we use fMRI to address one aspect of this question: are
highest response from it. If it turns out that nonpreferred some classes of objects represented in localized regions
responses carry as much information as preferred re-of extrastriate cortex specialized for representing
pri-sponses, that will call into question both the standard marily that class of object (Downing et al., 2001; Epstein
techniques and many of the prior results in the field of and Kanwisher, 1998; Kanwisher et al., 1997; McCarthy
visual neuroscience. et al., 1997; Puce et al., 1996), or are all objects
repre-How can we determine whether responses to nonpre-sented in distributed neural codes that span much of
ferred stimuli form part of the representation of those the occipitotemporal visual pathway (Haxby et al., 2001;
stimuli (as in the first account), or whether these re-Ishai et al., 1999)?
sponses are epiphenomenal and do not form part of the fMRI research emerging from a number of labs has
representation (as in the second account)? At a bare described focal regions of occipitotemporal cortex that
minimum, the representational account requires that respond selectively to certain categories of objects: the
nonpreferred responses contain information that could fusiform face area (FFA) for faces (Halgren et al., 1999;
in principle help discriminate between nonpreferred Kanwisher et al., 1997; McCarthy et al., 1997; Puce et
stimuli. This hypothesis is the focus of the present inves-al., 1996), the parahippocampal place area (PPA) for
tigation, and of the prior study by Haxby et al. (2001) places (Aguirre et al., 1998; Epstein et al., 1999; Epstein
that motivated it. Another critical requirement of the and Kanwisher, 1998; Haxby et al., 1994), and the
extra-representational account (considered further in the Dis-striate body area (EBA) for human bodies (Downing et
cussion) is that the discriminative information must actu-al., 2001). The definition of selectivity used here, adapted
ally get used when the subject makes category discrimi-from the neurophysiology literature (Tovee et al., 1993), nations.
is that a region of cortex must respond at least twice Haxby et al. (2001) asked whether nonpreferred re-as strongly to “preferred” re-as to “nonpreferred” stimuli. sponses across human occipitotemporal cortex carry Implicit in this definition is the fact that each of the information about the category of object seen. Their category-selective regions of cortex produces some strategy was as follows. Each subject was scanned with positive response to nonpreferred stimuli, compared to fMRI while he/she viewed eight different categories of stimuli. The resulting data from each subject were split in half, generating an activation map for each of the 1Correspondence: [email protected] (M.S.), [email protected] (N.K.)
Figure 1. Calculation of the Percentage of Correct Discrimination for a Given Pair of Stimulus Categories A and B
Each circle represents an activation map for a given category based on half the data col-lected for that category and subject. Thus A1 is the activation map for category A based on half the data and A2 is the activation map based on the other half.rrepresents the cor-relation coefficient between two activation maps. The percent correct discrimination be-tween categories A and B is 100% if all of the following inequalities are correct:rA1A2⬎rA1B2,
rA1A2⬎rA2B1,rB1B2⬎rA2B1,rB1B2⬎rA1B2. If only two or three of these relations are correct, the percent correct discrimination drops to 75% or 50%, respectively. The percent correct discrimination for all seven categories is the average of the percent correct discrimination over 84 pairwise comparisons.
eight stimulus categories from each of the halves of the would hold when different stimuli from the same cate-data (i.e., 16 activation maps). Next, one set of activation gory are compared. Haxby et al. (2001) argued against maps (from one half of the data) was used to predict a role for low level features in their findings by showing which category produced each of the eight activation similar results when one set of stimuli consisted of pho-maps generated from the other half of the data. This tographs, and the other consisted of line drawings. How-analysis was conducted by measuring the similarity (i.e., ever, this analysis used only three categories (faces, correlation) between each activation map in one set to houses, chairs), and these are among the most distinc-each of the eight activation maps in the other set (and tive in terms of their cortical response patterns, so it is vice versa). The measure of the discrimination accuracy not clear how this conclusion will generalize to other was based on all pairwise comparisons between identi- categories. Here we collected from each subject in a cal and nonidentical stimulus categories (for more de- single scanning session independent data sets in which
tails, see Figure 1). the subjects viewed stimuli from each category that
Several important findings emerged from this study. differed in category exemplar, viewpoint, and image for-First, activation maps could be quite accurately catego- mat (photographs versus line drawings). Our design en-rized based on the activation maps from the other half abled us to test the abstractness of the category infor-of the data, demonstrating that the patterns infor-of activation mation, by measuring categorization performance for each category were highly replicable. Second, and based on fMRI data sets collected from stimuli that more importantly, information about which stimulus cat- differed in viewpoint, exemplar, or stimulus format (Fig-egory produced a given activation map could be deter- ure 2).
mined even when the region of cortex that responded A second question addressed in the present study maximally to that category was omitted from the analy- was whether any categories of objects are “special” in sis. This led Haxby et al. (2001) to suggest that cortical the degree to which information about these categories regions maximally selective to a given category may
is concentrated within focal regions of cortex. The main not form a necessary part of the representation of that
analyses of Haxby et al. (2001) treat the different kinds category. Finally, even when only the region that
re-of category discriminations as equivalent. However, sponded maximally to a given category was included in
considerable evidence suggests that information about the analysis, performance in determining which of the
faces and places (including houses) may be represented nonpreferred categories had been presented was still
in a more localized fashion across cortex than other well above chance. These results indicate that
nonpre-stimuli. Here we addressed these questions by running ferred responses across occipitotemporal cortex are
separate analyses on discriminations involving faces systematic and replicable, and contain information
and houses, and also by running analyses on cortical about the category of object seen.
regions selectively responsive to faces and houses. However, the Haxby et al. (2001) study leaves several
Our results replicate some aspects of the findings of critical questions unanswered, which we address here.
Haxby et al. (2001), but nonetheless show that faces First, is the information present in the pattern of cortical
and places are “special” in three important respects. activation abstract enough to permit generalization to
First, discriminations involving faces and houses are new images of members of the same category? In the
more accurate than discriminations involving other cate-original Haxby et al. (2001) study, the same set of
gories. Second, focal regions of cortex that respond grayscale stimulus images was used to derive both
acti-selectively to faces (the FFA) and places (the PPA) are vation maps for each category. Therefore, the high
per-category specific not only in their mean response but formance on category discrimination might simply
indi-also in the sense that the profile of response across cate that fMRI is a reliable technique producing similar
the voxels within each region contributes little or no responses when viewing identical image sets. To
estab-information to discriminations between nonpreferred lish that each category produces a specific activation
stimuli. Third, we found no evidence for a focal or distrib-pattern in occipito-temporal cortex that does not simply
uted region that selectively discriminates one of the reflect similarities in low level features of those stimuli,
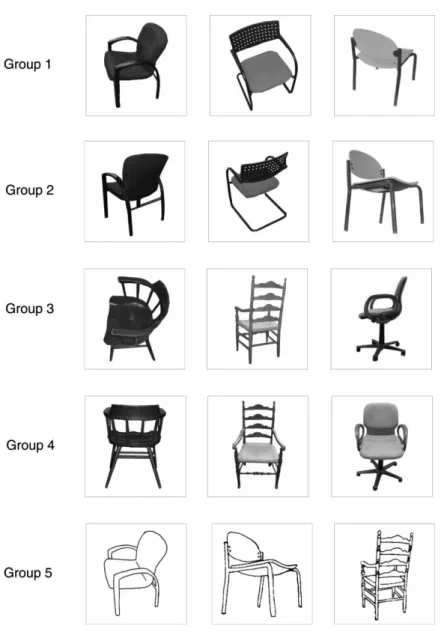
Figure 2. Examples of Stimuli for the Cate-gory “Chairs”
There are eight stimuli each in groups 1 to 4 and 32 stimuli in group 5. The other catego-ries are handled in the same fashion.
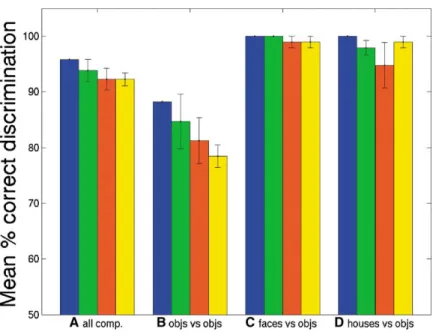
Results discriminations, and (3) “object versus object” discrimi-nations, i.e., the six discriminations involving each of the possible pairs from inanimate objects. Figure 3 shows
Analysis over All Visually Active Voxels
The average percent correct discrimination perfor- performance on each of these discrimination types (in-cluding the overall measure across all 84 discrimina-mance of all pairwise comparisons between the seven
categories is obtained using an analysis technique simi- tions, see Experimental Procedures section) as a func-tion of stimulus generalizafunc-tion, that is, whether the two lar to that of Haxby et al. (2001) (see Figure 1). Figure 3
(A, blue bar) shows that overall performance is quite sets of activation maps were based on stimulus images that were identical (as in the Haxby et al. [2001] study) high (mean across subjects: 96% of the pairwise
com-parisons correct), replicating the findings of Haxby et or that differed in viewpoint, exemplar, or image format (Figure 2).
al. (2001). Note, however, that pairwise percent correct
is an inflated measure. With seven categories, if the A two-way ANOVA across subjects found a significant main effect of discrimination type, F(3,15)⫽16.2, p⬍ correct category is ranked second out of the seven
alter-natives, not first, this would produce 86% pairwise .001, indicating higher performance for discriminations between faces versus objects and houses versus ob-correct.
In order to evaluate how performance varies across jects than for discriminations between pairs of small inanimate objects (see Figures 3B–3D). However, neither different types of category comparisons, we separately
scored performance on (1) “face versus object” discrimi- the main effect of stimulus generalization nor the inter-action of stimulus generalization by discrimination type nations, i.e., the four pairwise discriminations in which
faces are contrasted with each of the four small inani- reached significance, F(3,15)⫽1.3, p⬎0.3 and F(9,45)⫽ 1.7, p⬎0.1, respectively. Thus, performance does not mate object categories (bottles, shoes, scissors, and
Figure 3. Mean Percentage Pairwise Correct Discrimination and Standard Error across Six Subjects for Different Discrimination Types Based on All Visually Active Voxels The two sets of activation maps used in the analysis were produced from stimulus sets that were either identical grayscale photo-graphs (blue), photophoto-graphs with different viewpoints (green), photographs with differ-ent exemplars (red), or differdiffer-ent formats (i.e., photographs and line drawings) (yellow). Chance is 50%. The percent correct discrimi-nation is calculated from the average across: (A) all pairwise comparisons between the seven object categories, (B) all pairwise com-parisons between two small man-made ob-jects, (C) all pairwise comparisons between faces and small man-made objects, and (D) all pairwise comparisons between houses and small man-made objects.
maps are based on stimulus images that differ in view- One problem that arises in this analysis is that the number of voxels in each of these regions varies many-point, exemplars, or image format, compared to when
fold, so a measure of the information in each area con-the two sets of activation maps are based on subjects
founds the information per voxel with the number of viewing identical stimulus sets (as in the Haxby et al.
voxels in that area. To deal with this problem, we first [2001] study). However, a post hoc paired sample t test
measured performance as a function of the number of did indicate significantly lower performance for
discrimi-voxels included in the analysis for each of these areas nations between the four object categories when one
separately (see Figure 4). The voxels were randomly set of activation maps were based on photographs and
selected within each area. As expected, performance the other on line drawings, compared to when the two
increased with number of voxels. For the analysis over stimulus sets were identical (t⫽4.7, p⬍.01), suggesting
all visually active voxels, performance was well over half that performance may decline for some kinds of
discrim-the asymptote level by discrim-the time 30 voxels were included inations and image transformations.
in the analysis. In addition, at least 30 voxels could be This overall pattern of results did not change
substan-found for each region in each subject. We therefore used tially when all face-selective voxels, or all
house-selec-30 voxels for each of the four cortical regions in this tive voxels, were omitted from the analysis, indicating
analysis. Because voxels were necessarily clustered to-that sufficient information exists outside the FFA to
en-gether in the FFA and PPA, we chose 30 voxels from able discrimination of faces versus nonfaces, and
suffi-similarly clustered regions for the retinotopic and other cient information exists outside the PPA to discriminate
nonretinotopic regions. (see following section for analy-houses from nonanaly-houses.
sis based on unclustered voxel sets). For each subject, one cluster was centered on the FFA, another on the
Are the FFA and PPA Selective in the Information PPA, and another within the retinotopic cortex; the re-They Contain? maining ten clusters had random locations in the visually
The previous analyses across all visually responsive responsive occipito-temporal cortex not overlapping voxels (or all voxels except the face-selective or house- with any of these three regions and not overlapping with selective voxels) suggest that information about object each other.
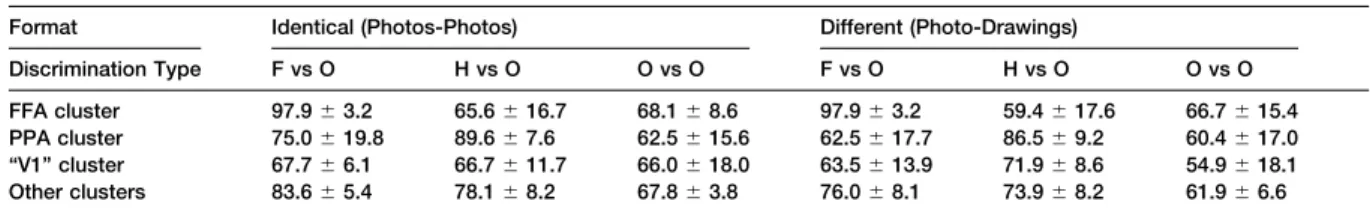
categories is quite distributed across the ventral visual The resulting means across subjects of the pairwise pathway, with information relevant to faces and houses percent correct performance in each condition are present in regions that do not respond selectively to shown in Table 1. A 3⫻4⫻2 ANOVA across subjects these categories. If information about object categories on the pairwise percent correct performance for the were completely distributed, then it would not matter resulting 24 conditions revealed a significant main effect what region of cortex one sampled when making a given of discrimination type, F(2,10)⫽15.1, p⬍.005 and a category discrimination. To test this hypothesis, we next significant interaction of discrimination type by cortical measured pairwise categorization accuracy for the region, F(6,30) ⫽ 12.5, p ⬍.001. As in the previous same three kinds of discriminations investigated in the analysis across all voxels, the main effect of stimulus previous section (faces versus objects, houses versus generalization did not reach significance, F(1,5)⫽4.0, objects, and objects versus objects) as a function of p⬎0.05. The triple interaction of stimulus generaliza-the region of cortex sampled (generaliza-the FFA, PPA, retinotopic tion ⫻discrimination type ⫻cortical region revealed cortex, or other nonretinotopic cortical regions) and only a nonsignificant trend, F(6,30)⫽1.9, p⬎0.1. No stimulus generalization type (either identical stimuli, or other main effects of interactions reached significance,
i.e., all F ’s are smaller than one. photographs to line drawings).
Figure 4. Mean Percentage of Correct Discrimination across Six Subjects as a Function of the Number of Voxels in Different Cortical Regions For each subject and each subset size, the percentage of correct discrimination is averaged over many different subsets of randomly selected voxels. Chance level is 50%. Overall performance on (A) all 84 discriminations for the seven categories, (B) face versus object discrimination averaged over four pairwise comparisons (faces versus chairs, faces versus bottles, faces versus scissors, faces versus shoes), (C) same as (B) but for houses instead of faces, (D) object discrimination averaged over six pairwise comparisons (chairs versus bottles, chairs versus scissors, chairs versus shoes, bottles versus scissors, bottle versus shoes, scissors versus shoes).
The critical interaction of discrimination type by corti- discriminations. Similarly, the PPA performs signifi-cantly better than chance on house versus object dis-cal region indicates that cortidis-cal regions differ from each
other in the category discriminations they are most infor- criminations (p⬍.005), and also significantly better on house versus object discriminations than object versus mative about. This finding leads directly to the central
question of whether the FFA and PPA carry information object discriminations (p⬍.05). The comparison of PPA performance on house versus object to face versus ob-about nonpreferred stimuli. To address this question,
we measured performance on the three different dis- ject discrimination performance did not reach signifi-cance (p⫽.08), which is not surprising given that the crimination types separately within the entire FFA, the
entire PPA, and the 30 voxel clusters in retinotopic cor- PPA responds less strongly to faces than to other ob-jects and thus exhibits some ability to distinguish face tex. These data, which are shown in Figure 5, reveal that
the FFA performs better than chance on face versus from nonface objects (Epstein et al., 1999; Epstein and Kanwisher, 1998).
object discriminations (p⬍.001), and also significantly
better on face versus object discriminations than house These comparisons reveal that the FFA and PPA are significantly more informative about discriminations in-versus object (p⬍.05) or object versus object (p⬍.01)
Table 1. Mean Pairwise Percent Correct Discrimination and Standard Deviation across Six Subjects for Different Clusters
Format Identical (Photos-Photos) Different (Photo-Drawings)
Discrimination Type F vs O H vs O O vs O F vs O H vs O O vs O
FFA cluster 97.9⫾3.2 65.6⫾16.7 68.1⫾8.6 97.9⫾3.2 59.4⫾17.6 66.7⫾15.4 PPA cluster 75.0⫾19.8 89.6⫾7.6 62.5⫾15.6 62.5⫾17.7 86.5⫾9.2 60.4⫾17.0 “V1” cluster 67.7⫾6.1 66.7⫾11.7 66.0⫾18.0 63.5⫾13.9 71.9⫾8.6 54.9⫾18.1 Other clusters 83.6⫾5.4 78.1⫾8.2 67.8⫾3.8 76.0⫾8.1 73.9⫾8.2 61.9⫾6.6 “F vs O” stands for faces versus objects, “H vs O” houses versus objects, and “O vs O” objects versus objects.
Figure 5. Mean Percentage of Correct Discrimination and Standard
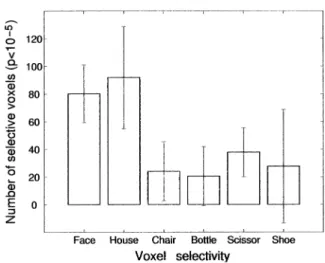
Deviation in Three Different Regions Figure 6. Mean across Subjects of the Number of Voxels Selective for Faces, Houses, Chairs, Bottles, and Shoes
The performance is calculated for different types of pairwise
dis-criminations in the entire FFA, the entire PPA, and a 30 voxel cluster The selective voxels are the voxels for which the activation is signifi-in the calcarsignifi-ine sulcus (probably V1), based on activations from cantly higher for one category than for the other ones (p⬍10⫺5, identical images. A t test comparing performance to chance level uncorrected for multiple comparisons).
(50%) produces the following p values: FFA: faces versus objects (p⬍0.001), houses versus objects (p⫽0.08), objects versus objects (p⫽0.14); PPA: faces versus objects (p⫽0.28), houses versus
faces and houses exists but is not segregated within objects (p⫽0.003), objects versus objects (p⫽0.08); V1: faces
focal regions of cortex. We tested whether distributed versus objects (p⬍0.001), houses versus objects (p⫽0.02), objects
selectivities exist by measuring discrimination perfor-versus objects (p⫽0.08). The stars (*) indicate p values below 0.05.
mance on distributed voxel sets that are selective to one category over the other ones. Figure 6 shows the average number of voxels selective for each category volving preferred than nonpreferred stimuli. But do the
with p⬍10⫺5. This number is much smaller for small FFA and PPA carry any categorical information at all
man-made objects than for faces or houses. Since dis-about nonface nonhouse objects? As shown in Figure
crimination performance depends on the number of vox-5, object versus object discriminations were not
signifi-els, we measured discrimination performance based on cantly higher than chance in either the FFA or the PPA.
six different sets of 30 voxels, each set comprised of the A few of these comparisons were close to significance
most selective voxels for one category (faces, houses, (see the legend to Figure 5 for details), so it is possible
chairs, shoes, scissors, and bottles). Table 2 shows that that a small amount of information about nonpreferred
face-selective voxels perform better on face discrimina-categories may be present in the FFA and PPA.
How-tion than on discriminaHow-tion involving other stimulus ever, as can be seen in Figure 5, performance on
dis-classes, and house-selective voxels perform somewhat criminations involving nonpreferred categories in the
better on house (and face) discriminations than other FFA and PPA was no higher than performance on the
discriminations. However, for bottle-, scissor-, shoe-, same discriminations based on retinotopic cortex. This
and chair-selective voxels, performance on discrimina-result suggests that the FFA and PPA do not contribute
tions involving their preferred category is no better than any new discriminative information for nonpreferred
cat-it is for discriminations involving nonpreferred catego-egories beyond the presumably low level feature
corre-ries. Furthermore, for bottles, shoes, and scissors, the lates of these categories already extracted in retinotopic
voxels most selective for these categories performed cortex.
no better than chance on any discriminations (except scissor-selective voxels on faces). Thus, we find no
evi-Selectivity for Other Object Categories
dence for sets of voxels that selectively discriminate Thus, the FFA and PPA appear to carry categorical
infor-other stimulus categories, even when we allow such mation primarily or only about their preferred stimuli. Do
voxels to be distributed across the cortex similarly selective regions exist for any of the categories
of small man-made objects? Only one category,
scis-sors, produced a clustered region of somewhat selective Discussion
activation that was in a roughly similar location across
subjects. But analyses based on this region alone pro- Our data indicate that some information about object categories, including faces and houses, is present in duced only 66% correct discrimination of scissors
ver-sus faces, houses, and other man-made objects. This the pattern of neural responses across broad regions of cortex in the ventral visual pathway. This result repli-performance is lower than the scissor discrimination
performance found in the FFA (72.5%) and similar to the cates the findings reported by Haxby et al. (2001). Fur-ther, and somewhat surprisingly, this discriminative in-one found in the PPA (62.5%), so it does not appear to
support particularly effective scissor discrimination. formation appears not to be based solely on low level features that covary with object categories because per-Perhaps selectivity for object categories other than
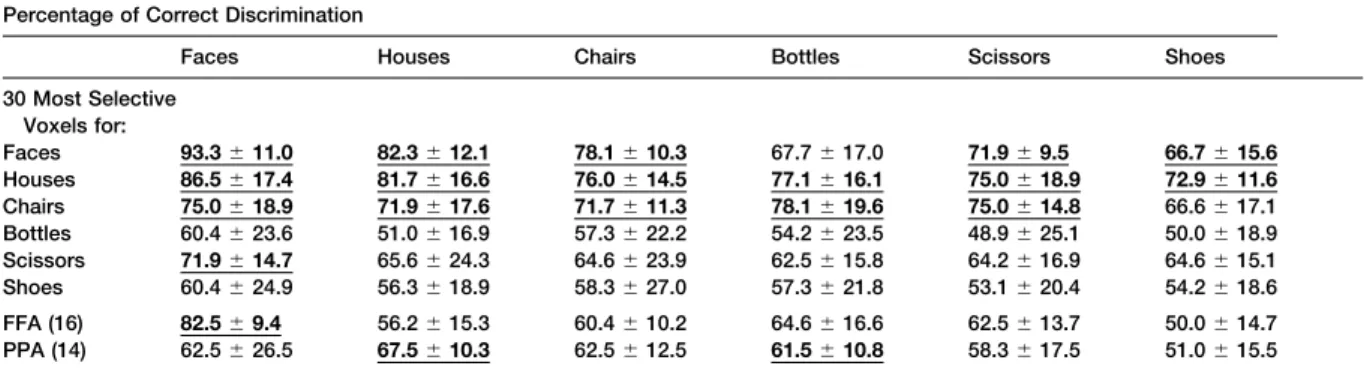
Table 2. Mean Percent of Correct Discrimination and Standard Deviation across Six Subjects on Pairwise Discriminations Involving Each Category
Percentage of Correct Discrimination
Faces Houses Chairs Bottles Scissors Shoes
30 Most Selective Voxels for:
Faces 93.3⫾11.0 82.3⫾12.1 78.1⫾10.3 67.7⫾17.0 71.9⫾9.5 66.7⫾15.6
Houses 86.5⫾17.4 81.7⫾16.6 76.0⫾14.5 77.1⫾16.1 75.0⫾18.9 72.9⫾11.6
Chairs 75.0⫾18.9 71.9⫾17.6 71.7⫾11.3 78.1⫾19.6 75.0⫾14.8 66.6⫾17.1 Bottles 60.4⫾23.6 51.0⫾16.9 57.3⫾22.2 54.2⫾23.5 48.9⫾25.1 50.0⫾18.9 Scissors 71.9⫾14.7 65.6⫾24.3 64.6⫾23.9 62.5⫾15.8 64.2⫾16.9 64.6⫾15.1 Shoes 60.4⫾24.9 56.3⫾18.9 58.3⫾27.0 57.3⫾21.8 53.1⫾20.4 54.2⫾18.6 FFA (16) 82.5⫾9.4 56.2⫾15.3 60.4⫾10.2 64.6⫾16.6 62.5⫾13.7 50.0⫾14.7 PPA (14) 62.5⫾26.5 67.5⫾10.3 62.5⫾12.5 61.5⫾10.8 58.3⫾17.5 51.0⫾15.5 The selective voxels for each category were the 30 voxels most strongly selective for that category independent of cortical location or clustering. The correct discrimination of the category for which the voxels are selective is measured over all pairwise discriminations in which this preferred category is contrasted with the other categories. For the discrimination of nonpreferred categories, no discriminations involving the preferred category were included. Performance values that are significantly higher than chance are in bold and underlined. The high performance on nonpreferred categories in the face- and house-selective voxels are due to the face- and house-selective voxels outside the FFA and PPA; this can be seen from the fact that when these voxels are removed from the analysis, discrimination performance on most nonpreferred categories is not significantly better than chance whereas discrimination performance on preferred categories remains high (bottom two rows of table). The number of selective voxels from the original set of 30 voxels that are located in the FFA and PPA are given in parentheses (averaged across six subjects).
formance does not decline substantially when the acti- extended representation for all objects” (pg. 2427). The most likely reason why we reached different conclusions vation maps for each category are based on images
that differ in category exemplar, viewpoint, and image from those of Haxby et al. (2001) is that they did not separately measure performance on discriminations in-format. It remains to be determined whether such
appar-ently distributed category information would still be volving preferred stimuli from those involving only non-preferred stimuli, leaving them unable to accurately present across broad regions of the ventral visual
path-way if the stimulus sets producing the activation maps assess the performance of the FFA and PPA on discrimi-nations between two nonpreferred stimuli.
differed in other dimensions such as size and retinal
position. Of course, fMRI has limited spatial resolution, and our
inability to detect categorical information about nonpre-However, the ventral visual pathway is not
homoge-neous and the voxels and regions within it are not inter- ferred stimuli in the FFA and PPA does not prove that this information is not present in these areas. Future changeable or equipotential in the information they carry
about different category discriminations. This fact is re- studies using higher spatial resolution may be able to detect this information. (Indeed, one would expect even vealed by a significant interaction in category
discrimi-nation performance between the kind of discrimidiscrimi-nation a filter designed only for discriminating exemplars from nonexemplars of category X to have some ability to that is made and the region of cortex that is used as
the basis for that discrimination. Further, although the discriminate exemplars versus nonexemplars of cate-gory Y, insofar as X and Y share some visual features.) FFA is highly informative about discriminations between
faces and other categories, it provides little or no infor- But the mere existence of discriminative information is no guarantee that this information forms part of the mation about discriminations between different nonface
object categories. Similarly, the PPA allows good dis- representation of the object and is used in object cate-gorization. How then would we determine whether any crimination of houses from other categories, but
pro-vides little or no information about discriminations such information in the FFA (for example) plays an im-portant role in discriminations involving stimuli other among nonhouse objects. Finally, neither the FFA nor
the PPA outperforms retinotopic cortex in discrimina- than faces?
A recent neuropsychological study addresses both tions between nonpreferred stimuli, suggesting that any
small contribution made by the FFA or PPA on these problems. Wada and Yamamoto (2001) report on the case of a man with an unusually small lesion restricted discriminations may be based not on abstract category
information, but on low level visual features that were to the region of the right FFA who was severely disrupted on a variety of face recognition tasks, yet fully preserved confounded with particular categories in our stimulus sets.
Thus, although categorical information is apparently on all of the tests of object recognition they ran. If we assume that this man’s lesion included the right FFA, spread over a broad expanse of the ventral visual
path-way, our analysis finds little or no evidence that the FFA then these data suggest that even if some small amount of category-discriminative information exists in the FFA and PPA carry discriminative information about
nonpre-ferred stimuli. This finding is inconsistent with the sug- for nonfaces (undetected in our study), this information appears not to play a necessary role in the recognition gestion of Haxby et al. (2001) that “regions such as the
parahippocampal place area or the fusiform face area of those nonface objects. The fact that this patient, like most prosopagnosics, knows that a face is a face but are not dedicated to representing only spatial
An additional scan was performed on two subjects, during which a is not necessary for discriminating faces from nonfaces,
radial wedge consisting of flickering black and white checks was but is necessary for discriminating between different
presented for 16 s in each of four directions (left, right, top, bottom). individual faces. This hypothesis is also consistent with
This allowed us to locate V1 functionally (Grill-Spector et al., 1998). Haxby et al.’s (2001) finding, replicated here, that dis- Each group of grayscale photographs was presented in four criminating faces from nonfaces can be done on the scans. This procedure allowed us to divide the set of 16 scans in two halves (eight scans each) that contained either different viewpoints basis of activation maps even when the FFA is excluded
(groups 1 and 3 in the first half and groups 2 and 4 in the second from the analysis. Converging evidence for this
hypothe-half), different exemplars (groups 1 and 2 in the first half and groups sis would be obtained if future experiments with higher
3 and 4 in the second half), or identical images (each half contained spatial resolution find that the neural response within the
images from all groups). Each group of line drawing stimuli was FFA alone is sufficient to distinguish between individual presented in two out of the eight scans.
faces.
More generally, the present results are encouraging fMRI Data Acquisition
Scanning was done on a 3T Allegra scanner at the MGH-NMR Center for the validity of preferred responses as an index of
in Charlestown. A head coil and a Gradient Echo pulse sequence the function of an area, voxel, or neural population. While
with TR, 2 s; TE, 30 ms; flip angle, 90⬚was used. Twenty 4 mm thick it remains possible that nonpreferred responses carry
slices were oriented parallel to the temporal lobe (near axial slices). some important part of the representation in some
neu-The slices covered the entire temporal lobe plus most of the occipital ral representations, the present data suggest that within lobe. For one subject, the slices were oriented perpendicular to the the ventral visual pathway the focal regions that respond calcarine sulcus.
most strongly to faces and places are also the regions
that are most informative about discriminations involv- fMRI Data Analysis
Motion correction using the Fsfast analysis toolbox was performed ing those categories. Such analyses cannot indicate
prior to the data analysis (Burock and Dale, 2000). For each subject, whether these regions are in fact the main or only regions
the set of visually active voxels was defined as the voxels in the used in making such discriminations. Nonetheless, there
temporal and occipital cortex that were significantly more active would seem to be substantial advantages in sampling during stimulus epochs than fixation for at least one category (t test, a restricted region of cortex where the relevant discrimi- p⬍10⫺5) in the first half of data (averaged across eight scans). The set of visually active voxels is different for each way of grouping. nation information is carried with high signal-to-noise
For each category, the activation maps represent the response am-ratio (SNR), compared to sampling a broad expanse
plitude of the category epoch relative to fixation averaged across of cortex spanning several centimeters that contains
eight scans. In order to remove outliers in the signal, the response numerous voxels with low SNR.
amplitude was determined by fitting a sixth-order polynomial. Seven activation maps per category were obtained (two for the identical
Experimental Procedures image case, two for the different viewpoint case, two for the different
exemplar case, and one for the line drawings). The percent correct
Subjects discrimination was calculated from pairwise comparisons of
correla-Eight healthy subjects (four males and four females) participated in tion coefficients according to the method of Haxby et al. (2001). A this study. Two subjects (one male and one female) were excluded given pairwise comparison between categories A and B is deemed prior to the analysis due to excessive head motion. a correct identification of category A if the correlation coefficient between the two maps of category A is higher than that between those of categories A and B. The percent correct discrimination is
Stimuli
obtained from the average of all pairwise comparisons (between Stimuli were collected from seven different categories used by
the first and the second data set and vice versa) involved in the Haxby et al. (2001): faces, cats, houses, chairs, scissors, shoes, and
discrimination. For example, in the comparison involving all catego-bottles. Scrambled images were also presented to the subjects, but
ries, the percent correct discrimination is based on 7⫻6⫻2⫽84 were not used in the analysis because they differ in too many
re-pairwise comparisons. spects from the other images, making their discrimination trivial.
For each category, we collected 16 different exemplars with two
different viewpoints each. Stimuli were either digitized grayscale Performance as a Function of the Number of Voxels
photographs with a white background or line drawings of the same For the analysis in Figure 4, correct discrimination performance was photographs. Stimulus size was approximately 9⬚of visual angle. A calculated as a function of voxel set size. For each voxel set size, small dot in the center of the image was present during the whole the correct discrimination is based on the average performance scan and subjects were instructed to maintain fixation. Stimuli were over many different subsets of randomly selected voxels. For each presented in the center of the screen on a gray background. cortical region, the voxels were randomly selected from the set of voxels that constitutes this region. The number of subsets was proportional 1/公N, where N is the number of voxels, so that the
Procedure
error is approximately independent of N. The image sets for each category were divided into five groups
(Figure 2). Group 1 contained the first eight exemplars from one
viewpoint. Group 2 contained the same exemplars as group 1 seen ROI Analysis
The location of the fusiform face area (FFA) was determined using from a different viewpoint. Groups 3 and 4 were analogous to groups
1 and 2 but contained the other eight exemplars. Group 5 contained the voxels in half of the data of the identical images case that were significantly more active for faces than chairs, bottles, scissors, and line drawing versions of all 32 images. Each subject was run on 24
different scans, 16 scans of grayscale photographs and 8 scans of shoes (t test, p⬍10⫺5, Hanning radius for smoothing equal 2). Similarly, voxels that were significantly more active for houses than line drawings. Each scan consisted of 16 s epochs, one for each
category, preceded and followed by 8 s fixation periods. The pic- other small man-made objects defined the parahippocampal place area (PPA). The substantially lower PPA response to houses com-tures were presented for 200 ms with an 800 ms blank interval. Each
picture was presented twice per epoch. Subjects were instructed pared to scenes makes this an only approximately correct PPA localizer (Epstein and Kanwisher, 1998). Retinotopic cortex was de-to press a butde-ton whenever they saw two identical images
consecu-tively (1-back task). This happened twice per epoch. The task was termined anatomically by adjacency to the calcarine sulcus in four subjects. In two other subjects, an additional scan (see Procedure) designed to keep the subjects alert and attentive. Images from each
category were presented in different epochs within each scan in a allowed us to functionally define the borders of retinotopic areas by mapping the representations of the vertical and horizontal visual way that balanced the serial position of the category across scans.
field meridians (Engel et al., 1994; Sereno et al., 1995). For the cluster tion encoding and the responses of single neurons in the primate temporal visual cortex. J. Neurophysiol.70, 640–654.
analysis, the FFA, PPA, and retinotopic cortex clusters were defined
as the 30 visually active voxels centered around the above-men- Wada, Y., and Yamamoto, T. (2001). Selective impairment of facial tioned functional regions. We use the term “retinotopic cortex” recognition due to a haematoma restricted to the right fusiform rather than “V1” because the cluster of 30 voxels might include and lateral occipital region. J. Neurol. Neurosurg. Psychiatry71, additional retinotopic areas (V2,V3). 254–257.
Acknowledgments
The authors thank Kalanit Grill-Spector for her help and Patrick Cavanagh, Bruce Fischl, Winrich Freiwald, Russel Epstein, and Po-lina Golland for valuable comments. This work was supported by grants EY13455 and MH59150 to Nancy Kanwisher and by a fellow-ship to Mona Spiridon from the Swiss National Science Foundation.
Received: March 19, 2002 Revised: July 26, 2002
References
Aguirre, G.K., Zarahn, E., and D’esposito, M. (1998). An area within human ventral cortex sensitive to “building” stimuli: evidence and implications. Neuron21, 373–383.
Burock, M.A., and Dale, A.M. (2000). Estimation and detection of event-related fMRI signals with temporally correlated noise: a statis-tically efficient and unbiased approach. Hum. Brain Mapp. 11, 249–260.
Downing, P.E., Jiang, Y., Shuman, M., and Kanwisher, N. (2001). A cortical area selective for visual processing of the human body. Science293, 2470–2473.
Engel, S.A., Rumelhart, D.E., Wandell, B.A., Lee, A.T., Glover, G.H., Chichilnisky, E.J., and Shadlen, M.N. (1994). fMRI of human visual cortex. Nature369, 525.
Epstein, R., and Kanwisher, N. (1998). A cortical representation of the local visual environment. Nature392, 598–601.
Epstein, R., Harris, A., Stanley, D., and Kanwisher, N. (1999). The parahippocampal place area: recognition, navigation, or encoding? Neuron23, 115–125.
Grill-Spector, K., Kushnir, T., Edelman, S., Itzchak, Y., and Malach, R. (1998). Cue-invariant activation in object-related areas of the human occipital lobe. Neuron21, 191–202.
Halgren, E., Dale, A.M., Sereno, M.I., Tootell, R.B., Marinkovic, K., and Rosen, B.R. (1999). Location of human face-selective cortex with respect to retinotopic areas. Hum. Brain Mapp.7, 29–37. Haxby, J.V., Horwitz, B., Ungerleider, L.G., Maisog, J.M., Pietrini, P., and Grady, C.L. (1994). The functional organization of human extrastriate cortex: a PET-rCBF study of selective attention to faces and locations. J. Neurosci.14, 6336–6353.
Haxby, J.V., Gobbini, M.I., Furey, M.L., Ishai, A., Schouten, J.L., and Pietrini, P. (2001). Distributed and overlapping representations of faces and objects in ventral temporal cortex. Science293, 2425– 2430.
Ishai, A., Ungerleider, L.G., Martin, A., Schouten, J.L., and Haxby, J.V. (1999). Distributed representation of objects in the human ven-tral visual pathway. Proc. Natl. Acad. Sci. USA96, 9379–9384. Kanwisher, N., McDermott, J., and Chun, M.M. (1997). The fusiform face area: a module in human extrastriate cortex specialized for face perception. J. Neurosci.17, 4302–4311.
McCarthy, G., Puce, A., Gore, J.C., and Allison, T. (1997). Face-specific processing in the human fusiform gyrus. J. Cogn. Neurosci.
9, 604–609.
Puce, A., Allison, T., Asgari, M., Gore, J.C., and McCarthy, G. (1996). Differential sensitivity of human visual cortex to faces, letterstrings, and textures: a functional magnetic resonance imaging study. J. Neurosci.16, 5205–5215.
Sereno, M.I., Dale, A.M., Reppas, J.B., Kwong, K.K., Belliveau, J.W., Brady, T.J., Rosen, B.R., and Tootell, R.B. (1995). Borders of multiple visual areas in humans revealed by functional magnetic resonance imaging. Science268, 889–893.