Additivity: A Selection Criterion for Performance Events for
Reliable Energy Predictive Modeling
Arsalan Shahid1 , Muhammad Fahad1, Ravi Reddy1, Alexey Lastovetsky1
c
The Authors 2017. This paper is published with open access at SuperFri.org
Performance events or performance monitoring counters (PMCs) are now the dominant pre-dictor variables for modeling energy consumption. Modern hardware processors provide a large set of PMCs. Determination of the best subset of PMCs for energy predictive modeling is a non-trivial task given the fact that all the PMCs can not be determined using a single application run. Several techniques have been devised to address this challenge. While some techniques are based on a statistical methodology, some use expert advice to pick a subset (that may not necessarily be obtained in one application run) that, in experts’ opinion, are significant contributors to en-ergy consumption. However, the existing techniques have not considered a fundamental property of predictor variables that should have been applied in the first place to remove PMCs unfit for modeling energy. We address this oversight in this paper.
We propose a novel selection criterion for PMCs calledadditivity, which can be used to de-termine the subset of PMCs that can potentially be used for reliable energy predictive modeling. It is based on the experimental observation that the energy consumption of a serial execution of two applications is the sum of energy consumptions observed for the individual execution of each application. A linear predictive energy model is consistent if and only if its predictor variables are additive in the sense that the vector of predictor variables for a serial execution of two applications is the sum of vectors for the individual execution of each application. The criterion, therefore, is based on a simple and intuitive rule that the value of a PMC for a serial execution of two appli-cations is equal to the sum of its values obtained for the individual execution of each application. The PMC is branded as non-additive on a platform if there exists an application for which the calculated value differs significantly from the value observed for the application execution on the platform. The use ofnon-additive PMCs in a model renders it inconsistent.
We study the additivity of PMCs offered by the popular state-of-the-art tools, Likwid and PAPI, by employing a detailed experimental methodology on a modern Intel Haswell multicore server CPU. We show that many PMCs inLikwid and PAPI that are widely used in models as key predictor variables arenon-additive. This brings into question the reliability and the reported prediction accuracy of these models.
Keywords: performance events, PMC, energy predictive models, Likwid, PAPI.
Introduction
Performance events or performance monitoring counters (PMCs) are special-purpose regis-ters provided in modern microprocessors to store the counts of software and hardware activities. We will use the acronym PMCs to refer to software events, which are pure kernel-level coun-ters such as page-faults, context-switches, etc. as well as micro-architectural events originating from the processor and its performance monitoring unit called the hardware events such as
cache-misses,branch-instructions, etc. They have been developed primarily to aid low-level per-formance analysis and tuning. Remarkably while PMCs have not been used for perper-formance modeling, over the years, they have become dominant predictor variables for energy predictive modeling.
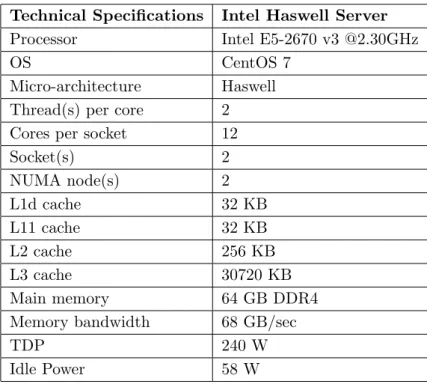
Modern hardware processors provide a large set of PMCs. Consider the Intel Haswell mul-ticore server CPU whose specification is shown in Tab. 1. On this server, the PAPI tool [19] provides 53 hardware performance events. The Likwid tool [17, 23] provides 167 PMCs. This
Table 1.Specification of the Intel Haswell Multicore CPU
Technical Specifications Intel Haswell Server
Processor Intel E5-2670 v3 @2.30GHz
OS CentOS 7
Micro-architecture Haswell Thread(s) per core 2 Cores per socket 12
Socket(s) 2
NUMA node(s) 2 L1d cache 32 KB L11 cache 32 KB L2 cache 256 KB L3 cache 30720 KB Main memory 64 GB DDR4 Memory bandwidth 68 GB/sec
TDP 240 W
Idle Power 58 W
includes events for uncore and micro-operations (µops) of CPU cores specific to Haswell archi-tecture that are not provided by PAPI. However, all the PMCs can not be determined using a single application run since only a limited number of registers is dedicated to collecting them. For example, to collect all the Likwid PMCs for a single runtime configuration of an application on the server, the application must be executed 53 times. It must be also pointed out that energy predictive models based on PMCs are not portable across a wide range of architectures. While a model based on either Likwid PMCs or PAPI PMCs may be portable across Intel and AMD architectures, it will be unsuitable for GPU architectures.
Therefore, there are three serious constraints that pose difficult challenges to employing PMCs as predictor variables for energy predictive modeling. First, there is a large number of PMCs to consider. Second, tremendous programming effort and time are required to automate and collect all the PMCs. This is because all the PMCs can not be collected in one single application run. Third, a model purely based on PMCs lacks portability. In this paper, we focus mainly on techniques employed to select a subset of PMCs to be used as predictor variables for energy predictive modeling. We now present a brief survey of them.
O’Brien et al. [18] survey the state-of-the-art energy predictive models in HPC and present a case study demonstrating the ineffectiveness of the dominant PMC-based modeling approach for accurate energy predictions. In the case study, they use 35 carefully selected PMCs (out of a total of 390 available in the platform) in their linear regression model for predicting dynamic energy consumption. [1, 9, 10] select PMCs manually, based on in-depth study of architecture and empirical analysis. [8, 15, 18, 21, 22, 27, 30] select PMCs that are highly correlated with energy consumption using Spearman’s rank correlation coefficient (or Pearson’s correlation coefficient) and principal component analysis (PCA). [1, 2, 15] use variants of linear regression to remove PMCs that do not improve the average model prediction error.
contributors to energy consumption. To the best of our knowledge, we found no research works that adopt this approach. This could be due to several reasons: a) Gathering all PMCs requires huge programming effort and time; b) Interpretation (for example, visual) of the relationship between energy consumption and PMCs is difficult especially when there is a large number of PMCs; c) Dynamic or runtime models must choose PMCs that can be gathered in just one application run; d) Typically, simple models (those with less parameters) are preferred over complex models not because they are accurate but because simplicity is considered a desirable virtue.
The second category consists of techniques that are based on a statistical methodology. The last category contains techniques that use expert advice or intuition to pick a subset (that may not necessarily be determined in one application run) and that, in experts’ opinion, is a dominant contributor to energy consumption. However, the existing techniques have not considered one fundamental property of predictor variables that should have been considered in the first place to remove PMCs unfit for modeling energy. We address this oversight in this paper.
We propose a novel selection criterion for PMCs called additivity, which can be used to de-termine the subset of PMCs that can potentially be used for reliable energy predictive modeling. It is based on the experimental observation that the energy consumption of a serial execution of two applications is the sum of energy consumptions observed for the individual execution of each application. We define a compound application to represent a serial execution of a combi-nation of two or more individual applications. The individual applications are also termed as
base applications.
A linear predictive energy model is consistent if and only if its predictor variables are additive in the sense that the vector of predictor variables for a compound application is the sum of vectors for the individual execution of each application. The additivity criterion, therefore, is based on simple and intuitive rule that the value of a PMC for a compound application is equal to the sum of its values for the executions of the base applications constituting the compound application. We brand a PMCnon-additiveon a platform if there exists a compound application for which the calculated value significantly differs from the value observed for the application execution on the platform (within a tolerance of 5.0%). If we fail to find a compound application (typically from a sufficiently large suite of compound applications) for which the additivity criterion is not satisfied, we term the PMC as potentially additive, which means that it can potentially be used for reliable energy predictive modeling. By definition, a potentially additive PMC must be deterministic and reproducible, that is, it must exhibit the same value (within a tolerance of 5.0%) for different executions of the same application with same runtime configuration on the same platform.
The use of a non-additive PMC as a predictor variable in a model renders it inconsistent and therefore unreliable.
We study theadditivity of PMCs offered by two popular tools,Likwid andPAPI, by employ-ing a detailed statistical experimental methodology on a modern Intel Haswell multicore server CPU. We observe that all the Likwid PMCs and PAPI PMCs are reproducible. However, we show that while many PMCs are potentially additive, a considerable number of PMCs are not. Some of the non-additive PMCs are widely used in energy predictive models as key predictor variables.
a compound application and the sum of the PMCs of the base applications and the sum of the PMCs. We show that there is a PMC where the error is as high as 3075% and there are several PMCs where the error is over 100%. This brings into question the reliability and reported prediction accuracy of models that use these PMCs.
Our key contribution in this work is that we propose a novel criterion called additivity that can be used to identify PMCs not suitable for energy predictive modeling. PMCs offered by popular tools such as Likwid and PAPI are classified based on this criterion using a detailed experimental methodology on a modern Intel Haswell multicore server CPU. In our future work, we plan to classify the non-additivity of PMC into application-specific and platform-specific categories.
The rest of the paper is structured as follows. Section 1 surveys popular tools that provide programmatic and command-line interfaces to obtain PMCs. In Section 2, we define the property of additivity and explain why it is important for reliable energy predictive modeling. Section 3 presents the experimental methodology used to determine the additivity of Likwid and PAPI PMCs. Sections 4 and 5 present a classification of Likwid and PAPI PMCs respectively based on the criterion ofadditivity. Finally, Section 6 concludes the paper.
1. Related Work
This section is divided into two parts. In the first part, we present tools widely used to obtain PMCs. In the second part, we survey notable research on selection of PMCs for power and energy modeling from a large set supplied by a tool.
1.1. Tools to Determine PMCs
PAPI [19] provides a standard API for accessing PMCs available on most modern micropro-cessors. It provides two types of events,native eventsandpreset events.Native events correspond to PMCs native to a platform. They form the building blocks for preset events. A preset event
is mapped onto one or more native events on each hardware platform. While native events are specific to each platform,preset events obtained on different platforms can not be compared.
Likwid [22] provides command-line tools and an API to obtain PMCs for both Intel and AMD processors on the Linux OS.
For Nvidia GPUs, CUDA Profiling Tools Interface (CUPTI) [3] can be used for obtaining the PMCs. Intel PCM [14] is used for reading PMCs of core and uncore (which includes the QPI) components of an Intel processor. Perf [25] also called perf events can be used to gather the PMCs for CPUs in Linux.
1.2. Techniques for Selection of PMCs for Energy Predictive Modeling
All the models surveyed in this section are linear energy predictive models.
Singh et al. [20] use PMCs provided by AMD Phenom processor. They divide the PMCs into four categories and rank them in the increasing order of correlation with power using the Spearman’s rank correlation. Then they select the top PMC in each category (four in total) for their energy prediction model.
correlation to power consumption using the Spearman’s rank correlation. The PMCs with less correlation are then investigated by analyzing the accuracy of several models that employ them. Kadayif et al. [16] present a PMC-based model for predicting energy consumption of pro-grams on a UltraSPARC platform. The platform provides 30 different PMCs. However, they use only eight and do not specify how they have selected them.
Lively et al. [17] employ 40 PMCs in their predictive model. They use an elaborate statistical methodology to select PMCs. They compute the Spearman’s rank correlation for each PMC and remove those below a threshold. They compute the principal components (PCA) of the remaining PMCs and select those with the highest PCA coefficients. Bircher et al. [1] employ an iterative linear regression modeling process where they add a PMC at each step and stop until desired average prediction error is achieved.
Song et al. [21] select a group of PMCs (for their energy model of Nvidia Fermi C2075 GPU) that are strongly correlated to power consumption based on the Pearson correlation coefficient. Witkowski et al. [26] use PMCs provided by the Perf tool for their model. They use the correlation (Pearson correlation coefficient) between a PMC and the measured power consump-tion and select those PMCs, which have high correlaconsump-tion coefficients. Although they find that the PMCs related to DRAM have a low correlation with power consumption, they still use them since these variables signify intensity of DRAM operations, which contribute significantly to power consumption.
Gschwandtner et al. [9] deal with the problem of selecting the best subset of PMCs on the IBM POWER7 processor, which offers over 500 different PMCs. They first manually select a medium number of hardware counters that they believe are prominent contributors to energy consumption. Then they empirically select a subset from their initial selection. Jarus et al. [15] use PMCs provided by the Perf tool for their models. The PMCs employed differ for different models and are selected using two-stage process. In the first stage, PMCs that are correlated 90% or above are selected. In the second stage, stepwise regression with forward selection is used to decide the final set of PMCs.
Haj-Yihia et al. [10] start with a set of 23 PMCs (offered by Likwid) based on expert knowledge of the Intel architecture. Then they perform linear regression iteratively where they drop PMCs (one by one) that do not impact the average prediction error of their model.
Wu et al. [29] use the Spearman correlation coefficient and PCA to select the subset of PMCs, that are highly correlated with power consumption. Chadha et al. [2] select a particular PMC from the list of PAPI PMCs available for their platform and check if it fits well with linear regression model. If it does, they select it as a key parameter for their modeling and experimental study. Otherwise, they skip it.
2. Additivity: Definition
The additivity criterion is based on simple and intuitive rule that the value of a PMC for a compound application is equal to the sum of its values for the executions of the base applications constituting the compound application.
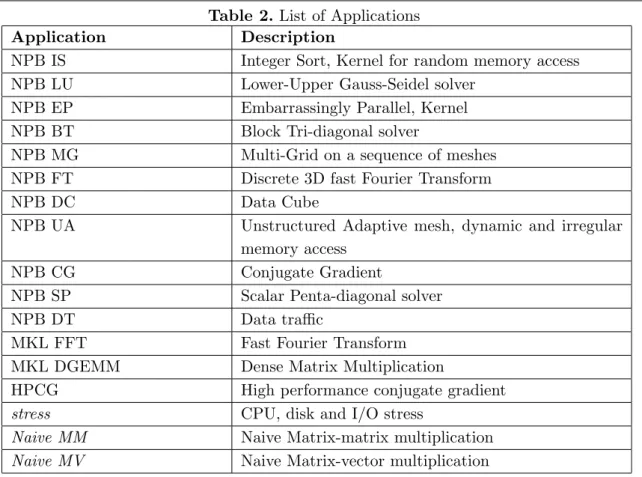
Table 2. List of Applications
Application Description
NPB IS Integer Sort, Kernel for random memory access NPB LU Lower-Upper Gauss-Seidel solver
NPB EP Embarrassingly Parallel, Kernel NPB BT Block Tri-diagonal solver
NPB MG Multi-Grid on a sequence of meshes NPB FT Discrete 3D fast Fourier Transform
NPB DC Data Cube
NPB UA Unstructured Adaptive mesh, dynamic and irregular memory access
NPB CG Conjugate Gradient
NPB SP Scalar Penta-diagonal solver NPB DT Data traffic
MKL FFT Fast Fourier Transform MKL DGEMM Dense Matrix Multiplication
HPCG High performance conjugate gradient
stress CPU, disk and I/O stress
Naive MM Naive Matrix-matrix multiplication
Naive MV Naive Matrix-vector multiplication
application will experimentally exhibit a count that does not lie between (e1+e2)×(1−) and
(e1+e2)×(1 +), where the tolerance = 0.05.
If we fail to find a compound application (typically from a large set of diverse compound applications) for which the additivity criterion fails, we term the PMC as potentially additive, which means that it can potentially be used for reliable energy predictive modeling. By definition, a potentially additive PMC must be deterministic and reproducible, that is, it must exhibit the same value (within a tolerance of 5.0%) for different executions of the same application with the same runtime configuration on the same platform.
The use of a non-additive PMC as a predictor variable in a model renders it inconsistent and therefore unreliable. We explain this point using a simple example. Consider an instance of an energy prediction model that uses anon-additive PMC as a predictor variable. A natural and intuitive approach to predict the energy consumption of an application that executes two base applications one after the other is to substitute the sum of the PMCs for the base applications in the model. However, since the PMC is non-additive, the prediction would be very inaccurate. Therefore, usingnon-additive PMCs in energy predictive models adds noise and can signif-icantly damage the predicting power of energy models based on them.
We now present a test to determine if a PMC is non-additive or potentially additive. We call it the additivity test.
2.1. Additivity Test
At the second stage, we examine how the PMC of the compound application relates to its values for the base applications. At first, we collect the values of the PMC for the base applications by executing them separately. Then, we execute the compound application and obtain its value of the PMC. Typically, the core computations for the compound application consist of the core computations of the base applications programmatically placed one after the other. This has to be the case for PAPI PMCs. However, for Likwid PMCs, one can use the
system call to invoke the base application. It must also be ensured that the execution of the
compound application takes place under platform conditions similar to those for the execution of its constituent base applications.
If the PMC of the compound application is equal to the sum of the PMCs of the base applications (with a tolerance of 5.0%), we classify the PMC as potentially additive. Otherwise, it is non-additive.
We call the PMC that passes the additivity test potentially additive. For it to be called
absolutely additive on a platform, ideally it must pass the test for all conceivable compound applications on the platform. Therefore, we avoid this definition.
In our experiments, we observed that all the PMCs were deterministic and reproducible. For each PMC, we determine the maximum percentage error. For acompound application, the percentage error (averaged over several runs) is calculated as follows:
Error(%) = (|(eb1+eb2)−ec eb1+eb2 |
)×100 (1)
whereec, eb1, eb2 are the sample means of predictor variables for the compound application and
the constituent base applications respectively. The maximum percentage error is then calculated as the maximum of the errors for all thecompound applications in the experimental testsuite.
3. Experimental Methodology to Obtain Likwid and PAPI
PMCs
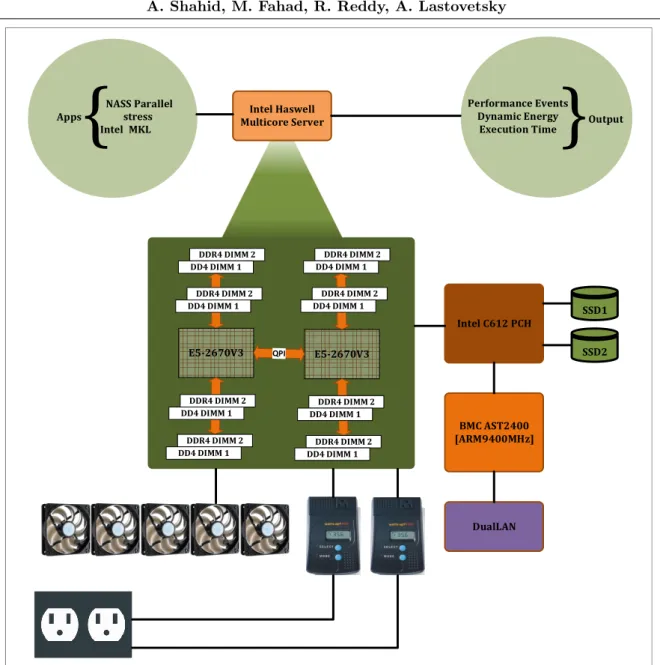
In this section, we present our experimental setup to determine the additivity of PMCs. The experiments are performed on the Intel Haswell multicore CPU platform (specifications given in Tab. 1). We used diverse range of applications (both compute-bound and memory-bound) in our testsuite composed of NAS parallel benchmarking suite (NPB), Intel math kernel library (MKL), HPCG [13], and stress [24] (description given in Tab. 2). The experimental workflow is shown in Fig. 1 where the internals of the server are shown in great detail.
For each run of a application in our testsuite, we measure the following: 1) Dynamic energy consumption, 2) Execution time, and 3) PMCs. The dynamic energy consumption and the application execution time are obtained using the HCLWattsUp interface [11]. We would like to mention that the output variables (or response variables) in the performance and energy predictive models, i.e. energy consumption and execution time, areadditive. We confirm this via thorough experimentation and therefore we will not discuss them hereafter.
We now present our experimental methodologies for determining Likwid and PAPI PMCs.
3.1. LIKWID PMCs
Apps NASS Parallel Multicore ServerIntel Haswell Output Performance Events
Dynamic Energy Execution Time
}
{
E5-2670V3 E5-2670V3
DDR4 DIMM 2 DD4 DIMM 1
DDR4 DIMM 2 DD4 DIMM 1
DDR4 DIMM 2 DD4 DIMM 1
DDR4 DIMM 2 DD4 DIMM 1
DDR4 DIMM 2 DD4 DIMM 1
DDR4 DIMM 2 DD4 DIMM 1
DDR4 DIMM 2 DD4 DIMM 1
DDR4 DIMM 2 DD4 DIMM 1
Intel C612 PCH
BMC AST2400 [ARM9400MHz]
DualLAN
SSD1
SSD2 stress
Intel MKL
Figure 1.Experimental workflow to determine the PMCs on the Intel Haswell server.
A sample Likwid command-line invocation is shown below where EVENTS represents one or more PMCs, which are collected during the execution of the given applicationAPP:
likwid-perfctr -f -C S0:0-11@S1:12-23 -g EVENTS APP
Here, the application (AP P) during its execution is pinned to physical cores (0-11, 12-23) in our platform. Since Likwid does not provide option to bind application to memory, we have used numactl, i.e. a command-line linux tool, with option –membind to pin our applications to memory blocks (for our platform numactl gives 2 memory blocks, 0 and 1). The list of comma-separated PMCs is specified in EVENTS. For example, the following command:
likwid-perfctr -f -C S0:0-11@S1:12-23
-g ICACHE ACCESSES:PMC0,ICACHE MISSES:PMC1 numactl –membind=0,1 APP
determines the counts for two PMCs, ICACHE ACCESSES:PMC0 and ICACHE MISSES:PMC1.
number of registers dedicated to collecting PMCs. In addition, to ensure the reliability of our results, we follow a detailed statistical methodology where sample mean of a PMC is used. It is calculated by executing the application repeatedly until it lies in the 95% confidence interval and a precision of 0.050 (5.0%) has been achieved. For this purpose, Student’s t-test is used assuming that the individual observations are independent and their population follows the normal distribution. We verify the validity of these assumptions by plotting the distributions of observations.
Likwid provides 167 PMCs for our platform. In order to collect all of them for an application, we have to run the application 53 times. We wrote a software tool to automate this collection process, SLOPE-PMC-LIKWID [12].
Before we apply theadditivity test, we remove few PMCs such asIIO CREDIT (related to I/O and QPI), and OF F CORE RESP ON SE since they exhibit zero counts. We also remove PMCs having very low count (less than 10). The resulting dataset contained 151 performance events, which are then input to the additivity test.
3.2. PAPI PMCs
In this section, we explain the experimental methodology to obtain PAPI PMCs.
We check the available PAPI PMCs for our Intel Haswell platform using the command-line invocation, 0papi avail−a0. We found that a total of 53 PMCs are available. The number of PMCs that can be gathered in a single application run varies. While gathering a set of 4 PMCs is common, there are a few event sets, which can contain up to 2 or 3 PMCs. Therefore, we found that the application has to be executed 14 times in order to collect all the PMCs for the application on our platform.
We wrote a software tool to automate the process of collection of PMCs, SLOPE-PMC-PAPI [12]. It is to be noted that for ensuring the reliability of our experimental results, we follow the same statistical methodology that was followed for determining Likwid PMCs.
4. Additivity of Likwid PMCs
In this section, we determine the additivity of Likwid PMCs. We execute all the compound
applications where each application is composed of two base applications in our testsuite (shown in Tab. 2).
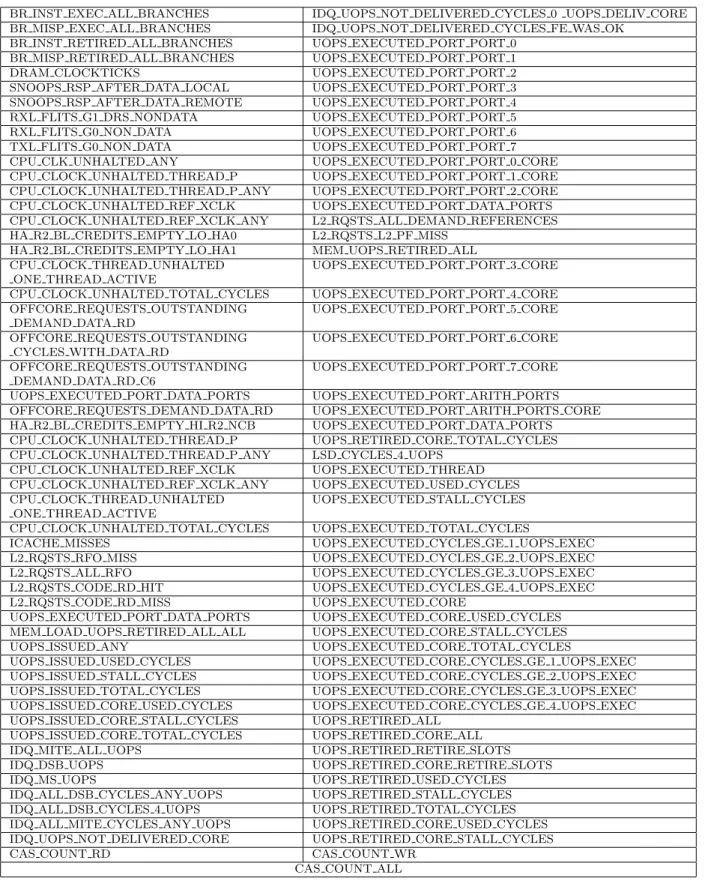
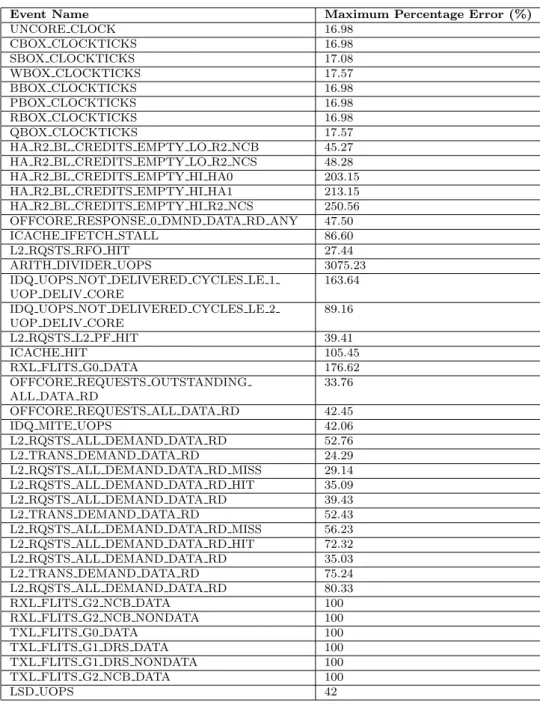
The list of potentiallyadditive PMCs is shown in the Tab. 3. The list ofnon-additive PMCs is presented in Tab. 4, which also reports the maximum percentage error for each PMC.
It is noteworthy that some non-additive PMCs are used as predictor variables in many energy predictive models [5, 6, 10, 20, 23]. These are ICache events, L2 Transactions, and L2 Requests.
5. Additivity of PAPI PMCs
In this section, we determine the additivity of PAPI PMCs. We again execute all the com-pound applications where each application is composed of two base applications in our testsuite (shown in Tab. 2).
Table 3.List of Potentially Additive Likwid PMCs
BR INST EXEC ALL BRANCHES IDQ UOPS NOT DELIVERED CYCLES 0 UOPS DELIV CORE BR MISP EXEC ALL BRANCHES IDQ UOPS NOT DELIVERED CYCLES FE WAS OK
BR INST RETIRED ALL BRANCHES UOPS EXECUTED PORT PORT 0 BR MISP RETIRED ALL BRANCHES UOPS EXECUTED PORT PORT 1
DRAM CLOCKTICKS UOPS EXECUTED PORT PORT 2
SNOOPS RSP AFTER DATA LOCAL UOPS EXECUTED PORT PORT 3
SNOOPS RSP AFTER DATA REMOTE UOPS EXECUTED PORT PORT 4
RXL FLITS G1 DRS NONDATA UOPS EXECUTED PORT PORT 5
RXL FLITS G0 NON DATA UOPS EXECUTED PORT PORT 6
TXL FLITS G0 NON DATA UOPS EXECUTED PORT PORT 7
CPU CLK UNHALTED ANY UOPS EXECUTED PORT PORT 0 CORE
CPU CLOCK UNHALTED THREAD P UOPS EXECUTED PORT PORT 1 CORE CPU CLOCK UNHALTED THREAD P ANY UOPS EXECUTED PORT PORT 2 CORE
CPU CLOCK UNHALTED REF XCLK UOPS EXECUTED PORT DATA PORTS
CPU CLOCK UNHALTED REF XCLK ANY L2 RQSTS ALL DEMAND REFERENCES HA R2 BL CREDITS EMPTY LO HA0 L2 RQSTS L2 PF MISS
HA R2 BL CREDITS EMPTY LO HA1 MEM UOPS RETIRED ALL CPU CLOCK THREAD UNHALTED
ONE THREAD ACTIVE
UOPS EXECUTED PORT PORT 3 CORE CPU CLOCK UNHALTED TOTAL CYCLES UOPS EXECUTED PORT PORT 4 CORE OFFCORE REQUESTS OUTSTANDING
DEMAND DATA RD
UOPS EXECUTED PORT PORT 5 CORE OFFCORE REQUESTS OUTSTANDING
CYCLES WITH DATA RD
UOPS EXECUTED PORT PORT 6 CORE OFFCORE REQUESTS OUTSTANDING
DEMAND DATA RD C6
UOPS EXECUTED PORT PORT 7 CORE UOPS EXECUTED PORT DATA PORTS UOPS EXECUTED PORT ARITH PORTS OFFCORE REQUESTS DEMAND DATA RD UOPS EXECUTED PORT ARITH PORTS CORE HA R2 BL CREDITS EMPTY HI R2 NCB UOPS EXECUTED PORT DATA PORTS CPU CLOCK UNHALTED THREAD P UOPS RETIRED CORE TOTAL CYCLES CPU CLOCK UNHALTED THREAD P ANY LSD CYCLES 4 UOPS
CPU CLOCK UNHALTED REF XCLK UOPS EXECUTED THREAD
CPU CLOCK UNHALTED REF XCLK ANY UOPS EXECUTED USED CYCLES CPU CLOCK THREAD UNHALTED
ONE THREAD ACTIVE
UOPS EXECUTED STALL CYCLES CPU CLOCK UNHALTED TOTAL CYCLES UOPS EXECUTED TOTAL CYCLES
ICACHE MISSES UOPS EXECUTED CYCLES GE 1 UOPS EXEC
L2 RQSTS RFO MISS UOPS EXECUTED CYCLES GE 2 UOPS EXEC
L2 RQSTS ALL RFO UOPS EXECUTED CYCLES GE 3 UOPS EXEC
L2 RQSTS CODE RD HIT UOPS EXECUTED CYCLES GE 4 UOPS EXEC
L2 RQSTS CODE RD MISS UOPS EXECUTED CORE
UOPS EXECUTED PORT DATA PORTS UOPS EXECUTED CORE USED CYCLES MEM LOAD UOPS RETIRED ALL ALL UOPS EXECUTED CORE STALL CYCLES
UOPS ISSUED ANY UOPS EXECUTED CORE TOTAL CYCLES
UOPS ISSUED USED CYCLES UOPS EXECUTED CORE CYCLES GE 1 UOPS EXEC
UOPS ISSUED STALL CYCLES UOPS EXECUTED CORE CYCLES GE 2 UOPS EXEC
UOPS ISSUED TOTAL CYCLES UOPS EXECUTED CORE CYCLES GE 3 UOPS EXEC
UOPS ISSUED CORE USED CYCLES UOPS EXECUTED CORE CYCLES GE 4 UOPS EXEC UOPS ISSUED CORE STALL CYCLES UOPS RETIRED ALL
UOPS ISSUED CORE TOTAL CYCLES UOPS RETIRED CORE ALL
IDQ MITE ALL UOPS UOPS RETIRED RETIRE SLOTS
IDQ DSB UOPS UOPS RETIRED CORE RETIRE SLOTS
IDQ MS UOPS UOPS RETIRED USED CYCLES
IDQ ALL DSB CYCLES ANY UOPS UOPS RETIRED STALL CYCLES
IDQ ALL DSB CYCLES 4 UOPS UOPS RETIRED TOTAL CYCLES
IDQ ALL MITE CYCLES ANY UOPS UOPS RETIRED CORE USED CYCLES IDQ UOPS NOT DELIVERED CORE UOPS RETIRED CORE STALL CYCLES
CAS COUNT RD CAS COUNT WR
CAS COUNT ALL
It should be mentioned that some of thesenon-additive PMCs such asP AP I L1 ICM and
Table 4.List of Non-additive Likwid PMCs
Event Name Maximum Percentage Error (%)
UNCORE CLOCK 16.98
CBOX CLOCKTICKS 16.98
SBOX CLOCKTICKS 17.08
WBOX CLOCKTICKS 17.57
BBOX CLOCKTICKS 16.98
PBOX CLOCKTICKS 16.98
RBOX CLOCKTICKS 16.98
QBOX CLOCKTICKS 17.57
HA R2 BL CREDITS EMPTY LO R2 NCB 45.27 HA R2 BL CREDITS EMPTY LO R2 NCS 48.28
HA R2 BL CREDITS EMPTY HI HA0 203.15
HA R2 BL CREDITS EMPTY HI HA1 213.15
HA R2 BL CREDITS EMPTY HI R2 NCS 250.56 OFFCORE RESPONSE 0 DMND DATA RD ANY 47.50
ICACHE IFETCH STALL 86.60
L2 RQSTS RFO HIT 27.44
ARITH DIVIDER UOPS 3075.23
IDQ UOPS NOT DELIVERED CYCLES LE 1 UOP DELIV CORE
163.64 IDQ UOPS NOT DELIVERED CYCLES LE 2
UOP DELIV CORE
89.16
L2 RQSTS L2 PF HIT 39.41
ICACHE HIT 105.45
RXL FLITS G0 DATA 176.62
OFFCORE REQUESTS OUTSTANDING ALL DATA RD
33.76
OFFCORE REQUESTS ALL DATA RD 42.45
IDQ MITE UOPS 42.06
L2 RQSTS ALL DEMAND DATA RD 52.76
L2 TRANS DEMAND DATA RD 24.29
L2 RQSTS ALL DEMAND DATA RD MISS 29.14 L2 RQSTS ALL DEMAND DATA RD HIT 35.09
L2 RQSTS ALL DEMAND DATA RD 39.43
L2 TRANS DEMAND DATA RD 52.43
L2 RQSTS ALL DEMAND DATA RD MISS 56.23 L2 RQSTS ALL DEMAND DATA RD HIT 72.32
L2 RQSTS ALL DEMAND DATA RD 35.03
L2 TRANS DEMAND DATA RD 75.24
L2 RQSTS ALL DEMAND DATA RD 80.33
RXL FLITS G2 NCB DATA 100
RXL FLITS G2 NCB NONDATA 100
TXL FLITS G0 DATA 100
TXL FLITS G1 DRS DATA 100
TXL FLITS G1 DRS NONDATA 100
TXL FLITS G2 NCB DATA 100
LSD UOPS 42
5.1. Core and Memory Pinning
We ran two sets of experiments, one with the application pinned to the cores and the other with the application pinned to cores and memory. While the percentage errors were reduced slightly when the application is pinned to both the cores and the memory, we observed that memory pinning has no effect on additive PMCs but, most importantly, non-additive PMCs remainednon-additive (within a tolerance of 5%).
6. Discussion
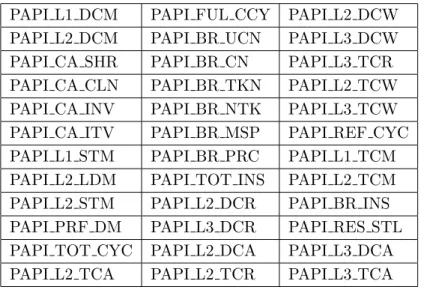
Table 5.List of potentiallyadditive PAPI PMCs
PAPI L1 DCM PAPI FUL CCY PAPI L2 DCW PAPI L2 DCM PAPI BR UCN PAPI L3 DCW PAPI CA SHR PAPI BR CN PAPI L3 TCR PAPI CA CLN PAPI BR TKN PAPI L2 TCW PAPI CA INV PAPI BR NTK PAPI L3 TCW PAPI CA ITV PAPI BR MSP PAPI REF CYC PAPI L1 STM PAPI BR PRC PAPI L1 TCM PAPI L2 LDM PAPI TOT INS PAPI L2 TCM PAPI L2 STM PAPI L2 DCR PAPI BR INS PAPI PRF DM PAPI L3 DCR PAPI RES STL PAPI TOT CYC PAPI L2 DCA PAPI L3 DCA PAPI L2 TCA PAPI L2 TCR PAPI L3 TCA
Table 6.List of non-additive PAPI PMCs
Event Name Maximum Percentage Error (%)
PAPI CA SNP 40.23 PAPI TLB DM 31.54 PAPI TLB IM 23.70 PAPI STL CCY 31.43 PAPI LD INS 32.06 PAPI SR INS 21.98 PAPI LST INS 45.87 PAPI L1 ICM 37.28 PAPI L2 ICM 37.50 PAPI L2 ICH 107.12 PAPI L2 ICA 30.65 PAPI L3 ICA 30.2 PAPI L2 ICR 30.65 PAPI L3 TCM 14.54 PAPI L3 LDM 74.68 PAPI L1 LDM 200.82 PAPI L3 ICR 19.48
The event ARITH DIVIDER UOPS exhibits the highest maximum percentage error of about 3075%. This event belongs to the µOP S group of Likwid PMCs responsible for gath-ering PMCs related to the instruction pipeline.
Several PMCs (HA R2 BL CREDITS EMPTY HI HA0,HA R2 BL CREDITS EMPTY HI HA1,
There are several PMCs that show maximum percentage error of about 100%. They are mainly from the QPI group of Likwid PMCs responsible for packetizing requests from the caching agent on the way out to the system interface.
Similarly, from Tab. 5 and Tab. 6 showingpotentially additive andnon-additive PAPI PMCs respectively, 17 PMCs out of a total of 53 PMCs are non-additive. One PMC, PAPI L1 LDM, demonstrates the highest maximum percentage error of about 200%. It represents L1 load misses. Another PMC, PAPI L2 ICH, demonstrates a maximum percentage error of over 100%. It rep-resents L2 instruction cache hits.
If we increase the tolerance to about 20%, then only 8 non-additive Likwid PMCs will become potentially additive. For PAPI, only two non-additive PMCs will become potentially additive,PAPI L3 TCM andPAPI L3 ICR. They represent L3 cache misses and L3 instruction cache reads respectively. Increasing the tolerance to about 30% results in other 3 non-additive
Likwid PMCs and 5 non-additive PAPI PMCs becoming potentially additive.
Thus, one can see that there are still a large number of PMCs that are non-additive even after increasing the tolerance to as high as 30%. Some of these PMCs have been used as key predictor variables in energy predictive models [2, 4–7, 10, 17, 20, 23, 27, 28].
To summarize, the non-additive PMCs that exceed a specified tolerance must be excluded from the list of PMCs to be considered as predictor variables for energy predictive modeling, because they can potentially damage the prediction accuracy of these models due to their highly non-deterministic nature. Also the list of potentially additive PMCs must be further tested exhaustively for more diverse applications and platforms to secure more confidence in their
additivity.
In our future work, we would study how much the prediction error is affected due to the presence of non-additive PMCs in all the linear predictive energy models that we surveyed.
Conclusion
Performance events (PMCs) are now dominant predictor variables for modeling energy con-sumption. Considering the large set of PMCs offered by modern processors, several techniques have been devised to select the best subset of PMCs to be used for energy predictive modeling. However, the existing techniques have not considered one fundamental property of predictor variables that should have been taken into account in the first place to remove PMCs unsuitable for modeling energy. We have addressed this oversight in this paper.
We proposed a novel selection criterion for PMCs called additivity, which can be used to determine the subset of PMCs that can potentially be considered for reliable energy predictive modeling. It is based on the experimental observation that the energy consumption of a serial execution of two applications is the sum of energy consumptions observed for the individual execution of each application. A linear predictive energy model is consistent if and only if its predictor variables are additive in the sense that the vector of predictor variables for a serial execution of two applications is the sum of vectors for the individual execution of each application.
In our future work, we would classify the non-additivity of a PMC into application-specific and platform-specific categories. We will also look at additivity of PMCs offered by accelerators such as Graphical Processing Units (GPUs). For instance, Nvidia GPUs provide CUDA Profiling Tools Interface (CUPTI) that provides functions to determine around 140 PMCs. However, implementing a compound application (or kernel) from two or more base applications (kernels) is not straightforward. While CUPTI allows a continuous event collection mode, we found it is not widely supported and hence unusable presently for implementation of compound applications.
Acknowledgement
This publication has emanated from research conducted with the financial support of Science Foundation Ireland (SFI) under Grant Number 14/IA/2474.
This paper is distributed under the terms of the Creative Commons Attribution-Non Com-mercial 3.0 License which permits non-comCom-mercial use, reproduction and distribution of the work without further permission provided the original work is properly cited.
References
1. Bircher, W.L., John, L.K.: Complete system power estimation using processor performance events. IEEE Transactions on Computers 61(4), 563–577 (Apr 2012), DOI: 10.1109/TC.2011.47
2. Chadha, M., Ilsche, T., Bielert, M., Nagel, W.E.: A statistical approach to power estimation for x86 processors. In: Parallel and Distributed Processing Sympo-sium Workshops (IPDPSW), 2017 IEEE International. pp. 1012–1019. IEEE (2017), DOI: 10.1109/IPDPSW.2017.98
3. CUPTI: Cuda profiling tools interface (2017), https://developer.nvidia.com/ cuda-profiling-tools-interface, accessed: 2017-04-10
4. Dauwe, D., Friese, R., Pasricha, S., Maciejewski, A.A., Koenig, G.A., Siegel, H.J.: Modeling the effects on power and performance from memory interference of co-located applications in multicore systems. In: Proceedings of the International Conference on Parallel and Dis-tributed Processing Techniques and Applications (PDPTA). p. 1. The Steering Committee of The World Congress in Computer Science, Computer Engineering and Applied Computing (WorldComp) (2014)
5. Dolz, M.F., Kunkel, J., Chasapis, K., Catal´an, S.: An analytical methodology to derive power models based on hardware and software metrics. Computer Science-Research and Development 31(4), 165–174 (2016), DOI: 10.1007/s00450-015-0298-8
6. Dolz Zaragoz´a, M.F., Kunkel, J., Chasapis, K., Catal´an Pallar´es, S.: An analytical methodology to derive power models based on hardware and software metrics (2015), DOI: 10.1007/s00450-015-0298-8
8. Goel, B., McKee, S.A., Gioiosa, R., Singh, K., Bhadauria, M., Cesati, M.: Portable, scalable, per-core power estimation for intelligent resource management. Green Computing Confer-ence, 2010 International (2010-08-16 2010), DOI: 10.1109/GREENCOMP.2010.5598313
9. Gschwandtner, P., Knobloch, M., Mohr, B., Pleiter, D., Fahringer, T.: Modeling CPU energy consumption of hpc applications on the IBM POWER7. In: Parallel, Distributed and Network-Based Processing (PDP), 2014 22nd Euromicro International Conference on. pp. 536–543. IEEE (2014), DOI: 10.1109/PDP.2014.112
10. Haj-Yihia, J., Yasin, A., Asher, Y.B., Mendelson, A.: Fine-grain power breakdown of mod-ern out-of-order cores and its implications on skylake-based systems. ACM Transactions on Architecture and Code Optimization (TACO) 13(4), 56 (2016), DOI: 10.1145/3018112
11. HCL: HCLWattsUp: API for power and energy measurements using WattsUp Pro Meter (2016), http://git.ucd.ie/hcl/hclwattsup, accessed: 2017-04-24
12. HCL: SLOPE-PMC: Towards the automation of pmcs collection for intel based multi-core platforms (2017), https://git.ucd.ie/hcl/SLOPE/tree/master/SLOPE-PMC, accessed: 2017-04-24
13. Intel Optimzed HPCG: Overview of the intel optimized hpcg, https://software.intel.com/ en-us/node/599524, accessed: 2017-04-24
14. IntelPCM: Intel performance counter monitor - a better way to measure cpu utiliza-tion. (2012), https://software.intel.com/en-us/articles/intel-performance-counter-monitor, accessed: 2017-04-22
15. Jarus, M., Oleksiak, A., Piontek, T., Wglarz, J.: Runtime power usage estimation of HPC servers for various classes of real-life applications. Future Generation Computer Systems 36 (2014), DOI: 10.1016/j.future.2013.07.012
16. Kadayif, I., Chinoda, T., Kandemir, M., Vijaykirsnan, N., Irwin, M.J., Sivasubramaniam, A.: vec: Virtual energy counters. In: Proceedings of the 2001 ACM SIGPLAN-SIGSOFT Workshop on Program Analysis for Software Tools and Engineering. pp. 28–31. PASTE ’01, ACM (2001), DOI: 10.1145/379605.379639
17. Lively, C., Wu, X., Taylor, V., Moore, S., Chang, H.C., Su, C.Y., Cameron, K.: Power-aware predictive models of hybrid (mpi/openmp) scientific applications on multicore systems. Com-puter Science-Research and Development 27(4), 245–253 (2012), DOI: 10.1007/s00450-011-0190-0
18. O’Brien, K., Pietri, I., Reddy, R., Lastovetsky, A., Sakellariou, R.: A survey of power and energy predictive models in HPC systems and applications. ACM Computing Surveys 50(3) (2017), DOI: 10.1145/3078811
19. PAPI: Performance application programming interface 5.5.1 (2017), http://icl.cs.utk.edu/ papi/, accessed: 2017-04-24
21. Song, S., Su, C., Rountree, B., Cameron, K.W.: A simplified and accurate model of power-performance efficiency on emergent GPU architectures. In: 27th IEEE International Par-allel & Distributed Processing Symposium (IPDPS). pp. 673–686. IEEE Computer Society (2013), DOI: 10.1109/IPDPS.2013.73
22. Treibig, J., Hager, G., Wellein, G.: Likwid: A lightweight performance-oriented tool suite for x86 multicore environments. In: Parallel Processing Workshops (ICPPW), 2010 39th International Conference on. pp. 207–216. IEEE (2010), DOI: 10.1109/ICPPW.2010.38
23. Wang, S.: Software power analysis and optimization for power-aware multicore systems. Wayne State University (2014), https://digitalcoomons.wayne.edu/oa dissertations/933/, accessed: 2017-04-24
24. Waterland, A.: Stress. https://people.seas.harvard.edu/∼apw/stress/ (2001), accessed: 2017-04-24
25. Wiki, P.: perf: Linux profiling with performance counters (2017), https://perf.wiki.kernel. org/index.php/Main Page, accessed: 2017-04-23
26. Witkowski, M., Oleksiak, A., Piontek, T., Weglarz, J.: Practical power consumption es-timation for real life HPC applications. Future Gener. Comput. Syst. 29(1) (Jan 2013), DOI: 10.1016/j.future.2012.06.003
27. Wu, X., Chang, H.C., Moore, S., Taylor, V., Su, C.Y., Terpstra, D., Lively, C., Cameron, K., Lee, C.W.: Mummi: multiple metrics modeling infrastructure for exploring per-formance and power modeling. In: Proceedings of the Conference on Extreme Science and Engineering Discovery Environment: Gateway to Discovery. p. 36. ACM (2013), DOI: 10.1145/2484762.2484773
28. Wu, X., Lively, C., Taylor, V., Chang, H.C., Su, C.Y., Cameron, K., Moore, S., Terpstra, D., Weaver, V.: Mummi: multiple metrics modeling infrastructure. In: Software Engineering, Artificial Intelligence, Networking and Parallel/Distributed Computing (SNPD), 2013 14th ACIS International Conference on. pp. 289–295. IEEE (2013), DOI: 10.1109/SNPD.2013.73