Journal of Global Pharma Technology
Available Online at:
www.jgpt.co.in
RESEARCH ARTICLE
Optimization and Validation of the Simultaneous Determination of
Vildagliptin and Metformin, in Bulk and Formulation by A
Reverse Phase HPLC Method Using D-Optimal Experimental
Design
Krishnan Balamurugan
*,
Kirtimaya Mishra
Department of Pharmacy, Annamalai University, Chidambaram, Tamilnadu-608002, India.
*Corresponding Author: K. Balamurugan
Abstract
This paper portrays a recently developed, optimized and validated isocratic RP-HPLC strategy for the separation of two anti-diabetic drugs Vildagliptin (VLD) and Metformin (MET).The optimization of the HPLC methodology included several variables, of which the impacts of each was studied. After a sequence of preliminary-screening experiments, the composition of the mobile phase and the pH of the added buffer solution were set as the examined variables, while the capacity factor (K1) of first peak i.e Metformin (MET), resolution (Rs) between Vildagliptin (VLD) and Metformin (MET), Separation (S) for both the drugs and the retention time (Rt2) of the second peak i.e Vildagliptin (VLD) were chosen as the dependent variables. Using the D-optimal design, the ideal chromatographic conditions for the separation were identified. The technique proved to show good harmony between the experimental data and predictive values throughout the studied parameter range. The optimum assay conditions were carried out with a Onyx C18 Monolithic column (100mm× i.d., 5µm) connected with an Onyx C18 guard cartridge (4mm×3mm i.d., 5µm) and a mixture of methanol (MeOH)/acetonitrile (ACN)/potassium dihydrogen orthophosphate (KH2PO4) (pH 4, 0.003 mol L−1) (31.362:10:58.638, v/v/v/v) as the mobile phase at a flow rate of 0.4 mL min−1 and detection wavelength of 220nm. The run time was under 8 min, which is a lot shorter than the prior optimized methods. The improved analytical method was validated as per FDA guidelines.
Keywords: D-optimal design; Vildagliptin; Optimization; Metformin.
Introduction
Vildagliptin (VLD) (Fig.1) is a potent dipeptidyl peptidase IV (DPP-IV) inhibitor, a drug of choice for the treatment of diabetes[1]. DPP-IV inhibitors represent a new class of oral antihyperglycemic agents to
treat patients with type-2 diabetes.
Chemically it is (S)-1-[N-(3-hydroxy-1- adamantyl) glycyl] pyrrolidine-2-carbonitrile.
DPP-IV inhibitors improve fasting and
postprandial glycemic control without
hypoglycemia or weight gain. Vildagliptin prevents the deactivation of GIP and GLP-1 by DPP-IV inhibitor, allowing GLP-1 and GIP to increase the secretion of insulin in the beta cells and put down the release of glucagon by the alpha cells of the islets of langerhans in the pancreas [2-4].
Metformin hydrochloride (MET) (Fig. 2) is an oral antihyperglycemic drug used in the management of type 2 diabetes [5-6]. Metformin is a member of the biguanide class of oral antihyperglycemics and is used particularly in overweight or obese peoples and those with normal kidney function.
Chemically it is N, Ndimethyl
imidodicarbonimidic diamide hydrochloride. Metformin improves glucose tolerance in
patients with type 2diabetes, lowering both basal and postprandial plasma glucose.
Metformin decreases hepatic glucose
production, decreases intestinal absorption of glucose, and improves insulin sensitivity by increasing peripheral glucose uptake and utilization. Metformin hydrochloride that is regarded as the main drug in mixed therapies of oral hypoglycemics [7-8].
Fig 2: Metformin
The combination of Metformin and
Vildagliptin offers advantages when
compared to currently used combinations with additive efficacy and complimentary mechanisms of action, since it does not increase the risk of hypoglycemia and does not promote weight gain. Therefore, by specifically combining these agents in a single tablet, there is considerable potential to achieve better blood glucose control and to improve compliance to therapy [9].
Literature survey reveals that few analytical methods have been reported for Metformin and Vildagliptin individually in biological fluids and in pharmaceutical dosage forms. Few analytical methods using HPLC for the estimation of VLD & MET [10-17], VLD & PIO [18-19], VLD with PIO AND GLP [20], VLD with SITA, LINA and MET [21] and VLD alone [22-26].
Some methods using LC-MS [27]. Few Plasma related analysis also available which gives idea about interaction between drug and plasma [28-29]. A QbD approach for the estimation of VLD also reported [30-32]. Spectrophotometric determination of VLD alone and in combination of other drugs also reported [33-36]. The objective of the present study was to develop and validate a simple, accurate and precise HPLC method for simultaneous determination of Metformin and Vildagliptin.
HPLC utilizes a wide selection of chromatographic factors, e.g., the type of column, the type and concentration of organic modifier, pH, buffer molarity, temperature
and flow rate, the optimization of experimental conditions can be quite a complicated process. Therefore, a systematic approach, such as experimental design [36] to optimize the HPLC method, is essential.
D-optimal design is a very efficient
experimental design for mixture and
mixture-process experiments and is
commonly used to reveal the main effects and interaction effects between the independent variables of the experiment in the least possible number of experiments [37].
Here, we have used this design to develop and optimize are producible HPLC method with a short run time and acceptable
resolution between Vildagliptin and
Metformin that could be used in more practical conditions. The large number of patients’ tested here demonstrates that our HPLC–UV method has sufficient selectivity, as the peak purities of the patients’ samples were checked and confirmed with a photo diode array detector. This is important because HPLC–UV is readily available in many labs and is much more inexpensive than mass spectrometers.
Experimental
Chemicals and Reagents
VLD and MET were purchased from Biotech Solutions, New Delhi. The mobile phase was filtered using 0.45µ nylon filters made by Millipore (USA) and was sonicated and
degassed using sonicator. HPLC
instrumentation and chromatographic
solvent delivery module, SPD-M20A prominence diode array detector, a Rheodyne injector (model 7125, USA) valve fitted with a 20µl loop. The system was controlled through a system controller (SCL-10A) and a personal computer using a Shimadzu chromatographic software (LC Solution, Release 1-11SP1) installed on it.
The mobile phase was degassed using Branson sonicator (Branson Ultrasonic Corporation, USA). Absorbance spectra were
recorded using an UV-double beam
spectrophotometer (Systronices 2202 Model UV-1601PC, Japan) employing quartz cell of 1 cm of path length. The mobile phase was
made out of MeOH: ACN: KH2PO4 at pH 4.0,
in the different proportions with a flow rate of 0.4 ml/min. HPLC system was worked at room temperature (25 ± 2°C). The readiness of standard arrangement A computed measure of 50 mg of VLD and MET was weighed and dissolved independently in methanol.The solution was sonicated for 15 minutes to totally dissolve both the components. Both stock solutions were combined and the volume was acclimated to 100ml.
The stock solution was further diluted to acquire a final concentration of VLD and MET for estimation. The arrangement was filtered through 0.45µ nylon filters before analysis. Calibration curves were set up by taking suitable aliquots from VLD and MET stock solutions in a volumetric flask and diluted up to the mark with mobile phase to acquire final concentrations of 2-10 µg/ml of
VLD and 2-10 µg/ml of MET. The standard solutions were infused through the 20µl loop system and chromatograms were gotten utilizing 0.4 ml/min flow rate and checked at 220 nm. A calibration curve was constructed by plotting average peak area against the concentration and regression equation was computed.
Software’s
Experimental design, data analysis, and desirability function calculations were performed by using the trial of version 11 of
Design-Expert® Software 2017. The
calculations for the analysis were performed by use of Micro soft Excel 2007 software (Microsoft, USA).
Optimization
The optimization of mobile phase condition was performed as per the experimental design employing a three-factor four level D-optimal using trial version 11 of Design-Expert® Software 2017 by selecting the
MeOH volume (Factor A), HCOOH
concentration (Factor B), FR (Factor C) as independent variables, while the Capacity
factor (K1), Resolution (Rs(1,2)), Separation
(S), Retention time (tR2) as responses.
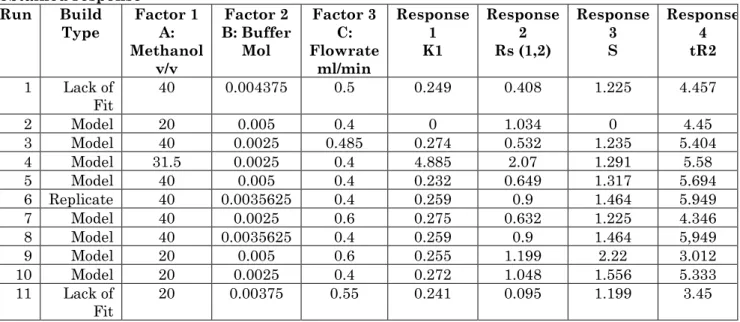
Response surface analyses were carried out to identify the effect of different independent variables on the observed responses. Table 1 illustrates total 15 experimental runs obtained from D-optimal design with their observed responses. The responses were statistically evaluated using the ANOVA procedure.
Table 1: Design matrix used for the optimization of mobile phase condition with their obtained response
Run Build
Type
Factor 1 A: Methanol
v/v
Factor 2 B: Buffer
Mol
Factor 3 C: Flowrate
ml/min
Response 1 K1
Response 2 Rs (1,2)
Response 3 S
Response 4 tR2
1 Lack of
Fit 40 0.004375 0.5 0.249 0.408 1.225 4.457
2 Model 20 0.005 0.4 0 1.034 0 4.45
3 Model 40 0.0025 0.485 0.274 0.532 1.235 5.404 4 Model 31.5 0.0025 0.4 4.885 2.07 1.291 5.58 5 Model 40 0.005 0.4 0.232 0.649 1.317 5.694 6 Replicate 40 0.0035625 0.4 0.259 0.9 1.464 5.949 7 Model 40 0.0025 0.6 0.275 0.632 1.225 4.346 8 Model 40 0.0035625 0.4 0.259 0.9 1.464 5,949 9 Model 20 0.005 0.6 0.255 1.199 2.22 3.012 10 Model 20 0.0025 0.4 0.272 1.048 1.556 5.333 11 Lack of
12 Model 20 0.0025 0.6 0.312 0.835 1.472 3.533
13 Replicate 20 0.005 0.4 0 1.034 0 4.45
14 Model 40 0.005 0.6 0.087 0.656 1.43 3.733 15 Center 30 0.00375 0.5 1.035 0.604 1.15 3.891
Further, the ideal condition was chosen by the numerical optimization method utilizing the desirability function. D-optimal has the upside of enhancement for experiments by utilizing 3k-factorial plan (where k=1, 2, 3 . .) having no less than three dependent variables or factors and more than one response as compared to other experimental designs, for example, central composite design (CCD) and fractional factorial design (FFD).
The general polynomial equation quadratic model is
Y = ß0 + ß1 X1 + ß2 X2 + ß3 X3 +ß12 X1X2 + ß13 X1X3+ß23 X2X3 +ß11 X12+ß22 X22+ß33 X32 + … Where, Y is the measured response associated with each factor level combination; ß0 is constant; ß1, ß2, ß3 are linear coefficients, ß12, ß13, ß23 are interaction coefficients between the three factors, ß11, ß22, ß33 are quadratic coefficients computed from the observed experimental values of Y from experimental runs and A, B and C are the coded levels of independent variables high (+), low (-) and center point (0). The terms AB and A2 represent the interaction and quadratic terms, respectively.
Validation
Linearity
The linearity of an analytical method is its ability to show a directly proportional relationship of a quantitative response to a specific concentration of an analyte within a given specified range of concentrations. The linearity of both the compound has been made by serial dilution of the stock solution using the suitable aliquots to yield calibration curves over the concentration range of 2-10 µg/ml and 2-10 µg/ml for VLD and MET respectively. Three replicate analyses of each of the concentrations were used to establish the calibration curve.
Accuracy
Accuracy was controlled by the injection of (n=5) of known concentrations of both drugs that had been set up from new stock solutions. The measured concentrations of these samples were extrapolated from a
calibration curve particularly created for the determination of the accuracy of the method. Precision
The precision of the proposed technique was assessed via completing five independent assays of VLD and MET over the
concentration ranges considered.
Intermediate precision was done by
analyzing the samples by a different analyst on another instrument. %RSD of all assays was obtained and calculated.
Recovery
Recovery of the method was determined by spiking the sample at three levels with 80%, 100% and 120% of standard solutions. These mixtures of both the compounds were investigated by the proposed method. The experiment was performed and their recoveries and % RSD were calculated.
Selectivity
To check the selectivity of the proposed method, a mixture of VLD and MET was set up with tablet formulation. The correlation of its area with the area of the standard solution was done along with the percentage recovery of both the analytes.
Limit of Quantitation (LOQ) and Limit of Detection (LOD)
The parameters LOD and LOQ were resolved based on the signal to noise ratio, LOD and LOQ were calculated by the strategy which depended on the standard deviation (SD) of response and the slope (S) of the calibration curve at levels approximating the LOD and LOQ.
LOD & LOQ were determined as follows.
LOD = 3.3 X Standard deviation of y-intercept / Slope of calibration curve
LOQ = 10 X Standard deviation of y-intercept / Slope of calibration curve
Robustness
(modified by ±2) and utilization of LC columns from various groups.
System Suitability Study
System suitability parameters were
estimated in order to verify the system
performance. System precision was
determined on six replicate infusions of
standard preparations. Exceedingly
important characteristics, including tailing factor and theoretical plate number were estimated. Use of the technique to dosage forms: A normal of ten tablets of VLD and MET were weighed and ground to fine powder.
Accurately measured powder sample
equivalent to (containing 10mg of LINA and
100mg of MET) was dissolved in
methanol.The flask was put in an ultrasonic bath at room temperature for 10min. After sonication, the solution was permitted to
remain for 5.0 min and 1.0 ml of sample was diluted with methanol. The sample was filtered and 0.5µl of this solution was injected. The average content of the tablets was resolved to utilize the corresponding regression equation.
Results and Discussion
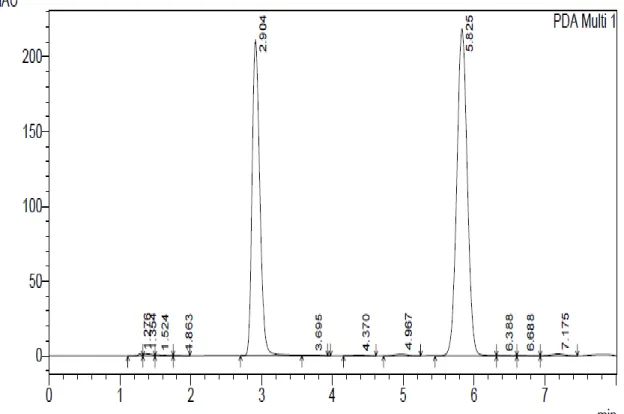
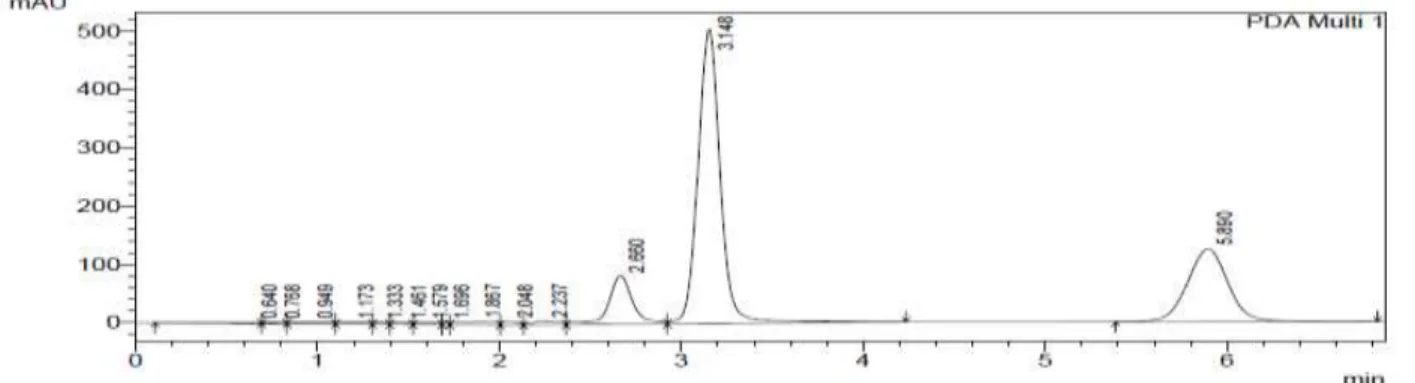
The reasonableness of mobile phase combination, flow rate, and pH was settled based on linearity, sensitivity, system suitability, selectivity, a lesser time required for analysis (low retention time), peak parameters. Out of a few attempted combinations, as recommended by D-optimal design, the mobile phase composition of the
methanol-phophate buffer indicated a
proficient chromatographic separation of VLD and MET (10µg/mL) with the retention time of 5.62 minutes and 2.82 minutes, respectively as appeared in Fig. 3.
Fig 3: Chromatogram of VLD and MET reference sample
The utilization of methanol in method development than other organic solvents is a cost-effective approach for the regular
routine analysis of pharmaceutical
formulations alone or in combination.
Optimization of mobile phase A an aggregate 15 compositions were prepared according to the experimental design and for resolution of peak and retention time for both the drugs.
The response surface analysis was done to
comprehend the impact of chosen
independent variables on the observed responses. In the present investigation, the
adjusted R2 was well within the acceptable
limits of R2 = 0.80 which uncovered that the
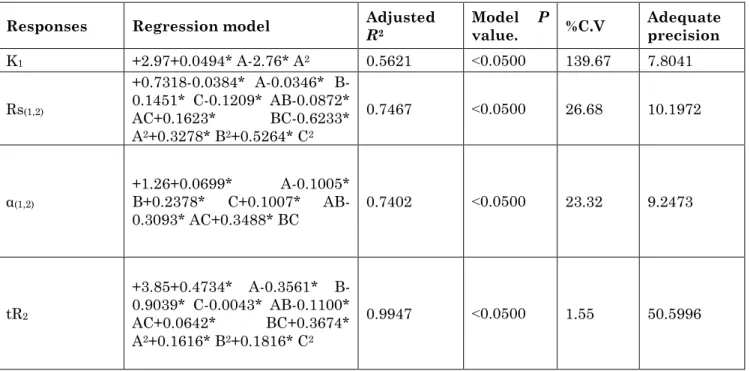
The adequate precision value is a measure of the signal (response) to noise (deviation) ratio”. A ratio greater than 4 is attractive. In this study, the ratio was observed to be in the range of 12.454-53.26, which demonstrates an adequate signal and in this way the model is significant for the separation process.
The coefficient of variation (C.V.) is a measure of reproducibility of the model and as a general rule, a model can be considered reasonably reproducible if it is lee than 10%. The C. V. for all the models was found to be less than 10%. Hence, the diagnostic plots,(a) normal probability plots [39] of residuals and (b) plot of residuals versus predicted values
[40] were analyzed for response K1, Rs(1,2),
α(1,2) and tR2. Since the assumptions of normality and constant variance of residuals were found to be satisfied, the fitted model for the K1, Rs (1,2), α (1,2), tR2 was accepted. As can be seen in (Table 2), the interaction term with the largest absolute coefficient among
the fitted models is BC (+ 1.09) of tR2 model.
The positive interaction between B and C is
statistically significant (<0.0001) for tR2. The
study reveals that changing the fraction of the concentration of HCOOH from low to high results in a rapid decline in the retention time of VLD and MET. Further at increased FR, a decrease in the retention time observed. Especially this interaction is synergistic, as it led to a decrease in runtime.
Table 2: Response models and statistical parameters obtained from ANOVA for D-optimal
Design
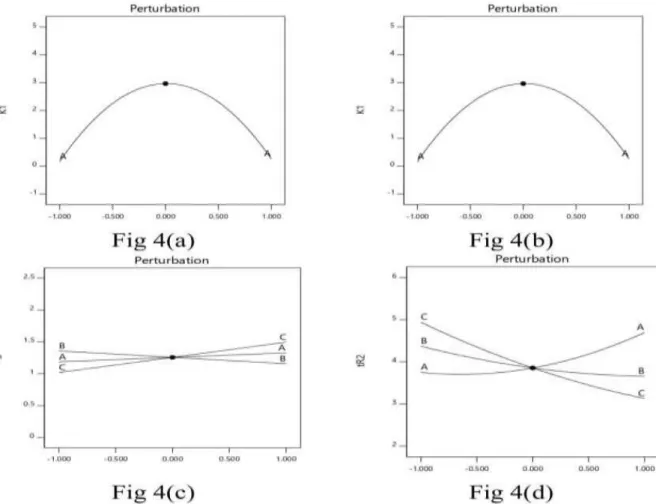
In (Fig.4) perturbation plots are presented for predicted models in order to gain an effect of an independent factor on a specific response with all other factor held constant at a reference point. A steepest slope or curvature indicates sensitiveness of the response to a specific factor. (Fig 4d) shows that MeOH (factor A) had the most important effect on a
retention time tR2 followed by factor B and C.
In (Fig 4C) the factors (pH and flow rate) had
significant effect on Rs (1,2) and α(1, 2) and only
one factor A had significant effect on K1. In
(Fig 4a) and (Fig 4b), K1 and Rs (1, 2) values increased as the level of MeOH concentration
(factor A) decreased and Rs (1, 2) values
increased at the level of HCOOH
concentration (factor B) and Flow rate (factor C) are at midpoint.
Response surfaces plots for K1, Rs(1,2) and α(1,2)
and tR2 are illustrated in (Fig. 5) (%
Methanol concentration is plotted against the pH Flow rate held at constant at the center value). Analysis of perturbation plots and response plots of optimization models revealed that factor A and B had the significant effect on a separation of the analytes, whereas the factor C i.e. the Flow rate, is of little significance.
Responses Regression model Adjusted R2 Model value. P %C.V Adequate precision
K1 +2.97+0.0494* A-2.76* A2 0.5621 ˂0.0500 139.67 7.8041
Rs(1,2)
+0.7318-0.0384* A-0.0346* B-0.1451* C-0.1209* AB-0.0872* AC+0.1623* BC-0.6233* A2+0.3278* B2+0.5264* C2
0.7467 ˂0.0500 26.68 10.1972
α(1,2) +1.26+0.0699* B+0.2378* C+0.1007* A-0.1005*
AB-0.3093* AC+0.3488* BC 0.7402 ˂0.0500 23.32 9.2473
tR2
+3.85+0.4734* A-0.3561* B-0.9039* C-0.0043* AB-0.1100* AC+0.0642* BC+0.3674* A2+0.1616* B2+0.1816* C2
Fig 4: Perturbation plots showing the effect of each independent variables on (a) K1, (b) Rs(1,2)
(c) α (1,2), (d) tR2 Where A is the MeOH concentration, B the HCOOH concentration,C the flow
rate
Fig 5: Response surfaces related to MeOH (A) Concentration of HCOOH (B) Flow rate of
mobile phase (C): (a) capacity factor first peak (K1), (b) resolution of the critical pair Rs(1,2) (c)
Figure 4a delineates a response surface plot, characterizing the increase in the retention
time increased with increasing the
concentration of methanol, though an increase in flow rate increase in retention time took after by a steady decline. Subsequently, it can be uncovered that at the intermediate levels of flow rate the retention time was found to be optimized. Similarly, Figure 4b portrays a connection between pH of the mobile phase and retention time of the two drugs.
It was watched that the increase in pH of mobile phase does not fundamentally influence the retention time. All the response surfaces were best fitted with quadratic polynomial models and ready to foresee the communication impacts as well. At long last, the model was observed for ANOVA (p<0.001), which uncovered that the model
terms for main effects and interaction effects were statistically significant. At long last, optimized mobile phase condition was chosen by numerical point prediction optimization method from the software having the desirability value as 1. The composition of the optimized condition was observed to be MeOH (60%), FR (0.4 ml/min), pH (4) respectively.
Linearity
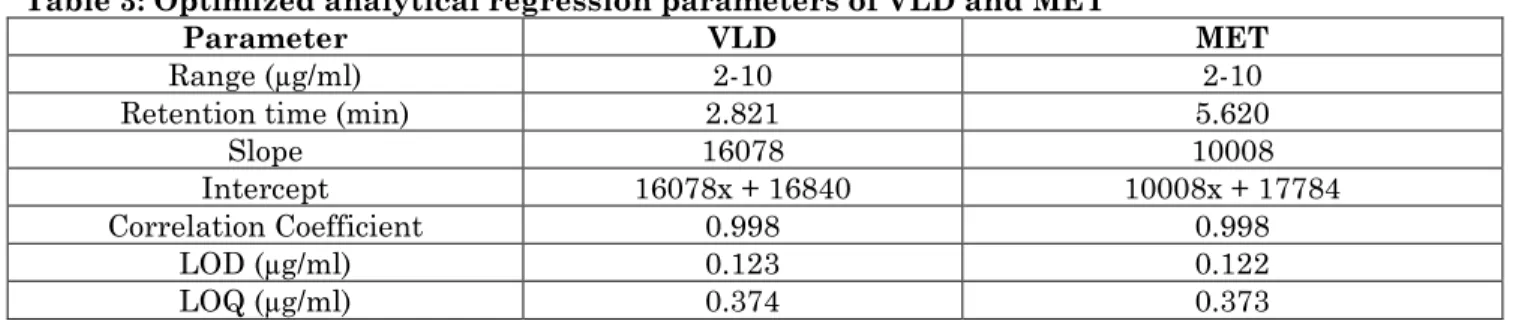
The results of the validation procedure for linearity reveal that the above assay was linear over the concentration range 2-10 µg/ml for VLD and 2-10 µg/ml for MET. The regression coefficients were found to be 0.998 for VLD and 0.998 for MET. The relevant equations for these are Y = 16078x + 16840 and Y= 10008x + 17784 for VLD and MET respectively, shown in Table 3.
Table 3: Optimized analytical regression parameters of VLD and MET
Parameter VLD MET
Range (µg/ml) 2-10 2-10
Retention time (min) 2.821 5.620
Slope 16078 10008
Intercept 16078x + 16840 10008x + 17784
Correlation Coefficient 0.998 0.998
LOD (µg/ml) 0.123 0.122
LOQ (µg/ml) 0.374 0.373
Accuracy
The accuracy of the samples has been computed from measured concentrations of these samples were extrapolated from calibration curve particularly produced for the determination of the accuracy of the
method. The results of accuracy studies for both the compounds VLD and MET are summarized in Table 4. It is clearly evident from the result that, %RSD of both compounds was found to be less than 2 hence the method can be considered accurate.
Table 4: Accuracy of VLD and MET by the optimized RP-HPLC method
Drug Level (%) % Recovery % RSD
VLD 80 100.1 0.0044
100 98.48 0.0302
120 99.9 0.0050
MET 80 99.02 0.0087
100 99.4 0.0167
120 100.07 0.0086
Precision
Precision was evaluated by the estimation of inter-day precision by assay of three different concentrations of VLD and MET (2, 4 and 6 µg/ml) at various time interims in the different day and interday exactness by repetition for same days.
within the acceptable limit. The method demonstrated good precision for both drugs. Specificity and Selectivity
Specificity and selectivity were studied for the examination of the presence of interfering components in the working solution of VLD and MET. The results indicate that the retention time of VLD and MET is at 5.62 and 2.82 minutes, respectively. There is no variation in the retention time of both the compounds as compared with the standard drug solution. They are free from interference from formulation excipients and solvent from each other. This indicates the method is selected and specific for determination VLD and MET simultaneously.
Limit of Detection & Limit of Quantification
The LOD and LOQ of VLD were found to be 0.123 and 0.374µg/ ml, respectively, while for
MET were 0.122 and 0.373µg/ml,
respectively. The values (Table 3) indicated that the method was very sensitive to quantify both the drugs.
Robustness
In the developed RP-HPLC technique, little
consider varieties in the optimized method parameters were finished. The impact of the
change in wavelength and buffer
concentration and utilization of LC columns from various batches, on the percent recovery of both the compounds, was considered. The results showed that the slight variations in the chromatographic conditions used to study the effect have shown a negligible variation on the retention time of both drugs showing the method is highly robust for its intended use.
Application of the Method to Dosage Forms
The developed HPLC method is sensitive and specific for the quantitative assurance of VLD and MET. The technique was approved for various parameters and, consequently has been applied for the estimation of the drug in pharmaceutical dosage forms. The in-house created tablets of were evaluated for the measure of drug present in the formulation. Each sample was analyzed in triplicate after extracting the drug as mentioned in the sample preparation of the experimental section. The recovered amount of VLD and MET were 99.88% and 99.99%, respectively Table 5.
Table 5: Assay for VLD and MET in tablet formulation
Drug Labeled
Amount (mg) Amount Found (mg) % Recovery % RSD
VLD 2.5 2.49 99.88 0.2205
MET 500 499.99 99.99 0.0052
None of the tablet ingredients interfered with the analyte peak. The method was validated for linearity, precision, accuracy, sensitivity, system suitability, and robustness was proved to be convenient and effective for the quality control as well as simultaneous routine analysis of VLD and MET in pharmaceutical dosage forms. The measured signal was shown to be precise, accurate, and linear over the concentration range tested
with a retention time of 5.62min and 2.821min makes it economical due to lower solvent consumption. The % RSD for all parameters was observed to be under two, which shows the validity of technique and assay results obtained by this method are in reasonable agreement. Chromatogram of VLD and MET in tablet dosage form has appeared in Fig. 6.
Also, it can be used for determination of content uniformity and dissolution profiling of product, where sample load is higher and high throughput is basic for speedier delivery of results.
Conclusion
A simple, rapid, sensitive and economical analytical method has been effectively created utilizing the precise approach for evaluation of VLD and MET in bulk drug and also in-house tablet formulations. The ideal setting of chromatographic conditions was in the analytical design space utilizing the desirability function. Validation of the method verified phenomenal linearity, accuracy, precision, system suitability, specificity, and robustness. Further, the tentatively watched estimations of LOD and LOQ of the two drugs were additionally very lower. The method demonstrated a high level of practical utility for estimation of combination drugs in pharmaceutical dosage.
Acknowledgment
Our thanks to Department of Pharmacy, Annamalai University, Chidambaram for the laboratory facilities provided to an outcome of this investigation. We are thankful to UGC for the financial support through UGC BSR Fellowship.
Role of the Funding Source
The author Kirtimaya Mishra received
grants from UGC-BSR
(F.25-1/2014-15(BSR)/7-269/2009(BSR), dated 07.10.2015).
References
1. R. Mentlein (1999) Dipeptidyl-peptidase
IV (CD26)-role in the inactivation ofregulatory peptides. Regul. Pept., 85(1): 9-24.
2. A.E. Weber (2004) Dipeptidyl peptidase
IV inhibitors for the treatment
ofdiabetes. J. Med. Chem., 47: 4135-4141.
3. C.H.S. McIntosh, H.U. Demuth, J.A.
Pospisilik and R. Pederson (2005) Dipeptidyl peptidase IV inhibitors: how do they work as newantidiabetic agents?,Regul. Pept., 128(2): 159-165.
4. G.R. Lankas, B. Leiting, R. Sinha Roy
and G.J. Eiermann (2005)
Dipeptidylpeptidase IV inhibition for the
treatment of type 2 diabetes
potentialimportance of selectivity over
dipeptidyl peptidases 8 and 9. Diabetes, 54(10):2988-2994.
5. The Merck Index, 14th Edn., Merck &
Co., Inc., Whitehouse Station, NJ,USA, 2006; 1025.
6. CIMS (Current Index of Medical
Specialities), UBM Medica India Pvt. Limited, Bangalore, 2012; October: 356.
7. IDR Drug Triple I Compendium (Indian
Drug Review), UBM Medica India Pvt. Limited, Bangalore, 2012; 5:146.
8. Indian Pharmacopoeia, Govt. of India,
Ministry of Health & FamilyWelfare, The Indian Pharmacopoeia Commission, Ghaziabad, 2010; 2:1657.
9. M. A. Banerji, D. Purkayastha and B.H.
Francis (2010) Safety and tolerabilityof Vildagliptin vs. Thiazolidinedione as add-on to Metformin in type 2diabetic patients with and without mild renal impairment: Aretrospective analysis of the galiant study. Diabetes Res. Clin. Pr., 90(2):182-190.
10. M.A.A. Mohammad, E.F. Elkadyb and
M.A. Fouadb (2012) Development
andvalidation of a reversed‐phase
column liquid chromatographic
methodfor simultaneous determination
of two novel gliptins in their
binarymixtures with Metformin. Eur. J. Chem., 3(2):152-155.
11. B. Santhosha, A. Ravindranath and Ch.
Sundari (2012) Validated method for the simultaneous estimation of Metformin hydrochloride andVildagliptin by RP-HPLC in bulk and the pharmaceutical dosage form.Int. Res. J. Pharm. App. Sci., 2(3):22-28.
12. N. Subhakar, V. Krishna Reddy and T.
Ravindranadh Reddy (2012)
Development and validation of RP-HPLC method for simultaneousdetermination of Vildagliptin and Metformin in bulk and formulationdosage. Int. Res. J. Pharm. App. Sci., 2(3):44-50.
13. B.M. Ishaq, K.V. Prakash and G.K.
Mohan (2012) RP-HPLC method for simultaneous estimation of Metformin and Vildagliptin in Bulk and its Tablet Formulation. J. Global Trends Pharm. Sci., 3(3):747-754.
14. Gattu Madhava Prathap,
B (2014) Development and Validation of
Simultaneously Estimation of
Vildagliptin & Metformin Hydrochloride by RP-HPLC in Bulk and Oral Dosage Form. Int. J. Adv. Pharm Gen. Res., 2(1):24-33.
15. Shrikrishna B. Baokar, Sugandha V,
Mulgund and Nisharani S. Ranpise. Development and Validation of
RP-HPLC Method for Simultaneous
Estimation of Vildagliptin and
Metformin. Research J. Pharma. Dosage Forms and Tech., 2013; 5(2): 95-98.
16. P.S.R CH N.P Varma D, A. Lakshmana
Rao and S.C. Dinda (2013) Simultaneous
Determination of Metformin and
Vildagliptin in Solid Dosage Form by Stability Indicating RP-Hplc Method. International Research Journal of Pharmacy, 4(1):122-128.
17. B. Thangabalan, K. Manohar and S.
Manohar Babu (2014) Method
Development and Validation for The Simultaneous Estimation of Vildagliptin and Metformin in Tablet Dosage Form by Rp-Hplc. International Journal of Research in Pharmaceutical and Nano Sciences., 3(2): 80-87.
18. Hitesh P. Inamdar, Ashok A. Mhaske ,
Shirish P. Sahastrabudhe (2013) A
Revised Rp-Hplc Method for
Simultaneous Determination of
Vildagliptin and Pioglitazone Hcl-Application to Commercially Available Drug Products. International Journal of Pharmaceutical Sciences and Research. 4(2):847-855.
19. Manoj Charde, SK Jafar and Rita
Chakole (2016) Development of
Validated Analytical method for
Estimation of Metformin and
Pioglitazone in Pharmaceutical Dosage
Form. International Journal of
Pharmaceutical Chemistry, 06 (01): 29-41.
20. Mohammed M. Amin, Salah A.
Abdel-Aziz, Samia M. Mostafa and Sobhy M.
El-Adl. (2017) Optimization and
Validation of HPLC Method for
Simultaneous Determination of
Vildagliptin, Pioglitazone Hydrochloride and Glimepiride in Bulk and Tablets. IOSR Journal of Pharmacy and Biological Sciences, 12 (2):18-27.
21. Mahesh Attimarad, Sree Harsha
Nagaraja, Bandar E Aldhubaib, Anroop Nair and Venugopala KN (2014)
Simultaneous Determination of
Metformin and Three Gliptins in Pharmaceutical Formulations Using RP HPLC: Application to Stability Studies on Linagliptin Tablet Formulation. Indian Journal of Pharmaceutical Education and Research, 48(4):46-53.
22. Razia Sultana, Sitesh C. Bachar and
fatema Rahman (2013) Development and Validation of Stability Indicating Assay Method of Vildagliptin in Bulk and Tablet Dosage Form by RP-HPLC. International Journal of Pharmacy & Life Sciences, 4(4):2530-2534.
23. K. Hanumantha Rao, A. Lakshmana Rao
and KB. Chandra Sekhar (2014) Development and Validation of Hplc
Method for the Estimation of
Vildagliptin in Pharmaceutical Dosage Form. International Journal of Pharmaceutical, Chemical and Biological Sciences, 4(2):361-366.
24. Aparajita Malakar, Bishwajit Bokshi
and Dilruba Nasrin (2012) Development and Validation of Rp-Hplc Method for Estimation of Vildagliptin from Tablet Dosage form. International Journal of Pharmaceutical and Life Sciences, 1(1):1-8.
25. Prem Kumar Bichala and Dr.A.
Lashmana Rao (2014) New Method Development and Validation of New RP-HPLC Methodfor the Estimation of Vildagliptin in Bulk and Tablet Dosage
Form. International Journal of
Pharmaceutical Research and Bio-Science, 3(1):450-458.
26. Rahima Khatun and Md. Mirazunnabi
((2013) A Validated Reversed-Phase Hplc Method for the Determination of Vildagliptin from Tablet Dosage Form. International Journal of Pharmaceutical and Life Sciences, 2(3): 90-98.
27. Caroline Paola Uber, Flávia Lada
Degaut Pontes, João Cleverson
Gasparetto, Thais Martins Guimarães De Francisco, Mário Sérgio Piantavini, Marco André Cardoso and Roberto Pontarolo (2014) HPLC-MS/MS Method for Simultaneous Quantification of Vildagliptin, Metformin, And
International Journal of Pharmacy and Pharmaceutical Sciences, 6(11):203-207.
28. J. Martín, W. Buchberger, J. L. Santos,
E. Alonso and I. Aparicio (2012) High Performance Liquid Chromatography
quadrupole time-of-flight
massspectrometry method for the
analysis of antidiabetic drugs in aqueous environmental samples. J. Chromatogr. B, 895-896: 94-101.
29. A. B. Pharne, B. Santhakumari, A. S.
Ghemud, H. K. Jain and M. J. Kulkarni
(2012) Bioanalytical Method
Development and Validation of
Vildagliptin A Novel Dipeptidyl
Peptidase IV Inhibitor by Rp-Hplc
Method. International Journal of
Pharmacy and Pharmaceutical Science, 4(3):119-123.
30. Mahesh Attimarad, Sree Harsha
Nagaraja, Bandar E. Aldhubaib and Ahmed Al-Najjar (2014) Development of a rapid reversed phase-high performance liquid chromatography method for
simultaneous determination of
metformin and vildagliptin in
formulation and human plasma. Journal of Young Pharmacists, 6(4):40-46.
31. A. M. Kashid, D.A. Ghorpade, P.P.
Toranmal and S.C. Dhawale (2015) Development and Validation of Reversed
Phase HPLC Method for the
Determination of Vildagliptin Using an
Experimental Design. Journal of
Analytical Chemistry, 70(4):510-515.
32. Sharifa Sultana, Uttom Kumar, Md.
Shahadat Hossain, Dilshad Noor Lira and Abu Shara Shamsur Rouf (2017) QbD Approach for the Development and Validation of RP-UHPLC Method for Quantitation of Vildagliptin. Dhaka Univ. J. Pharm. Sci., 16(1):107-117.
33. Ahmed RM, Ibrahim A, El-Gendy AE
and Hadad GM (2018) Implementing a
Quality by Design Approach in
Chromatographic Determination of Some
Antidiabetic Drugs. SF Journal of
Pharmaceutical and Analytical
Chemistry, 1(1):1-9.
34. Ola Mahmoud Younes, Joumaa Al-
Zehouri and Habib Abboud (2014) Spectrophotometric Method for the Determination of Vildagliptin in Bulk and Pharmaceutical Dosage Forms. Int. J. Pharm. Sci. Rev. Res., 29(1):33-36.
35. Sujan Banik, Palash Karmakar and Md.
Anowar Hossain Miah (2015)
Development and Validation of a
UV-Spectrophotometric Method for
Determination of Vildagliptin and Linagliptin in Bulk and Pharmaceutical
Dosage Forms. Bangladesh
Pharmaceutical Journal, 18(2):163-168.
36. Dr. Safila Naveed, Hina Rehman and
Fatima Qamar1and Syeda Zainab (2014) Method development and validation of
Vildagliptin using UV
spectrophotometer. International
Journal of Pharma Sciences and Research, 5(10): 714-717.
37. Beg, S., Kohli, K., Swain, S., Hasnain,
M.S. (2011) Development and validation of RP-HPLC method for quantitation of amoxicillin trihydrate in bulk and pharmaceutical formulations using Box-Behnken experimental design. Journal of Liquid Chromatography and Related Technologies. 35:393-406.
38. Baokar Shrikrishna, Mulgund S.V and
Ranpise N.S. (2013) Simultaneous
spectrophotometric estimation of
vildagliptin and metformin in bulk and tablet dosage form. Der Pharma Chemica, 5(1):24-27.
39. R.L. Mason, R.F. Gunst, J.L. Hess,
Statistical Design and Analysis of
Experiments,2nd ed., John Wiley & Sons
Inc., New York, 2003.
40. G.A. Lewis, D. Mathieu, R.
Phan-Tan-Luu, Pharmaceutical Experimental