Abstract
This research h status and
infant health. Nearly half of all pregnancies in the United States are unintended, which presents a significant public health challenge, as women often do not start necessary healthy practices until they first discover their pregnancies. Several risk factors that have been shown to influence fetal development can develop in women months or years before pregnancy. In this research, the pregnancy outcomes that are examined include the probability of pregnancy, the probability of a live birth, length of gestation, and birth weight
measured by self-reported fair/poor health status, Body Mass Index, and smoker status at the time of pregnancy as well as one, two, and three years prior to pregnancy.
preconception health status on pregnancy outcomes is investigated by several estimation methods designed to reduce bias in the estimated marginal effects. These estimators include Ordinary Least Squares, fixed effect, random effect, and Heckman selection. The research employs data from all four waves of the National Longitudinal Study of Adolescent Health. However, instead of analyzing the responses at each wave, information in the survey was used to identify the timing of all births to a woman in the sample, expanding a 4-wave panel data set into a 21-year panel data set. Hence, an rs prior to pregnancy, allowing for a yearly hazard model of pregnancy. Self-reported fair/poor health one and three years prior to pregnancy has a positive impact on the pregnancy probability on older women (age>21) but a negative impact for younger women (age<21). Being underweight one and three years prior to pregnancy negatively affects pregnancy probability. Smoking prior to pregnancy has a negative impact on the probability of a live birth and birth weights of infants. Our findings suggest that we can
Acknowledgement
First and foremost, I would like to express my utmost gratitude to my advisor, Dr. Donna Gilleskie for her dedication, patience, enthusiasm, and immense knowledge. This study
support. No matter it was the research process or writing of this paper, Dr. Gilleskie was there every step along the way. She is someone so dedicated that she is willing to meet with me almost 6 hours a week on average. Whenever I emailed her, even if it was late at night or she was away on a family vacation, she responded at her earliest convenience. Her level of dedication and care for her students is something I aspire to acquire in my professional career. Beyond the scope of the project, Dr. Gilleskie has been an amazing mentor whom I am honored to seek professional and life advice from. Working with her has motivated me to go above and beyond for my work and offer support for others when I am in a position to do so. I could not imagine having a better advisor and mentor.
In addition, my sincere thanks also go to Dr. Geetha Vaidyanathan, who was there to support me whenever I needed advice and feedback for my research. Her words of encouragement motivated me to put in my best effort for this research.
I would also like to thank Dr. David Guilkey, Dr. Cathy Zimmer, Dr. Steven Lich-Tyler, and Joyce Tabor, for offering me statistical advice when using the Add Health dataset and Dr. Jeremy Petranka for his continuous support and connecting me to Dr. Gilleskie in the first place.
Furthermore, I greatly appreciate my fellow classmates in the thesis class and my housemates who have offered me valuable support and encouragement along the way.
I. Introduction
Most women experience childbearing during their lifetime. About half of all women in the United States have experienced at least one birth by the age of 25 and 85% have given birth by age 45 (CDC, 2006). Human reproduction is influenced by a combination of genetic, biological, environmental, and behavioral processes. Favorable health status of adults facilitates pregnancy attempts, successful reproduction, and better health outcomes of infants. In contrast, risk factors such as smoking, high levels of alcohol intake, obesity, and under-nutrition can disrupt reproductive capacity and result in less than optimal pregnancy outcomes.
Preconception health refers to the health of women and men during their reproductive years, before pregnancy begins (CDC, 2006). Improving preconception health can lead to better reproductive health outcomes (Moos, 1987). Attempts to improve preconception period is because initiation and progression of several risk factors that affect fetal development and pregnancy outcomes often occurs before women even know that they are pregnant (US Department of Health and Human Services, 1989; Moos, 2002, 2003 & 2004). If women attempt to improve their health status only after getting pregnant, it may be too late. For example, the CDC (2006) notes that preventative interventions for several conditions that are associated with negative pregnancy outcomes are only effective before conception. If identified before conception, such negative conditions could be modified through clinical and behavioral interventions.
Hence, the potential warrants
unintended pregnancies, women often do not begin necessary health improvement practices until they discover they are pregnant.
In this research, we empirically examine
preconception health status and health of the infants. Using the National Longitudinal Study of Adolescent Health (Add Health), we evaluate the impact o
health, measured by self-reported health status, Body Mass Index (BMI), and smoker status, on pregnancy outcomes. A common measure of infant health is infant birth weight. We also
birth, and the probability
health status several years prior to pregnancy. Following individuals over time and evaluating the role of preconception health over several years on annual pregnancy rates and outcomes allows us to locate the specific time periods when this relationship is most significant, which to our knowledge has not been studied in the current literature. We find that self-reported fair/poor health one and three years prior to pregnancy has a positive impact on the pregnancy probability for older women (age>21) but a negative impact for younger women (age<21). Being underweight at one and three years prior to pregnancy negatively affects pregnancy probability. Smoking during preconception has a negative impact on the probability of a live birth and birth weights of infants
II. Literature Review
Although the idea of preconception health has been around since the 1960s, it was not until nearly 40 years later that the public health community started paying attention to it. In 2005, the Centers for Disease Control and Prevention (CDC) and March of Dimes called for a national summit (CDC, 2006) to address the slow improvement in infant mortality rates and the widening imbalance in adverse pregnancy outcomes (Martin et al., 2009; Mathews & MacDorman, 2010), which remain as high-priority public health and socioeconomic problems (Hamilton, Martin, & Ventura, 2007; Institute of Medicine [IOM], 2006). IOM estimated that the annual economic burden related to preterm birth in 2005 was $51,600 per infant, which contributes to more than $26.2 billion for the entire United States (IOM, 2006). In addition, such costs of preterm and low birth weight are more likely to affect low-income and minority families (Gilbert, Nesbitt, & Danielsen, 2003; IOM, 2006; Petrou, 2003; RAND, 1998).
patients to miss the period when health care interventions could be the most effective (Moos, 2004).
Since it is insufficient and difficult to administer interventions during pregnancy alone, it is important to situate
overall health and lifespan. There are multiple conceptual frameworks developed for this purpose. Lu and Halfon (2003) supported a life course perspective for which factors that affect pregnancy potential/outcomes start with early life experiences and accumulate fertile period. Misra, Guyer and Allston (2003) supported another
reproductive stages. Kotelchuck (2003) also noted that differentiating the various stages of the preconception period is important because we need to understand the timing of risk factors and their impact to pinpoint the optimal intervention points. This is one of the areas that this research could potentially contribute to the current literature. This research looks at multiple ye
as well as pregnancy outcomes by year. This empirical method could potentially determine specific points along the preconception timeline when optimal intervention could happen. In addition, to our knowledge, no current study in the literature has used the Add Health dataset, collected in four different waves (1995, 1996, 2000, and 2008) to construct and estimate a dynamic model of annual behavior. Hence, this study adds a new dimension for the utilization of a very rich dataset.
than 40% of women are overweight or obese in the preconception stage. Maternal obesity prior to pregnancy adversely affects pregnancy outcomes mainly through higher rates of hypertensive disease, diabetes, cesarean section, and infection. In a study on pre-pregnancy and pregnancy-related factors and the risk of excessive or inadequate gestational weight gain, Brawarsky et al. (2005) followed a cohort of 11,100 pregnant women who delivered a full-term infant. Pre-pregnancy factors accounted for 74% of excessive gestational weight gain, substantially more than pregnancy-related health conditions, which was only 15%. Hence, efforts to prevent excessive gestational weight gain need to start before pregnancy. Kristensen et al. (2005) also concluded from a cohort study of pregnant women receiving routine antenatal care in Denmark that maternal obesity was associated with a more than doubled risk of stillbirth and neonatal death compared to those of normal weight.
Aside from weight-related risk factors, other factors during the preconception period could result in adverse outcomes as well. One of the reasons that preconception health is important is that several risk factors affect fetal development and pregnancy outcomes and the greatest effect often occurs before women even know that they are pregnant (US Department of Health and Human Services, 1989). For example, folic acid needs to start at least 3 months before conception. Exposure to tobacco, alcohol and other drugs, workplace hazards and lack of essential vitamins months before pregnancy do result in complications and poorer outcomes for both the mother and the infant (CDC, 2002). In reality, many women engage in high-risk behaviors during their reproductive age. In 2003, 11% of pregnant women smoked during pregnancy and 10% consumed alcohol (CDC, 2002).
pre-pregnancy diastolic blood pressure and average arterial pressure reactivity were related to higher risk of preterm birth at first pregnancy. Ronnenberg et al. (2002, 2004) conducted several studies to look at preconception health status of women and pregnancy outcomes. In one study (2002), they sampled a group of Chinese women between age 21 and 34. Women were excluded from the study if they had previous pregnancy attempts or were pregnant at the time of the interview. They were monitored during any ongoing pregnancies or up to one year after they attempted to conceive. Infants born before 37 weeks of completed gestation were defined as preterm cases (n=29) and as term controls (n=405) otherwise. Ronnenberg et al. concluded that higher homocysteine level during the preconception period was related to an almost 4-times higher risk of preterm birth, which was also significantly lower among those who are not vitamin B-deficient. Following the same group of Chinese women, Ronnenberg et al. (2004) also examined the relationship between preconception anemia, iron deficiency, and pregnancy outcome. Women with moderate anemia had significantly higher risks of low birth weight and fetal growth restriction. Many studies have shown that anemia and iron deficiency during the prenatal period are closely related to adverse pregnancy outcomes. However, Ronnenberg et al. further demonstrated that anemia during the preconception period needs to be carefully addressed as well.
Denny et al. (2012) examined the prevalence of five risk factors among non-pregnant women from 18-44 years old, focusing on racial and ethnic disparities. These five risk factors include at-risk drinking, cigarette smoking, obesity, diabetes, and frequent mental distress. Data was obtained from the 2008 Behavioral Risk Factor Surveillance System (n=54,612). Most women had at least one risk factor, while 18.7% had two or more. Women were more likely to have two or more risk factors when they were: American Indian and Alaska Native, not educated beyond high school, unemployed, single, and not receiving enough social and emotional support (Denny et al., 2012). High prevalence rate of preconception risk factors further calls for the need to improve preconception care.
One major study that aims to address this question was the Central Pennsylvania
included population-based survey data on women of reproductive age to examine the prevalence of multiple risk factors for adverse birth outcomes in Central Pennsylvania. Phase two of CePAWHS built on information collected from Phase one to develop a health behavioral intervention Strong Healthy Women, aiming to modify the risk factors identified in Phase o
et al. (2008) conducted a randomized control trial of this intervention to study its effectiveness. Non-pregnant women from 18-35 years old (n=692) were randomized to intervention and control groups, at a 2:1 ratio. They then received a baseline and follow-up assessment at 14 weeks to assess their health behaviors. Women who received the Strong Healthy Women intervention were much more likely to have higher self-efficacy for eating healthy foods, greater intent to stay active and take daily recommended multivitamins, and better control of birth outcomes. In addition, each additional session contributed better health behaviors that include being more aware of nutritional intake, engaging in stress
supported the effectiveness of community-based interventions on health behavior changes of women during the preconception and inter-conception period.
In this research, we hope to contribute to the existing literature in the following ways:
1.
2. Unique empirical use of the Add Health data set: The Add Health data set collects
information at four different waves. This research extracts information from these four waves and constructs variables to create a new 21-year panel structure, allowing for estimation of annual birth outcomes, independent of survey year. 3. Types of health variables: The majority of studies in the existing literature focuses
-pregnancy weight status measured by Body Mass Index (BMI). Since the Add Health data set is very rich in health information, we expand the health measures to include self-reported health status and smoker status up to three years prior to evaluation.
4. Control for endogeneity: Most existing studies on this topic are in the medical and
epidemiological literatures and not conducted by economists. Efforts to account for endogeneity and selection bias are limited. We address these issues through multiple econometrics techniques explained in Section III.
III. Empirical Analysis
A. The Health Production Function
ir subsequent health conditions, but many of the inputs include characteristics or behaviors of the biological parents. Rosenzweig and Schultz (1983) describe child health
outcomes in our case (B), as a production function, B = f (Y, Z, ), fY, fZ, f
contribute to child health (e.g., medical services and insurance).
directly through biological processes and also indirectly through parental inputs.
outcomes, we use birth weight as a measure of infant health. As in Rosenzweig and Schultz (1983), birth weight is treated as a linear indicator of good child health. We assume that there is strong positive correlation between birth weight and gestation, and hence use gestation as another health outcome of infants that may be influenced by maternal health. In addition to birth weight and gestation, we use the probability of a live birth as our third indicator of infant health outcomes. The probability of a live birth in time period t (e.g., a year), and hence all infant health outcomes, can only be considered if a woman is pregnant at t. Since not all women are pregnant each period, and pregnancy is not random, we need to account for bias caused by nonrandom selection into pregnancy. Similarly, birth weight and gestation at t can only be considered if a woman is pregnant at t and she had a live birth at t. Hence, we need to account for nonrandom selection into live births as well.
B. Data
24-32 years old and had assumed adult roles. Figure 1 shows a visual representation of the timeline of Add Health surveys. Wave IV of the study involved social, behavioral, and biomedical sciences in the design to study developmental and health trajectories of adolescents transitioning into adulthood. Contextual data on participants
and communities is also included.
Figure 1: Timeline of Add Health surveys
The Add Health dataset provides extensive information regarding a sample
s III and IV have more comprehensive pregnancy-related information such as birth weight of infants and length of gestation periods.
We then expand the dataset to encompass 21 years from year 1988 to 2008. Using retrospective information on pregnancy, we create an indicator of whether or not an individual is pregnant each year (t). For example, if a respondent indicates during the Wave
value 1 for time period year 2004. The original 4-wave panel structure is reconstructed to a new 21-year panel structure with one observation per year per person. If we are unable to construct important variables for a particular individual, we drop all 21 years of that individual. Our final estimation sample consists of 10,084 individuals observed for 21 years.
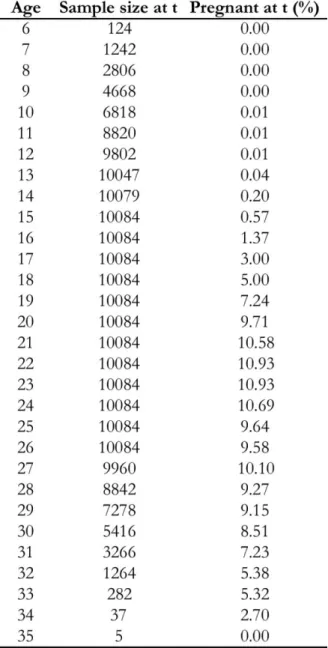
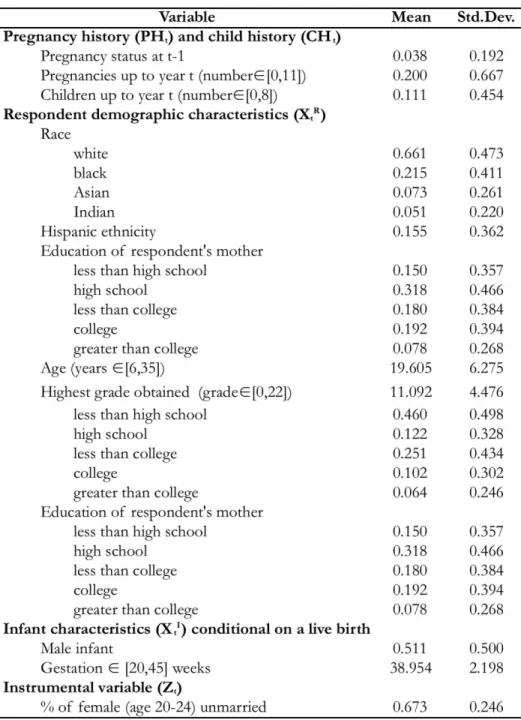
Table 1 provides summary statistics for the full sample in wave I and the estimation sample. It is evident that the two samples are similar in terms of their basic demographic characteristics. Hence, we do not expect to introduce any additional bias by using this selected subset of the full sample. Table 2 shows the frequencies and percentages of pregnant individuals by age. The percentage of pregnant individuals increases with age from age 6 to 27, and slowly declines afterwards.
Table 2: Pregnancy status by age
Dependent Variables
We use four variables as pregnancy outcomes: pregnancy status,
shows summary statistics of all four dependent variables. The annual pregnancy probability in Table 3 represents an average among a sample of respondents aged 6 to 15 in 1988 who are followed for 21 years (until age 26-35).
Table 3: Summary statistics of all dependent variables
Explanatory Variables
The primary explanatory variable of interest in this research is wome preconception health. In most published studies examining the effect of health on
is measured early in the pregnancy. That is, data on mothers health status, weight, and health behaviors are available and measured typically during the first prenatal visit. Yet, the unique structure of the Add Health survey allows us to observe health only during the survey waves (i.e.,, in 1995, 1996, 2000, and 2008). If a
t) and her health status one year (Ht-1), two years (Ht-2), and three years (Ht-3) prior to pregnancy on infant health.
variables: self-reported fair/poor health status, BMI, and smoker status. The infant health production function described above (section A) suggests that, in addition to maternal health, other purchased health-related goods (providing benefit directly to the fetus and/or to the mother/household) and parental behaviors may impact infant health. Since we do not model endogenous demand for these inputs, we substitute the determinants of this demand into the infant health production function. These variables include exogenous demographic characteristics of the woman. These demographic characteristics (XtR) include both time-variant and time-intime-variant variables of the woman (i.e., race, ethnicity, age, education, and
C. Empirical Model
We begin by specifying an equation that describes the health production function of the infant. Birth weight (BWt) is our first measure of infant health. We only observe birth weight of infants of women who became pregnant (Pt=1) and have a live birth (LBt=1). More specifically,
BWt | (Pt=1 LBt=1) = b (XtI, Gt , Ht , Ht-1 , Ht-2 , Ht-3 , PHt , CHt , XtR , t) (1)
In equation (1), we include characteristics of the infant (XtI) and the mother. We intend to measure the effect of mothers health on infant health.
A key predictor of infant birth weight is length of gestation. An infant is much more likely to be of low birth weight (BWt < 2,500 g) if the infant is born early (Gt < 37 weeks).
t). One can think of this as an additional health outcome of the infant. Specifically,
Gt | (Pt=1 LBt=1) = g (XtI , Ht , Ht-1 , Ht-2 , Ht-3 , PHt , CHt , XtR , t) (2)
Analogously, whether the pregnancy ends in a live birth or not can be considered an infant health outcome that might be impacted by mothers health. Pregnancies may terminate for other reasons as well. In our data, we have much detail about the pregnancy outcome. Conditional on a pregnancy, 14.7% of pregnancies in our sample end through an abortion and 16.5% end in miscarriage. We do not attempt to explain these outcomes separately, but define them both as not a live birth (LBt=0). Our equation explaining live birth is
Finally, we must explain selection into pregnancy in order to understand pregnancy outcomes. The linear probability of pregnancy is
Pt = p (Ht , Ht-1 , Ht-2 , Ht-3 , PHt , CHt , XtR , Z
t , t) (4)
Thus, equation (4) explains selection into pregnancy, while (1), (2), and (3) are birth outcomes conditional on having had a pregnancy. In order to address the issue of selection,
- ntal
variable (Zt), which is correlated with the probability of getting married, and hence pregnancy, but not pregnancy outcomes. The instrumental variable is obtained by extrapolating between two data points, at year 2000 and 2008 respectively, for each individual. 1
The four equations (1-4) are estimated using four different estimators: ordinary least squares (OLS), Heckman selection, random effects (RE), and fixed effects (FE). We begin with OLS to capture correlation between the explanatory variables and a linear probability of each outcome variable. We recognize that individual unobserved heterogeneity associated with selection into pregnancy (as well as live birth) and endogenous regressors will manifest itself as bias in the estimated marginal effects of variables of interest in equations (1), (2), and (3). We address selection bias by using a Heckman two-step selection model where appropriate. This procedure provides an estimate of the correlation between the outcome of interest and the selected behavior. The live birth equation (3) is only estimated on individuals who become pregnant, from equation (4). Gestation and birth weight (equations (2) and (1) respectively) are estimated only on live infants (i.e., respondent had to be pregnant and have
1 FE results show that the Zt is statistically significant at 1% for the probability of pregnancy but is insignificant
a live birth). The non-randomly selected observations used in estimation will result in selection bias, which is addressed by the Heckman selection method.
We consider the FE and RE estimators in order to address correlation between the dependent variables and endogenous explanatory variables of interest, namely health of the respondent. With the latter two estimators, we assume that something unobserved about the individual may be correlated with the explanatory variables as well as the outcome of interest. We account for this unobserved heterogeneity with a fixed individual effect. With FE, we assume that something within the individual may affect the predictor or outcome variables, which needs to be controlled for. FE discards all permanent variation between individuals and uses only variation over time within an individual. Fixed effect method results in a loss of degrees of freedom and do not allow for analysis of the role of time-invariant variables in explaining the outcome. For this reason, we use the more efficient RE estimator. RE allows us to retain time-invariant explanatory variables that are absorbed by the intercept when using fixed effect.
IV. Results and Discussion
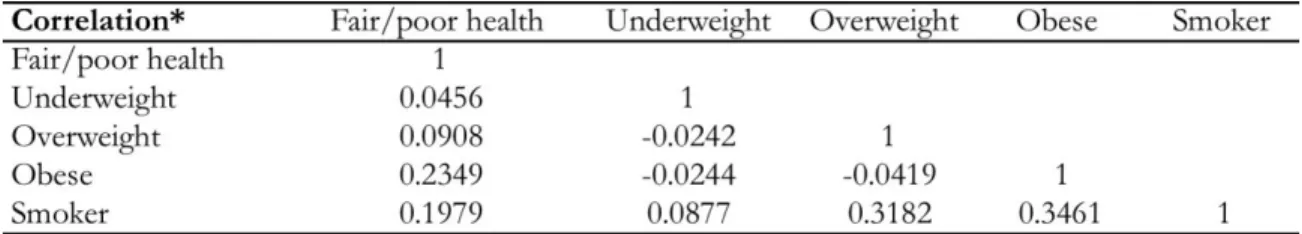
Table 5: Correlation between health measures (Ht)
Impact of health measures on probability of pregnancy at t (Pt)
a. Impact of fair/poor health on probability of pregnancy at t
Results from our preferred model for all explanatory variables are in Appendix Table A1. In Table 6a, we display the marginal effects of our primary variables of interest, the health measures, on the probability of being pregnant at t. The first three columns show the effect of each of the three health variables (i.e., indicators of fair/poor health, weight status, and smoker status) separately. The last column shows the effect of all three health variables when included as a group. We estimated all four different specifications using both OLS and FE estimators.2 It is evident that fair/poor health at time t has no impact on pregnancy probability at time t. Interestingly, fair/poor health in previous years (i.e., at time t-1, t-2, and t-3) has a positive impact on pregnancy probability at time t, shown by results of FE.
In order to examine the impact more closely, we differentiate the estimation sample by age. We divide the sample into two age groups: those who are younger than 21 and those who are older than 21. As shown in Tables 6b and 6c, the marginal effect of fair/poor health on pregnancy probability at t is reversed for the two different age groups: positive (0.042 at t-1 and 0.045 at t-3) for the older group and negative (-0.012 at t-1 and -0.030 at t-3) for the
2Due to the structure of the original survey, we create missing indicators for variables describing many
younger group. Fair/poor health seems to have a more adverse impact on pregnancy probability at t for younger women, compared to older ones. For the majority of those for whom we observe health in the preconception period, we do not have health measures for all periods (i.e., t, t-1, t-2, and t-3). Only women who were pregnant in year 1996, 1997, and 1998 have health measures for more than one period. Given the structure of the data, for most women we cannot control for health in the current period while also controlling for health in a previous period. Hence, we do not know whether an individual has changed her health over time. The positive impact of fair/poor preconception health on pregnancy probability at t for the older group might reflect behavior changes (toward better health) in preparation for pregnancy.
Table 6a: Coefficient estimates of the impact of health measures on probability of pregnancy (Pt), everyone
Table 6b: Coefficient estimates of the impact of health measures on probability of pregnancy (Pt), age less than 21
Table 6c: Coefficient estimates of the impact of health measures on probability of pregnancy (Pt), age greater than 21
b. Impact of BMI on probability of pregnancy at t
Being overweight and obese at time t and t-1 have a positive impact on pregnancy probability. Being underweight at t-1 and t-3 has a negative impact on pregnancy probability at t (Table 6a). After differentiating the estimation sample by age, we again find the impact to be reversed for the two age groups (Tables 6b and 6c). Being underweight at t-3 has a negative impact on pregnancy probability at t for the older but not younger group. Being overweight/obese at time t, t-1, and t-2 has a positive effect on pregnancy probability at t for the older group. However, this effect is negative for the younger group at t-1, but not statistically significant for other time periods. Again, the older group might have had behavior changes to increase their weight in preparation for pregnancy. However, we are not controlling
structure of the data.
c. Impact of smoking on probability of pregnancy at t
Impact of health measures on probability of a live birth at t (LBt)
a. Impact of fair/poor health on probability of a live birth at t
Individual unobserved heterogeneity associated with selection into pregnancy, as well as live birth results in selection bias in the estimated marginal effects of our variables of interest on the probability of a live birth, length of gestation and birth weight of a live birth. We use a Heckman two-step selection estimation to address the selection bias where appropriate. 3 In Tables 7a-7c, we include estimation results obtained by four different estimators (i.e., OLS, Heckman selection, FE, and RE). Heckman selection address selection bias, while FE and RE additionally address unobserved heterogeneity associated with endogenous regressors. Given that we do not have health measures at two time periods simultaneously for most of the sample, the lagged health measures are not strictly time-varying variables. Since FE discards all permanent variation between individuals, and relies on time-varying variation within an individual, FE might not be stable for our analysis. Hence, we rely on the more efficient RE estimator.
As seen in Table 7a, the results obtained using Heckman selection show that fair/poor health at time t-2 and t-3 has a statistically significant negative impact on the probability of a live birth at t. The marginal effect of fair/poor health at t-3 (-0.078) is smaller than that at t-1 (-0.093), indicating a lower impact with t being further away from the current time periods of pregnancies. Results from Heckman selection show that there is a negative impact of fair/poor health status at t on the probability of a live birth at t for the younger group. For the older group, this effect is statistically insignificant (Tables 7b and 7c).
Table 7a: Coefficient estimates of the impact of health measures on probability of live birth (LBt), everyone
Table 7b: Coefficient estimates of the impact of health measures on probability of live birth (LBt), age less than 21
Table 7c: Coefficient estimates of the impact of health measures on probability of live birth (LBt), age greater than 21
b. Impact of BMI on probability of a live birth at t
Results obtained by Heckman selection (Table 7a) show that being underweight at t has a negative impact on probability of a live birth at t. Being overweight/obese at t has a positive impact on probability of a live birth at t. Interestingly, the effect of being underweight at t-1 is positive compared to being negative at t. After correcting for bias caused by endogenous regressors using RE, the impact being underweight at t or t-1 on probability of a live birth at t is no longer significant. But being overweight/obese at both t and t-1 still positive affects probability of a live birth at t, with a diminishing effect with t being further way from the current time period of pregnancies. The marginal effects are also smaller when explanatory variables are estimated using RE compared to using Heckman selection, indicating a less significant impact after correcting for unobserved heterogeneity. Comparing the two different age groups in Tables 7b and 7c, results obtained using RE show that being overweight/obese at t, t-1, and t-3 has a positive impact on probability of a live birth at t for younger group. However, this positive impact is only statistically significant at t-1 for the older group.
c. Impact of smoking on probability of a live birth at t
Smoking at t, t-1, and t-2 has a negative impact on probability of a live birth at t, shown by the Heckman selection results (Table 5a). After correcting for bias caused by endogenous regressors through RE, the negative marginal effects are no longer statistically significant for smoking at t-2 but still are for smoking at t and t-1. Comparing the impact of smoking on the two different age groups using results of RE (Tables 7b and 7c), there is a negative impact of smoking at t on probability of a live birth at t for the younger group. For the older group, there is a negative impact of smoking at t-1 on the probability of a live birth at t.
Impact of health measures on the length of gestation period at t (Gt) a. Impact of fair/poor health on length of gestation at t
Table 8a: Coefficient estimates of the impact of health measures on length of gestation (Gt), everyone
Table 8b: Coefficient estimates of the impact of health measures on length of gestation (Gt), age less than 21
Table 8c: Coefficient estimates of the impact of health measures on length of gestation (Gt), age greater than 21
b. Impact of BMI on length of gestation at t
In Table 8a, Heckman selection results indicate that being overweight at t, t-3 and being obese at t-3 has a positive impact on length of gestation at t. Being underweight at t-1 has a negative impact on length of gestation at t. RE results show that the positive effect of being overweight at time t and t-3 remain significant but with a smaller magnitude. The negative effect of being underweight at t-1 on the other hand, became insignificant. Comparing the two different age groups (Tables 8b and 8c), the general impact of BMI on length of gestation remains largely consistent with the entire estimation sample, where being underweight preconception impacts length of gestation at t negatively and being overweight/obese preconception impacts length of gestation at t positively. However, they differ in terms of the specific time periods when the impact is significant. For example, the positive effect of being overweight at t-3 is significant for the older group but not the younger group.
c. Impact of smoking on length of gestation at t
Impact of health measures on birth weight of a live birth (BWt)
a. Impact of fair/poor health on birth weight of a live birth at t
Results from both Heckman selection and RE in Table 9a show statistically insignificant impacts of fair/poor health at any time period on birth weight of a live birth at t. When comparing the two different age groups, regression results remain statistically insignificant (Tables 9b and 9c). Hence, self-reported fair/poor health at time period t to t-3 has negligible impact on birth weight of a live birth according to our analysis.
b. Impact of BMI on birth weight of a live birth at t
In Table 9a, results from Heckman selection, FE, and RE all show that being obese at t has a positive impact on birth weight of a live birth at t. This positive impact remained statistically significant for both the younger and older group (Tables 7b and 7c). However, the magnitude of impact for the older group is much smaller compared to the younger group.
c. Impact of smoking on birth weight of a live birth at t
Table 9a: Coefficient estimates of the impact of health measures on birth weight of a live birth (BWt), everyone
Table 9b: Coefficient estimates of the impact of health measures on birth weight of a live birth (BWt), age less than 21
Table 9c: Coefficient estimates of the impact of health measures on birth weight of a live birth (BWt), age greater than 21
Robustness
Given the structure of the constructed data set, we only have health information in particular years. Specifically, we have health information at time t (Ht) in years 1995, 1996, 2000, 2008; health at time t-1 (Ht-1) in years 1996, 1997, 2001; health at time t-2 (Ht-2) in years 1997, 1998, 2002, and health at time t-3 (Ht-3) in years 1998, 1999, 2003. We create missing indicators for health in years when it is not observed. While this structure does not create perfect collinearity, we are concerned about collinearity issues that potentially rise from these missing indicators. To ensure that our results are not affected by collinearity issues, we evaluate the effect of current period respondent health (Ht) on infant health outcomes using only the years when health is reported in the original four waves of the survey. That is, only years 1995, 1996, 2000, and 2008 are included in estimation. Similarly, to evaluate the effect of respondent health one year prior to the year of interest, we use years 1996, 1997, and 2001. We proceed analogously to estimate the effects of respondent health two and three years prior to the year of interest. We provide coefficient estimates (by OLS) in Table 10. We find that these coefficient estimates are similar to those we obtained from our estimation on the entire sample (Tables 6a, 7a, 8a, and 9a).
Table 10: Coefficient estimates of the impact of health measures on pregnancy outcomes in the years with information recorded in surveys (OLS)
Table 11: Coefficient estimates of the impact of health measures on pregnancy outcomes with health defined for everyone at all years (OLS)
Note: * significant at 10 level; ** significant at 5% level; * significant at 1% level
Summary of Results
Table 12 provides a summary of key results discussed in this section. The four columns show the impacts of health measures of interest (i.e., fair/poor health status, BMI, and smoker status) at the current period and preconception on four different pregnancy outcomes (i.e., probability of pregnancy, probability of a live birth, length of gestation, and birth weight of a live birth, all at time gn indicates a statistically significant negative relationship. 4
Self-reported fair/poor health at t-1, t-2, and t-3 has a positive impact on pregnancy probability at t for the entire estimation sample. For the older group, the impact remains positive when women self-report fair/poor health at t-1 and t-3. In contrast, the impact of fair/poor health at t-1 and t-3 on pregnancy probability at t for the younger group is negative. However, fair/poor health, at both current time period and preconception, has no impact on length of gestation and
health status due to the data structure, it is possible that older respondents adjust their health behavior in preparation of pregnancy, leading to a positive marginal effect of fair/poor health on pregnancy probability at t.
Being underweight has a generally negative impact on pregnancy outcomes while being overweight/obese has a positive impact. This result seems to suggest that higher body mass can serve as a protective mechanism that leads to more desirable birth outcomes. For future research, it would be interesting to have an indicator for low birth weight in addition to the continuous variable. Birth weight is one of the most immediate infant health measures. The long-run implication of the mother being overweight/obese needs further research.
Smoking at current and preconception period has a positive impact on pregnancy probability at t. Smoking at preconception periods also has a positive impact on length of gestation at t. However, the impact of smoking at current and preconception period is negative on the probability of live birth at t and birth weight of an infant at t. There is a more sustained impact of smoking on pregnancy outcomes for the older group compared to the younger group. That is, the impact of smoking on pregnancy outcomes is significant at t further away from the current period of pregnancies. In our sample of individuals who were pregnant, people with income and low-educational level are overrepresented since they are likely to have more pregnancies. It would be interesting to differentiate between intended and unintended pregnancies. We can also look at
Table 12: Summary of key results
V. Conclusion
-reported fair/poor health status, BMI, and smoker status) on infant birth outcomes (measured by probability of pregnancy, probability of live birth, length of gestation, and birth weight at time t). By constructing a 21-year panel data set with annual information from the original 4-wave panel
structure of the Add Health data set, we are able to estimate the impac
pregnancy outcomes at current time period, one year prior, two years prior, and three years prior to pregnancy.
Overall, self-reported fair/poor health at t-1 and t-3 has a positive impact on the pregnancy probability for older group of women (age greater than 21) in our estimation sample and a negative impact for the younger group (age less than 21). This counter-intuitive finding might suggest
possible behavior changes in preparation of pregnancy. That is, those who observe poor health may wait one or more years to become pregnant in order to restore their health. Our data set does not allow us to control for health at time period t while also examining the effect of health at time period t-1. It does have a positive impact on probability of pregnancy, which we interpret as additional correlation bias reflecting a positive propensity to engage in unhealthy behaviors. We did not observe any significant impact of self-reported fair/poor health on length of gestation and birth weight of infants.
impact on pregnancy outcomes. A data set with annual survey responses can be utilized in future research to a
VI. Appendix
Table A1: Coefficient estimates of the impact of other exogenous variables on pregnancy outcomes, everyone
Bibliography
Adler NE, Newman K. Socioeconomic disparities in health: pathways and policies. Health Affairs. (2002). 21: 60 -76.
-pregnancy and pregnancy-related factors and the risk of excessive or
. (2005). 91(2): 125-131
Carolina Population Center. Add Health. Available at: http://www.cpc.unc.edu/projects/addhealth CDC. Alcohol consumption among women who are pregnant or who might become pregnant---United States. MMWR 2004. (2002). 53: 1178-81
Centers for Disease Control and Prevention. Recommendations to improve preconception health and health care United States: A report of the CDC/ATSDR Preconception Care Work Group and the Select Panel on Preconception Care. MMWR, 55(No. RR-6), inclusive page numbers. (2006).
Denny C. H. et al., Racial and ethnic disparities in preconception risk factors and preconception . (2012). 21(2): 720-729
Finer, L.B., & Zolna, M.R. Unintended pregnancy in the United States: incidence and disparities, 2006. Contraception. (2011). 84(5): 478-485.
Gilbert, W. M., Nesbitt, T. S., & Danielsen, B. The cost of pre- maturity: quantification by gestational age and birth weight. Obstetrics and Gynecology. (2003). 102: 488 492.
Haas JS, Meneses V, McCormick MC. Outcomes and health status of socially disadvantaged women -Based Medicine. (1999). 8:547--53.
Haas, J. S., Fuentes-Afflick, E., Stewart, A. L., Jackson, R. A., Dean, M. L., Brawarsky, P., et al. Prepregnancy health status and the risk of preterm delivery. Archives of Pediatric Adolescent Medicine. (2005). 159: 58 63.
Hamilton, B. E., Martin, J. A., & Ventura, S. J. Births: Prelim- inary data for 2006. National Vital Statistics Reports. (2007). 56: 1 18.
- .
(2010). 24(6): 565-571
trial of the Strong Healthy Women Intervention in the Central Pennsylvan (2008). 18:87-96.
Kogan et al. The changing pattern of prenatal care utilization in the United States, 1981-1995, using different prenatal care indices. JAMA. (1998). 279(20): 1623-1628
Korenbrot CC, Steinberg A, Bender C, Newberry S. Preconception care: a systematic review. Maternal Child Health Journal. (2002). 6:75-88.
Kotelchuck, M. Building on a life-course perspective in maternal and child health. Maternal and Child Health Journal. (2003). 7:5 11.
-pregnancy weight and the
Gynaecology. (2005). 112: 403 408.
Lu, M. C., & Halfon, N. Racial and ethnic disparities in birth outcomes: A life-course perspective. Maternal and Child Health Journal. (2003). 7:13 30.
Martin, J. A., Hamilton, B. E., Sutton, P. D., Ventura, S. J., Menacker, F., Kirmeyer, S., et al. Births: Final data for 2006. National Vital Statistics Reports, 57. Hyattsville, MD: National Center for Health Statistics. (2009).
Mathews, T. J., & MacDorman, M. F. Infant mortality statistics from the 2006 period linked birth/infant death data set. National Vital Statistics Reports, 58. Hyattsville, MD: National Center for Health Statistics. (2010).
Misra, D. P., Guyer, B., & Allston A. Integrated perinatal health framework: A multiple
determinants model with a life span approach. American Journal of Preventive Medicine. (2003). 25: 65 75.
Moos MK, Cefalo RC. Preconcpetional health promotion: a focus for obstetric care. American Jounral of American Journal of Perinatology. (1987). 4:63 -7
Moos MK. Preconceptional health promotion: opportunities abound. Matern Child Health Journal. (2002). 6:71-3.
Moos MK. Preconceptional wellness as a routine objective for women's health care: an integrative strategy. Journal of Obstetric, Gynecologic, & Neonatal Nursing. (2003). 32:550-6
Moos MK. Preconceptional health promotion: progress in changing a prevention paradigm. Journal of Obstetric, Gynecologic, & Neonatal Nursing. (2004). 18: 2-13.
Petrou, S. Economic consequences of preterm birth and low birthweight. British Journal of Obstetrics and Gynecology: (2003). 110 (Suppl 20), 17 23.
RAND. Preventing very low birthweight births: a bundle of savings. Research highlights. Santa Monica, CA: RAND. (1998).
Salganicoff A, Ranji U, Wyn R. Women and health care: a national profile---key findings from the Kaiser Women's Health Survey. Menlo Park, CA: Kaiser Family Foundation. (2005).
Rosenzweig, Mark R. & Schultz, T. Paul. Estimating a household production function:
heterogeneity, the demand for health inputs, and their effects on birth weight. Journal of Political Economy. (1983). 91(5): 723-746
US Department of Health and Human Services. Caring for our future: the content of prenatal care: a report of the Public Health Service Expert Panel on the Content of Prenatal Care. Washington, DC: US Department of Health and Human Services, Public Health Service. (1989).
US Department of Health and Human Services. Women's health USA. Rockville, MD: US