IN-SITU NMR STUDY OF MOLECULAR AND IONIC PROCESSES INSIDE CARBON NANOPORES
Zhixiang Luo
A dissertation submitted to the faculty of the University of North Carolina at Chapel Hill in partial fulfillment of the requirements for the degree of Doctor of Philosophy in the Department
of Physics and Astronomy.
Chapel Hill 2015
Approved by:
Yue Wu
Laurie E. McNeil
Sean Washburn
Rosa T. Branca
Charles R. Evans
Keith E. Gubbins
ii
iii
ABSTRACT
Zhixiang Luo: In-situ NMR Study of Molecular and Ionic Processes inside Carbon Nanopores (Under the direction of Yue Wu)
Interactions of simple ions with water and interfaces play critical roles in many
electrochemical and biological processes. They are especially significant in nanoconfined
regions and have a profound impact in many applications, for instance nanofluidics and
supercapacitors. This dissertation employs a nuclear magnetic resonance (NMR) technique to
study their influence on the ionic processes inside carbon nanopores. To characterize the carbon
micropore structure, a convenient NMR method is established by taking a 1H magic angle
spinning (MAS) spectrum of the adsorbed water. A density functional theory (DFT) computation
of the nucleus-independent chemical shift (NICS) yields a quantitative relationship between the
NICS values and the micropore sizes. The carbon micropore size and distribution are derived
from the chemical shift and the spectrum lineshape. For aqueous electrolytes inside uncharged
carbon nanopores, the measurement of ion concentrations reveals a substantial electroneutrality
breakdown. The specific ion effects and ion-ion correlations are shown to play crucial roles in
determining the degree of electroneutrality breakdown. The importance of those interactions is
further revealed by the asymmetric and nonlinear responses of ion concentrations to the charging
of the confining carbon walls. Such information is obtained with a carbon supercapacitor built
into the NMR probe. The NMR observations are validated by a numerical calculation of the ion
distribution in the nanopores using the generalized Poisson-Boltzmann (PB) equation,
demonstrating that the nonelectrostatic interfacial interactions can indeed dominate the
iv
regions. Interfacial ion hydration is an essential part of the specific ion effects. Using in-situ23Na
and 19F NMR on carbon supercapacitors with different carbon pore sizes, I provide a
v
To my beloved grandparents
vi
ACKNOWLEDGEMENTS
First and foremost, I would like to express my deepest appreciation to my advisor, Prof.
Yue Wu, for his guidance, help and encouragement throughout my PhD study. I have learned so
much as a result of his philosophy and action of teaching students in accordance with their
aptitude during the past five years, from research details such as the experiment design, data
analysis and presentations, to qualities critical for a successful scientist such as curiosity,
patience and creativity. His influence on me was far beyond the scientific research.
I am also grateful to Dr. Alfred Kleinhammes who guided me into the magic kingdom of
NMR. His training and help made it much easier for me to handle new NMR techniques and to
design and modify NMR probes, especially at the beginning of this project.
I would like to thank Prof. Warren Warren in Duke University who allowed me to audit
his NMR class in 2013 spring. He showed me the beauty of NMR with broad knowledge and
clear explanations. The theories and techniques I learned from his class were extremely helpful
for my research.
I would like to express my special gratitude to Dr. Yi-Qiao Song and Dr. Jeffrey Paulsen
during the internship at Schlumberger Doll research center. They introduced me to the exciting
applications of NMR in the oil industry. The numerical calculation would not have been possible
without the Matlab programming skills I gained during the internship.
I am grateful to my committee members, Profs. Yue Wu, Laurie E. McNeil, Sean
Washburn, Warren Warren, Keith Gubbins, Charles Evans, and Rosa T. Branca for their advice
vii
I have had a lot of help from the previous and current members of Wu’s Group. These
members are: Gregory Mogilevsky, Haijing Wang, B. J. Anderson, Magdalena Sandor, Courtney
Hadsell, Jacob Forstater, Shaun Gidcumb, Yunzhao Xing, Yanchun Ling, Yuan Chong, Patrick
Doyle and Yan Song. In particular, the discussions with Yunzhao Xing were very insightful and
fruitful. He also helped me with the DFT calculation.
Last but not least, I want to take this opportunity to thank my family. I couldn’t have
achieved this without their selfless support, financially and spiritually. My girlfriend Lan from
NC State University shares all my happiness and sorrows since 2012. She is always with me
during my low times, no matter it being research difficulty or family loss. Her acceptance is the
best cure that cheers me up. My grandparents and parents have sacrificed a lot to raise me and
viii
TABLE OF CONTENTS
LIST OF TABLES ··· xi
LIST OF FIGURES ··· xii
LIST OF ABBREVIATIONS ··· xvi
CHAPTER 1 INTRODUCTION ··· 1
1.1 Motivation ··· 1
1.1.1 Specific Ion Effects and the Hofmeister Series ··· 1
1.1.2 Nanoconfined Electrolytes ··· 4
1.1.3 NMR Approach for Nanoconfined Electrolytes and Specific Ion Effects ··· 6
1.1.4 Dissertation Outline ··· 8
1.2 NMR Principles ··· 9
1.2.1 Magnetization ··· 9
1.2.2 Relaxation ··· 11
1.2.3 Chemical Shift ··· 12
1.3 References ··· 14
CHAPTER 2 PROBING CARBON MICROPORES BY NUCLEUS INDEPENDENT CHEMICAL SHIFT ··· 21
2.1 Introduction ··· 21
2.2 Experimental Details and DFT Calculation ··· 23
2.2.1 Sample Preparation ··· 23
2.2.2 NMR Experiment ··· 24
2.2.3 DFT Calculation Approach ··· 25
2.2.4 Chemical Shift Mechanism in AC Micropores ··· 26
2.2.5 DFT Calculation of NICS ··· 27
ix
2.2.7 Correlation between the Pore Size and the Chemical Shift ··· 30
2.2.8 Micropore Volume ··· 33
2.2.9 Peak Broadening and PSD ··· 35
2.3 Conclusions ··· 41
2.4 References ··· 42
CHAPTER 3 ELECTRONEUTRALITY BREAKDOWN AND SPECIFIC ION EFFECTS IN NANOCONFINED AQUEOUS ELECTROLYTES ··· 44
3.1 Materials and Methods ··· 44
3.1.1 Nanoconfined Electrolytes Preparation ··· 44
3.1.2 Static NMR on Uncharged P-40 ··· 45
3.1.3 In-situ NMR on P-40 Supercapacitor ··· 46
3.2 Results and Discussions ··· 48
3.2.1 Electroneutrality Breakdown in Nanoconfinement ··· 48
3.2.2 Specific Ion Effects on Ion Concentrations ··· 50
3.2.3 Ion Distribution Theory ··· 53
3.2.4 Ion Concentrations in Charged Nanopores ··· 55
3.3 Conclusions ··· 58
3.4 References ··· 59
CHAPTER 4 NUMERICAL CALCULATION OF ION DISTRIBUTION IN SLIT NANOPORE ··· 61
4.1 Introduction ··· 61
4.2 Theoretical Development ··· 62
4.2.1 Nanopore Model ··· 62
4.2.2 Generalized PB Equation ··· 63
4.2.3 Ion-Surface Interactions ··· 65
4.2.4 Boundary Conditions ··· 66
4.3 Results ··· 69
4.3.1 Ion Distribution in 1 nm Slit-Shaped Pores ··· 69
4.3.2 Electrostatic and Nonelectrostatic Potential Energies ··· 71
4.3.3 Effect of the Boundary Conditions··· 72
x
4.3.5 Specific Ion Effects on Electroneutrality Breakdown ··· 75
4.4 Discussions ··· 76
4.5 References ··· 79
CHAPTER 5 DEHYDRATION OF IONS IN VOLTAGE-GATED CARBON NANOPORES ··· 82
5.1 Experimental Details and Results ··· 82
5.1.1 NaF electrolytes in P-0 and P-92 ··· 82
5.1.2 F– Permeation and Dehydration in P-0 Supercapacitor ··· 84
5.1.3 Na+ in P-0 Supercapacitor ··· 87
5.1.4 In-situ Charging on P-92 supercapacitor ··· 88
5.2 Discussions ··· 91
5.3 References ··· 92
xi
LIST OF TABLES
Table 1.1: Nucleus gyromagnetic ratio and natural abundance [142] ... 10
Table 2.1: The MAS NMR characterization of AC samples with different BO values. The chemical shift of peak B is referred to water 1H outside the nanopores. d
is the carbon pore size from carbon center to carbon center assuming a slit-shaped pore. d*= d-0.34 nm is the effective pore size from carbon surface to carbon
surface. ... 35
xii
LIST OF FIGURES
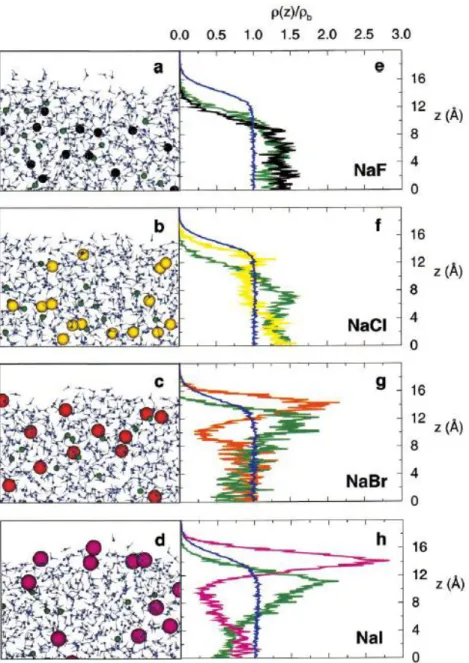
Figure 1.1: The specific ion effects on the ion distribution near the solution/air interface. (a-d): Snapshots of the molecular dynamics simulations. The coloring scheme is: water oxygen, blue; water hydrogen, gray; sodium ions, green; chloride ions, yellow; bromide ions, orange; iodide ions, magenta. (e-h): Densities (normalized by the bulk density) of water oxygen atoms and ions plotted vs. the z-distance in the direction normal to the interface. The colors of the curves
correspond to the colors of the atoms in the snapshots. [25] ... 2
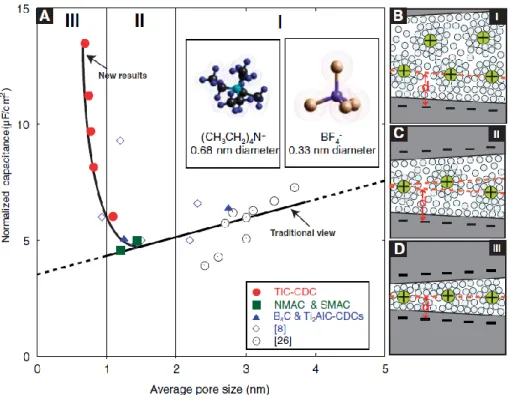
Figure 1.2: The dependence of specific capacitance on the pore size of carbon materials. The capacitance increases sharply when the pore size is less than 1 nm. A quantitative explanation cannot be achieved without looking at the ion distributions
which are strongly affected by the specific ion effects in nanoconfinement. [99] ... 5
Figure 1.3: Illustration of an electrochemical system consisting of nanoconfined electrolytes in equilibrium with a bulk phase. The PEEK-derived activated carbon provides the confinement and its surface charge can be tuned by applying voltage. Electrolyte properties such as the ion distribution are important for many
applications but are very challenging for experimental investigations. ... 7
Figure 2.1: TEM image of a carbon sample with BO = 92% activated at 900°C. ... 24
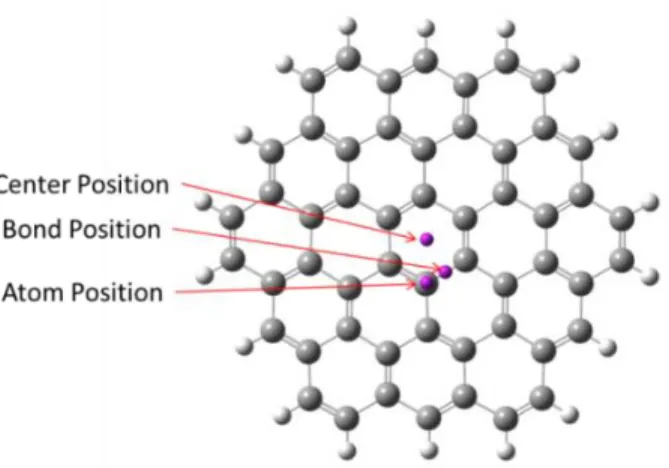
Figure 2.2: The molecular structure of circumcoronene and the three locations of
the ghost atom (purple dots). ... 25
Figure 2.3: Static 1H, 19F, 23Na spectra of a P-40 AC sample filled with 1 M NaBF4
solution. The left peak (peak A) is set as the reference (0 ppm) and the right peaks (peak B) of all three nuclei exhibit the same chemical shift of -7.7 ppm due to the
NICS effect. ... 27
Figure 2.4: (a) The dependence of the NICS on the distance from the molecule to the surface obtained by a DFT calculation. Three probe atom locations are used: over the ring center, over the carbon atom, and over the bond center of the central carbon ring of circumcoronene. The solid line is an empirical fit of the numerical
r with
r Aexp
r r/ 0
. The inset shows the difference between theDFT calculation and the fit. (b) The relationship between the pore size d (atom center to center for a slit-shaped pore) and the averaged NICS avg deduced from Eq. (2.2). The solid line is an empirical fit of the numerical result with Eq. (2.3).
xiii
Figure 2.5: Illustration of water molecules inside a slit-shaped pore of width d
(carbon center to carbon center). w is the closest distance that water molecules can
approach the surface. ... 29
Figure 2.6: (a) 1H MAS spectra of water in a P-0 AC sample with different water filling methods: Adsorption in saturated water vapor pressure (black), vapor adsorption followed by liquid water injection (red); liquid water injection by a syringe (blue). The inset shows the overlay of the three spectra. The identical peak B indicates that the micropores are fully filled by each method. (b) 1H MAS spectra of water in a P-92 AC sample at different water filling level with water/carbon mass ratio ranging from 0.38 to 1.83. The chemical shift of peak B at low filling level (0.38) differs by 0.7 ppm from that of fully filled micropores (mass ratio 1.42 and above). There are some sharp peaks in peak A, which are probably due to water in
mesopores or intergranular space that are resolved under MAS. ... 32
Figure 2.7: 1H MAS spectra of water-filled AC samples. BO values are indicated in
the figure. ... 33
Figure 2.8: Nitrogen gas adsorption isotherms of 0% BO and 92% BO AC samples.
P/P0 in the x-axis is the relative pressure of nitrogen gas at 77K. ... 35
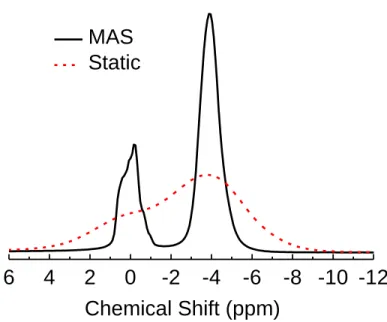
Figure 2.9: The 1H spectra of water in a P-92 AC sample. The static spectrum (dashed line, red) has a FWHM of 4.6 ppm and the MAS spectrum (solid, black)
has a FWHM of 1.3 ppm... 36
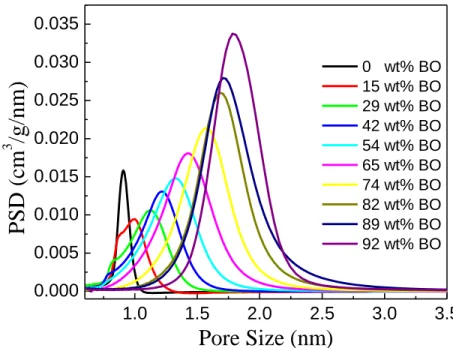
Figure 2.10: The PSDs obtained from the 1H MAS NMR spectra. As the BO value increases, the average pore size and the PSD increases. For the 15 BO and 29 BO samples, the pore size is not very uniform because the activation extent is not the
same for the interior and the edge of an PEEK particle. ... 37
Figure 2.11: A TEM image of a 0% BO sample carbonized at 1100 oC. Graphitic
crystalline domains can be clearly observed. ... 38
Figure 2.12: 1H, 19F MAS spectra of a P-32 AC sample filled with 1M NaBF4
solution. ... 39
Figure 2.13: The 1H spectra of water in P-89 (dash-dotted line) and P-94 (solid line)
AC samples. The intensity (spectral area) is scaled by the water/AC mass ratio. ... 40
Figure 3.1: The deconvolution of 23Na spectrum to obtain the intensities of ions
xiv
Figure 3.2: An illustration of the modified supercapacitor built into the NMR probe for controlling the P-40 surface charging. The device consists of two P-40 electrodes immersed in the electrolyte and separated by a glass fiber. One electrode is covered by a copper foil to enable a single-electrode NMR measurement which is
carried out in-situ when voltage is applied between the two electrodes. ... 47
Figure 3.3: Plots of charging voltage vs. time and current vs. time. The voltage is increased by 0.1 V every 4 hours. A current spike is observed immediately after the voltage increase because of the capacitive charging. The charging process usually takes about 2 h because the device is not optimized for fast charging (no binder or carbon black is added to increase the conductivity and the electrode is very long). The electric current is not zero after 2 h probably due to the leaking current or some slow processes in the nanopores. Such slow processes are usually not useful for supercapacitors that undergo fast charging or discharging. So the spectrum taken
after 3.5 h charging is used for analysis. ... 47
Figure 4.1: The 1D slit-shaped nanopore model. The electrodes are treated as two large perfect conductors. The pore center is located at x=0. The inner surface of the plate is located at x1 and the outer surface is located at x2. a is the ion radius which
defines the closest distance from ion center to the surface. The blue curve is an
illustrative electric potential distribution. ... 63
Figure 4.2: Ion distribution in the 1 nm pore for parameters B+ =46 10 50J m3, B– =
50
58 10
J m3. The inset includes the ion distributions both inside and outside the nanopore. The vertical solid lines are the infinitely thin conducting plates and the vertical dashed lines are the Helmholtz planes. There is no ion distribution between the Helmholtz plane and the conducting plate because the ion has a finite size and
can’t get to the surface too close. ... 70
Figure 4.3: Comparing the distribution of ion-surface potentialsV x( ), V x( ) and the
electrostatic potential. The negative half space is not shown since the pore is symmetric. The magnitude of V x( ) and V x( ) is plotted for the convenience of
comparison. The actual V x( ) and V x( )are shown in the inset. ... 72
Figure 4.4: Comparing the PB equation solutions obtained using the joint model (solid line) and the conventional model that assumes a zero surface charge (dashed line). The solid vertical lines are the conducting plates and the dotted vertical lines
xv
Figure 4.5: Comparing ion distributions inside the nanopore from the joint model (solid lines) and the conventional model (dotted line) that assumes a zero surface
change. ... 74
Figure 4.6: Average ion concentration in nanopores versus the pore size. ... 75
Figure 4.7: The average ion concentration in nanopores versus the parameter B–.
The parameter B+ =46 10 50 J m3 is fixed. ... 76
Figure 5.1: The static NMR spectra of NaF aqueous electrolyte in P-0 powders. Na+ and F– are excluded from the nanopores, so there is only one peak on the 23Na and
19
F spectra. There are two peaks on the 1H spectrum. The water in P-0 nanopores
has a NICS value about -10 ppm. ... 83
Figure 5.2: The static NMR spectra of NaF aqueous electrolyte in the P-92 sample. The 1.55 nm pores are accessible to the ions so each spectrum has two peaks. The chemical shift for the nanoconfined Na+ and F– (-3.3 ppm) differs slightly from that for water (-4 ppm) because the hydrated ions cannot approach the surface as closely
as water. ... 84
Figure 5.3: The 19F spectra from the positive electrode of the P-0 supercapacitor. The peak around 0 ppm represents F– in the separator and intergranular spaces. The peak corresponding to the intergranular ions moves slightly to the left (downfield,
about 0.5 ppm at 1 V) due to the change in the bulk susceptibility. ... 85
Figure 5.4: The 19F chemical shift and intensity during positive charging. Three stages of the ion permeation are identified based on the chemical shift (blue marker) and the intensity (red marker) of F– in the nanopores. The direction of the voltage
change is indicated by the black arrow next to the curve. ... 86
Figure 5.5: The 19F spectra evolution on the positive electrode as the charging
voltage increases. ... 89
Figure 5.6: The 1H spectra evolution on the positive electrode as the charging
voltage increases. The center of the right peak changes linearly with voltage. ... 89
Figure 5.7: The 19F and 1H chemical shift versus the charging voltage. The green line, which shows the contribution from the dehydration, is obtained by subtracting
xvi
LIST OF ABBREVIATIONS
AC Activated Carbon
BET Brunauer-Emmett-Teller
BO Burn-Off
DFT Density Functional Theory
EDL Electric Double Layer
EDLC Electric Double Layer Capacitor
FWHM Full-Width at Half-Maximum
GIAO Gauge-Independent Atomic Orbital
MAS Magic Angle Spinning
NICS Nucleus-Independent Chemical Shift
NMR Nuclear Magnetic Resonance
PEEK Poly (Ether Ether Ketone)
PB Poisson-Boltzmann
PSD Pore Size Distribution
RTIL Room Temperature Ionic Liquid
SAM Self-Assembled Monolayer SEM Scanning Electron Microscope
SHG Second Harmonic Generation Spectroscopy
SSA Specific Surface Area
TEM Transmission Electron Microscope
TMS Tetramethylsilane
1
CHAPTER 1 INTRODUCTION 1.1 Motivation
1.1.1 Specific Ion Effects and the Hofmeister Series
Ions are hydrated in aqueous electrolytes; the hydration structure and dynamics can be
quite complex with interactions such as the dispersion forces and the hydrogen bonding playing
important roles [1-13]. The properties of ion hydration vary significantly from ion to ion, even
amongst ions with the same electrovalency (e.g. F– and I–), thus they are ion-specific in contrast
to the Coulomb interactions. When the ions in solutions are presented with an interface,
unexpected phenomena can emerge because of the interplay between the ion, the solvent water
and the surface via Coulombic and ion-specific nonelectrostatic interactions. Strongly hydrated
ions such as F– and Na+ may prefer the bulk aqueous environment instead of the interface
between water and a hydrophobic surface; in contrast, weakly hydrated ions may prefer the
interface [14-18], as demonstrated in Figure 1.1.
Ions vary in their effects on other fundamental properties of ionic solutions. Such specific
ion effects have both fascinated and challenged the scientific community over more than a
century, dating back to the report by Franz Hofmeister about ionic properties, arranged in series,
with respect to their relative influence on the precipitation of egg white proteins from aqueous
solutions [19-22]. This series, named the Hofmeister series, was found later to apply to a whole
range of phenomena including viscosity, surface tension, freezing point depression and water
activity coefficient etc. [17,18,23,24], with only minor changes of the order depending on the
2
Figure 1.1: The specific ion effects on the ion distribution near the solution/air interface. (a-d): Snapshots of the molecular dynamics simulations. The coloring scheme is: water oxygen, blue; water hydrogen, gray; sodium ions, green; chloride ions, yellow; bromide ions, orange; iodide ions, magenta. (e-h): Densities (normalized by the bulk density) of water oxygen atoms and ions plotted vs. the z-distance in the direction normal to the interface. The colors of the curves
3
Below is the generally accepted ranking for anions although minor differences exist in
different studies [17,18]:
CO32– SO42– S2O32– H2PO4– F– Cl– Br– NO3– I– ClO4– SCN–
The anions to the left side of Cl– are called kosmotropes (structure-makers), which promote the
salting-out of proteins, increase the surface tension of aqueous solution, and induce a wide range
of other effects. In contrast, the anions to the right side of Cl– are called chaotropes
(structure-breakers), which promote the salting-in of proteins, decrease the surface tension of aqueous
solution, and also induce a wide range of other effects. The ranking for cations is much less
systematic and is based on the salting-out efficiency. Some cations of interests are ranked below
[18,26]:
Li+ Na+ K+ Al3+ NH4+ H+
Although the Hofmeister series is a fundamental framework to study many kinds of
biochemical systems involving salty solutions, the underlying mechanism of its general
applicability remained unclear for a long time. In the last two decades, the Hofmeister effect has
received unprecedented attention. A large amount of experimental and theoretical work was done
to study the specific ion effects at the interface [14-16,27-50], leading to exciting discoveries
such as the surface enhancement of halides [14-16,29,35,51-54] and insights into the Hofmeister
series which reflects the systematic variations in the specific ion effects
[17,18,20,24,26,46,55-59]. Experiments indicate that the ion has negligible effects on the water structure beyond the
first hydration shell [60], disproving the long-held speculation that the Hofmeister effect is due
to the relative ability of ions to change the water structure network (water structure
maker/breaker). Instead, the direct ion interactions with the surface play an important and
4
Another important area, less explored by experiments, is the consequences of the specific
ion effects in the nanoconfined space. Although the theoretical investigations of nanoconfined
electrolytes are extremely active [66-71], experimental reports remain scarce [72-81]. The
prevalent surface-selective techniques for the study of the specific ion effects, such as the
vibrational sum frequency generation spectroscopy (VSFG), the second harmonic generation
spectroscopy (SHG) and the X-ray photoelectron spectroscopy, are not applicable for
nanoconfined electrolytes.
1.1.2 Nanoconfined Electrolytes
Nanoconfined fluids, especially nanoconfined water, are ubiquitous in nature and often
exhibit intriguing properties [72,82-86]. An important special subject of nanoconfined fluids is
that of ionic solutions. In particular, aqueous ionic solution is a subject of vital importance but
also a subject with major open questions [3-5,7-10,12,60,87-91]. Nanoconfined fluids are
relevant to many scientific disciplines ranging from the energy storage in supercapacitors and
fuel cells [92-112], to water desalination [113-115], to proteins and ion channels [116,117], and
to nanofluidics [118-120].
How ions distribute and migrate inside the nanoconfined space is one of the central and
basic scientific questions in nanoconfined electrolytes. In the nanoconfined environment, the
influence of the solvent-mediated interfacial effects is amplified due to the relatively small
fraction of the bulk phase. As such, unusual phenomena could emerge in nanoconfined ionic
solutions, with different ions of the same valence exhibiting very different properties [121,122].
The complexity and subtlety of the ionic processes in the nanoconfinement are reflected by the
fact that despite the Nobel Prize winning work on the structure of K+ ion channel over a decade
5
The importance of nanoconfined fluids is also exemplified in technological applications
such as carbon supercapacitors. A major puzzle in the last decade is the anomalous capacitance
increase in pores less than 1 nm [99], shown in Figure 1.2. An explanation could not be achieved
without looking at the ion distribution inside the nanopores. However, theoretical and
experimental developments in this area are far from sufficient. Supercapacitors store energy in
the electric double layer (EDL) formed at the interface between the solid electrode and the liquid
electrolyte. But the EDL theory based only on electrostatic considerations, such as the
Gouy-Chapman theory, is not applicable in the scenarios of high electrolyte concentration and high
electrode voltage.
6
The Gouy-Chapman theory solves the PB equation with simplified assumptions where
ions are treated as point charges interacting with their mean field and the solvent is treated as a
structureless continuum. The molecular-scale structures, nonelectrostatic ion-surface interactions
and ion-ion correlations are ignored. The Gouy-Chapman theory predicts a uniform ion
distribution near an uncharged surface, which contradicts with the MD simulation shown in
Figure 1.1. Modified theories accounting for the finite ion size [67,125,126], dispersive force
[52,53,125,127-129], and ion-ion correlations [52,53,125,127-129] are just emerging, but their
application in the nanopore confinement has not been verified by experiments. Moreover, nearly
all theoretical simulations of nanoconfined electrolytes have used the charge neutrality condition
as a starting point when the confining walls are not charged. This is intuitively expected since a
substantial charge imbalance could be energetically unfavorable due to the strong electrostatic
repulsion, especially inside a nanoconfined region. However, such an assumption is questionable.
As we can see in Figure 1.1, cations and anions are separated near the interface. Inside the very
small nanoconfined space, how would the tendency of charge separation induced by the
interfacial specific ion effects negotiate with the electroneutrality condition? Can the charge
neutrality be violated inside the nanoconfined space? What other unusual consequences can the
specific ion effects lead to?
1.1.3 NMR Approach for Nanoconfined Electrolytes and Specific Ion Effects
The objective of this dissertation is to employ the NMR technique to investigate
nanoconfined electrolytes. The nanoconfinement is provided by a high quality activated carbon
derived from the polymer poly(etheretherketone) (PEEK) [130-133]. Compared to other
activated carbons made from natural product precursors, the PEEK-derived carbon has several
7
is able to be tuned from 0.5 nm to 2 nm by controlling the physical activation condition. Thirdly,
it consists of mainly micropores (less than 2 nm) and has a very narrow pore size distribution
(PSD). All these properties are critical to investigate the manifestation of the specific ion effects
in nanoconfined electrolytes and their pore size dependence.
Figure 1.3: Illustration of an electrochemical system consisting of nanoconfined electrolytes in equilibrium with a bulk phase. The PEEK-derived activated carbon provides the confinement and its surface charge can be tuned by applying voltage. Electrolyte properties such as the ion distribution are important for many applications but are very challenging for experimental investigations.
NMR is a quantitative, ion-selective and non-invasive technique well suited for
investigating fluids in porous materials, especially in activated carbons [77,134-136]. Previous
NMR studies have investigated hydrogen storage [133], electrolyte organization [136], and water
adsorption [137] in activated carbons. The uniqueness of the activated carbon system is that the
electrolyte confined in the nanopores has a different chemical shift from the electrolyte outside
8
in equilibrium with a bulk phase, as illustrated in Figure 1.3. Many insights on the ion
distribution and transport can be gained by quantifying the average ion concentration in the
nanopores.
The role played by the specific ion effects can be evaluated in two ways. One is to
systematically explore a series of electrolytes where the anions are chosen from the Hofmeister
series and are known to vary in their interfacial interactions. The other way is to tune the surface
charge on the confining walls, as shown in Figure 1.3. The contributions from the electrostatic
and nonelectrostatic interactions can then be separated. Owing to the good conductivity of
activated carbon, the surface charging can be easily achieved by applying a voltage on the carbon
electrodes as it is usually done in a carbon supercapacitor.
1.1.4 Dissertation Outline
Chapter 2 describes the synthesis and characterization of the PEEK-derived activated
carbon. A series of activated carbon with different pore sizes and narrow PSDs is obtained. A
convenient NMR method based on the NICS mechanism is established to characterize the PSD
of the activated carbons, with the aid of DFT calculations to establish the quantitative
relationship between the NICS value and the pore size.
Chapter 3 reports the NMR measurement of the average ion concentrations inside the
carbon nanopores for a series of sodium salts whose anions are chosen from the Hofmeister
series. The specific ion effects on the electroneutrality breakdown are evaluated. The dependence
of the ion concentrations on the surface charging is measured by the in-situ NMR on a carbon
supercapacitor. The role of ion-electrostatic ion-surface interactions and ion-ion correlations are
9
Chapter 4 focuses on the numerical calculation of the ion distributions inside the
nanopores to elucidate the mechanism of the electroneutrality breakdown. The generalized PB
equation accounting for the ion-specific interfacial interactions is solved both inside and outside
the nanopores simultaneously. A new boundary condition permitting induced surface charge is
employed.
Chapter 5 reports the in-situ NMR observation of the ion permeation and dehydration in
the voltage-gated carbon nanopores. A molecular-scale understanding is provided for the ion
transport into nanopores whose size is comparable to the hydrated ion size, shedding lights on
the physics of the interfacial specific ion effects in nanoconfinement.
1.2 NMR Principles
NMR is the main technique used in this dissertation to probe the molecular and ionic
processes inside activated carbon nanopores. A brief review of the NMR principles is provided
here before discussing the in-situ NMR results.
1.2.1 Magnetization
A nucleus with spin quantum number I has an angular momentum and magnetic
moment , where is the Planck constant and is the gyromagnetic ratio. Table 1.1 lists
the gyromagnetic ratios for nuclei relevant to this dissertation. When a nucleus is placed in an
external static magnetic field B0 along the z-direction, the interaction energy splits into 2I+1
levels Em=-B0 mћB0 with the magnetic quantum numberm I, I 1, I 1,I . In
thermal equilibrium, the probability for the spin to stay on each energy level follows the
Boltzmann distribution, 0
exp ( m ) exp ( )
m
B B
E m
P
k T k T
ћB . The net magnetization of N
10
0
0
0
exp ( )
exp ( )
I
m I B
I
m I B
m m k T M N m k T
ћB ћ ћB (1.1)In the high temperature approximation, i.e.ћB0 k TB , this reduces to
2 2 0 0
( 1)
3 B
N B I I M
k T
ћ (1.2)
Table 1.1: Nucleus gyromagnetic ratio and natural abundance [142]
Nucleus Spin Natural Abundance (%) 10 rad s
6 -1T-1
-1
MHz T 2
1
H 1/2 ~100 267.522 42.577
2
H 1 0.015 41.066 6.536
11
B 3/2 80.1 85.847 13.663
13
C 1/2 1.1 67.283 10.708
15
N 1/2 0.37 -27.126 -4.317
19
F 1/2 ~100 251.815 40.078
23
Na 3/2 ~100 70.808 11.269
The nuclear spin precesses along the external magnetic field and is governed by the
Hamiltonian
0 z
H B I (1.3)
The precession angular frequency, known as the Larmor frequency, is B0. Here the
positive and negative signs of γ mean different precession directions.
If an oscillating magnetic field at the Larmor frequency is applied perpendicular to the
11
the z-direction. After the perturbation, the macroscopic net magnetization precesses along the
static field B0 and generates an oscillating electromagnetic signal that can be picked up by a
sensitive radio-frequency detector. This signal is often referred to as the free induction decay
(FID).
1.2.2 Relaxation
Two relaxation processes are important in the NMR: the transverse relaxation and the
longitudinal relaxation. In the classical picture, the Bloch equations describe the time evolution
of the net magnetization:
2 2 0 1 ( ) ( ) ( ) x x x y y y z z z dM M dt T dM M dt T M M dM dt T M B M B M B (1.4)
where T2 is the transverse relaxation time and T1 is the longitudinal relaxation time. After the
perturbation which moves the net magnetization from z direction to –y direction, the evolution of
the macroscopic magnetization has the form:
0 2
0 2
0 0 1
sin( ) exp( / )
cos( ) exp( / )
exp( / )
x
y
z
M M t t T
M M t t T
M M M t T
(1.5)
For spin >1/2 nuclei such as 23Na, the electric quadrupole coupling plays a dominant role.
For spin 1/2 systems, the most important relaxation mechanism is the through-space dipolar
coupling between spins. The rotational and translational motion of the molecule results in a
12
same type, such as 1H in H2O, the intramolecular dipole-dipole interaction dominates the
relaxation process, and the relaxation times are given by [142]
2
1
2
2
1 3
[ ( ) 4 (2 )] 10
1 3
[3 (0) 5 ( ) 2 (2 )]
20
b J J
T
b J J J
T (1.6) where 2 0 3 4 b r
ћ is the dipole-dipole coupling constant (r is the intramolecular distance
between the two spins) and ( ) 2 2 1
c
c
J
is the spectral density, i.e. the Fourier transform of
the autocorrelation function (c is the correlation time).
1.2.3 Chemical Shift
The local magnetic field that a spin sees is not exactly the same for all spins even when
the external magnetic field B0 is very uniform. It depends on the local electronic environment
because electrons are magnetic. This results in changes in the Larmor frequency. The frequency
shift depends on the magnetic field strength, but the ratio of the shift over the Larmor frequency
is fixed, and this is called the chemical shift in diamagnetic materials, the Knight shift in metals,
and the paramagnetic shift in paramagnetic materials. The expression for the chemical shift is as
follows: 0 0 (1.7)
where0 is the Larmor frequency of a reference compound. Tetramethylsilane (TMS) is usually
used as the reference for 1H, 13C and 29Si.
The chemical shift is very useful in probing the local structure and environment. In this
13
of hydrated ions which reveals important information on the hydration number. The other is the
chemical shift in the activated carbon nanopores. The sensitive dependence of the chemical shift
14 1.3 REFERENCES
1. Thompson, W. H. Annual Review of Physical Chemistry62, 599-619 (2011). 2. Soniat, M. and Rick, S. W. J. Chem. Phys.137, 044511-044519 (2012). 3. Kropman, M. F. and Bakker, H. J. Science291, 2118-2120 (2001). 4. Hinton, J. F. and Amis, E. S. Chem. Rev.71, 627-674 (1971).
5. Christian, K. and Luigi Delle, S. J. Phys.: Condens. Matter19, 192101 (2007). 6. Young, R. M. and Neumark, D. M. Chemical Reviews112, 5553-5577 (2012). 7. Tielrooij, K. J., Garcia-Araez, N., et al.Science328, 1006-1009 (2010).
8. Laage, D. and Hynes, J. T. Proc. Natl. Acad. Sci. U.S.A.104, 11167-11172 (2007). 9. Barnett, R. N. and Landman, U. Phys. Rev. Lett.70, 1775-1778 (1993).
10. Craig, J. D. C. and Brooker, M. H. J. Solution Chem.29, 879-888 (2000).
11. Mancinelli, R., Botti, A., et al.Journal of Physical Chemistry B111, 13570-13577 (2007).
12. Marcus, Y. Chem. Rev.109, 1346-1370 (2009).
13. Mucha, M., Frigato, T., et al.Journal of Physical Chemistry B109, 7617-7623 (2005). 14. Jungwirth, P. and Tobias, D. J. Journal of Physical Chemistry B105, 10468-10472
(2001).
15. Jungwirth, P. and Tobias, D. J. Journal of Physical Chemistry B106, 6361-6373 (2002). 16. Jungwirth, P. and Tobias, D. J. Chemical Reviews106, 1259-1281 (2006).
17. Zhang, Y. J. and Cremer, P. S. Curr. Opin. Chem. Biol.10, 658-663 (2006). 18. Lo Nostro, P. and Ninham, B. W. Chemical Reviews112, 2286-2322 (2012). 19. Parsegian, V. A. Nature378, 335-336 (1995).
20. Collins, K. D. and Washabaugh, M. W. Quarterly Reviews of Biophysics18, 323-422 (1985).
15
22. Kunz, W., Henle, J., et al.Current Opinion in Colloid & Interface Science9, 19-37 (2004).
23. Kunz, W., Specific ion effects. (World Scientific, Singapore, 2010).
24. Kunz, W., Lo Nostro, P., et al.Current Opinion in Colloid & Interface Science9, 1-18 (2004).
25. Jungwirth, P. and Tobias, D. J. J. Phys. Chem. B105, 10468-10472 (2001).
26. Lopez-Leon, T., Santander-Ortega, M. J., et al.Journal of Physical Chemistry C112, 16060-16069 (2008).
27. Luo, G. M., Malkova, S., et al.Science311, 216-218 (2006).
28. Laanait, N., Mihaylov, M., et al.Proceedings of the National Academy of Sciences109, 20326-20331 (2012).
29. Ghosal, S., Hemminger, J. C., et al.Science307, 563-566 (2005).
30. Cheng, M. H., Callahan, K. M., et al.Journal of Physical Chemistry C116, 4545-4555 (2012).
31. Xantheas, S. S. and Voth, G. A. Journal of Physical Chemistry B113, 3997-3999 (2009). 32. Wick, C. D. Journal of Physical Chemistry A117, 12459-12467 (2013).
33. Vu, T. H. and Shultz, M. J. Chemical Physics Letters572, 13-15 (2013). 34. Sloutskin, E., Baumert, J., et al.J. Chem. Phys.126 (2007).
35. Levin, Y. and dos Santos, A. P. Journal of Physics-Condensed Matter26 (2014). 36. Kumar, R., Knight, C., et al.Faraday Discussions167, 263-278 (2013).
37. Jorn, R., Kumar, R., et al.Journal of Physical Chemistry C117, 3747-3761 (2013). 38. dos Santos, A. P. and Levin, Y. Faraday Discussions160, 75-87 (2013).
39. dos Santos, A. P. and Levin, Y. Langmuir28, 1304-1308 (2012).
40. Cummings, O. T. and Wick, C. D. Journal of Chemical Physics139 (2013).
41. Shamay, E. S. and Richmond, G. L. Journal of Physical Chemistry C114, 12590-12597 (2010).
16
43. Robertson, E. J., Beaman, D. K., et al.Langmuir29, 15511-15520 (2013). 44. Record, M. T., Guinn, E., et al.Faraday Discussions160, 9-44 (2013).
45. Pegram, L. M. and Record, M. T. Journal of Physical Chemistry B111, 5411-5417 (2007).
46. Otten, D. E., Shaffer, P. R., et al.Proceedings of the National Academy of Sciences109, 701-705 (2012).
47. Newberg, J. T., McIntire, T. M., et al.Journal of Physical Chemistry A114, 9480-9485 (2010).
48. Kelly, D. N., Lam, R. K., et al.Journal of Physical Chemistry C117, 12702-12706 (2013).
49. Gopalakrishnan, S., Liu, D. F., et al.Chemical Reviews106, 1155-1175 (2006). 50. Ghosal, S., Brown, M. A., et al.Journal of Physical Chemistry A112, 12378-12384
(2008).
51. Knipping, E. M., Lakin, M. J., et al.Science288, 301-306 (2000). 52. Levin, Y., dos Santos, A. P., et al.Phys. Rev. Lett.103, 257802 (2009). 53. Horinek, D. and Netz, R. R. Phys. Rev. Lett.99, 226104 (2007).
54. Cheng, J., Vecitis, C. D., et al.Journal of Physical Chemistry B110, 25598-25602 (2006).
55. Schwierz, N., Horinek, D., et al.Langmuir29, 2602-2614 (2013). 56. Parsegian, V. A. Nature378, 335-336 (1995).
57. Gurau, M. C., Lim, S.-M., et al.J. Am. Chem. Soc.126, 10522-10523 (2004). 58. Lund, M. and Jungwirth, P. J. Phys.: Condens. Matter20, 494218 (2008). 59. Wilson, E. K. Chemical & Engineering News85, 47-49 (2007).
60. Omta, A. W., Kropman, M. F., et al.Science301, 347-349 (2003).
17
65. Tobias, D. J. and Hemminger, J. C. Science319, 1197-1198 (2008). 66. Kalcher, I., Schulz, J. C., et al.J. Chem. Phys.133, 164511 (2010). 67. Kalcher, I., Schulz, J. C., et al.Phys. Rev. Lett.104, 097802 (2010). 68. Lima, E., Horinek, D., et al.J. Phys. Chem. B112, 1580-1585 (2008). 69. Bou-Malham, I. and Bureau, L. Soft Matter6, 4062-4065 (2010).
70. Kalluri, R. K., Konatham, D., et al.Journal of Physical Chemistry C115, 13786-13795 (2011).
71. Argyris, D., Cole, D. R., et al.ACS Nano4, 2035-2042 (2010).
72. Ohba, T., Hata, K., et al.J. Am. Chem. Soc.134, 17850-17853 (2012). 73. Tan, H.-S., Piletic, I. R., et al.Phys. Rev. Lett.94, 057405 (2005).
74. Moilanen, D. E., Levinger, N. E., et al.Journal of the American Chemical Society129, 14311-14318 (2007).
75. Fayer, M. D. and Levinger, N. E. Annual Review of Analytical Chemistry3, 89-107 (2010).
76. Park, S., Moilanen, D. E., et al.Journal of Physical Chemistry B112, 5279-5290 (2008). 77. Wang, H., Forse, A. C., et al.J. Am. Chem. Soc.135, 18968-18980 (2013).
78. Forse, A. C., Griffin, J. M., et al.Physical Chemistry Chemical Physics15, 7722-7730 (2013).
79. Wang, H., Koster, T. K. J., et al.Journal of the American Chemical Society133, 19270-19273 (2011).
80. Deschamps, M., Gilbert, E., et al.Nature Materials12, 351-358 (2013). 81. Levi, M. D., Salitra, G., et al.Nature Materials8, 872-875 (2009). 82. Wang, H. J., Xi, X. K., et al.Science322, 80-83 (2008).
83. Cazade, P.-A., Hartkamp, R., et al.J. Phys. Chem. C118, 5061-5072 (2014). 84. Algara-Siller, G., Lehtinen, O., et al.Nature519, 443-445 (2015).
18
87. Afanasiev, V. N., Ustinov, A. N., et al.J. Phys. Chem. B113, 212-223 (2008). 88. Mancinelli, R., Botti, A., et al.J. Phys. Chem. B111, 13570-13577 (2007). 89. Headrick, J. M., Diken, E. G., et al.Science308, 1765-1769 (2005). 90. Raviv, U. and Klein, J. Science297, 1540-1543 (2002).
91. Marx, D., Chandra, A., et al.Chem. Rev.110, 2174-2216 (2010).
92. Sharma, T., Mohana Reddy, A. L., et al.Int. J. Hydrogen Energy33, 6749-6754 (2008). 93. Izadi-Najafabadi, A., Yamada, T., et al.ACS Nano5, 811-819 (2011).
94. Ling, L. C., Sun, G. W., et al.Acta Physico-Chimica Sinica27, 449-454 (2011). 95. Daffos, B., Taberna, P. L., et al.Fuel Cells10, 819-824 (2010).
96. Inagaki, M., Konno, H., et al.J. Power Sources195, 7880-7903 (2010). 97. Zheng, C., Qi, L., et al.J. Power Sources195, 4406-4409 (2010). 98. Simon, P. and Gogotsi, Y. Nat Mater7, 845-854 (2008).
99. Chmiola, J., Yushin, G., et al.Science313, 1760-1763 (2006). 100. Zhu, Y., Murali, S., et al.Science332, 1537-1541 (2011).
101. Litster, S., Sinton, D., et al.J. Power Sources154, 95-105 (2006). 102. Kjeang, E., McKechnie, J., et al.J. Power Sources168, 379-390 (2007). 103. Chmiola, J., Largeot, C., et al.Angewandte Chemie120, 3440-3443 (2008). 104. Balducci, A., Dugas, R., et al.J. Power Sources165, 922-927 (2007). 105. Mucha, M., Frigato, T., et al.J. Phys. Chem. B109, 7617-7623 (2005). 106. Kastening, B., Hahn, M., et al.Electrochimica Acta42, 2789-2799 (1997). 107. Barbieri, O., Hahn, M., et al.Carbon43, 1303-1310 (2005).
108. Vatamanu, J., Borodin, O., et al.J. Phys. Chem. B115, 3073-3084 (2011). 109. Oren, Y. and Soffer, A. Journal of Electroanalytical Chemistry and Interfacial
Electrochemistry186, 63-77 (1985).
19
111. Simon, P. and Gogotsi, Y. Philosophical Transactions of the Royal Society a-Mathematical Physical and Engineering Sciences368, 3457-3467 (2010).
112. Stojek, Z., in Electroanalytical Methods, edited by F. Scholz (Springer Berlin Heidelberg, 2010), pp. 3-9.
113. Cohen-Tanugi, D. and Grossman, J. C. Nano Lett.12, 3602-3608 (2012). 114. Elimelech, M. and Phillip, W. A. Science333, 712-717 (2011).
115. Oren, Y. Desalination228, 10-29 (2008).
116. Zhou, Y. F., Morais-Cabral, J. H., et al.Nature414, 43-48 (2001). 117. Gouaux, E. and MacKinnon, R. Science310, 1461-1465 (2005).
118. Eijkel, J. C. T. and van den Berg, A. Microfluid. Nanofluid.1, 249-267 (2005). 119. Sparreboom, W., van den Berg, A., et al.Nat. Nanotechnol.4, 713-720 (2009). 120. Duan, C. H. and Majumdar, A. Nature Nanotechnology5, 848-852 (2010). 121. Beckstein, O., Tai, K., et al.J. Am. Chem. Soc.126, 14694-14695 (2004). 122. Richards, L. A., Schäfer, A. I., et al.Small8, 1701-1709 (2012).
123. Thompson, A. N., Kim, I., et al.Nat. Struct. Mol. Biol.16, 1317-U1143 (2009). 124. Jensen, M. O., Borhani, D. W., et al.Proc. Natl. Acad. Sci. U. S. A.107, 5833-5838
(2010).
125. Lauw, Y., Horne, M. D., et al.Phys. Rev. Lett.103, 117801 (2009). 126. Borukhov, I., Andelman, D., et al.Phys. Rev. Lett.79, 435-438 (1997). 127. Levin, Y. Phys. Rev. Lett.102, 147803 (2009).
128. Skinner, B., Loth, M. S., et al.Phys. Rev. Lett.104, 128302 (2010).
129. Boström, M., Williams, D. R. M., et al.Phys. Rev. Lett.87, 168103 (2001). 130. Cansado, I., Gonçalves, F., et al.Carbon45, 2454-2455 (2007).
20
134. Ilott, A. J., Trease, N. M., et al.Nature communications5 (2014).
135. Wang, H., Köster, T. K. J., et al.J. Am. Chem. Soc.133, 19270-19273 (2011). 136. Deschamps, M., Gilbert, E., et al.Nature materials (2013).
137. Wang, H.-J., Kleinhammes, A., et al.J. Phys. Chem. C118, 8474-8480 (2014). 138. Forse, A. C., Griffin, J. M., et al.J. Phys. Chem. C118, 7508–7514 (2014). 139. Xing, Y.-Z., Luo, Z.-X., et al.Carbon77, 1132-1139 (2014).
140. Slichter, C. P., Principles of magnetic resonance. (Springer Science & Business Media, 1990).
141. Abragam, A. Oxford: University Press119, 120 (1999).
21
CHAPTER 2 PROBING CARBON MICROPORES BY NUCLEUS INDEPENDENT CHEMICAL SHIFT
An accurate determination of the PSD of activated carbon is a challenging problem,
especially for the subnanometer-sized micropores. Here, a simple room temperature method is
introduced for determining the PSD of activated carbons based on the 1H MAS NMR spectrum
of adsorbed water. The observed NMR chemical shift is determined by the NICS mechanism. A
DFT computation of the NICS yields a quantitative relationship between the observed chemical
shift and the micropore size. This relationship provides a direct link between the lineshape of the
1
H MAS spectrum and the PSD.
2.1 Introduction
Activated carbons (ACs) are widely used in many applications such as water treatment,
chemical purification, catalysis, and energy storage devices [1]. All these applications depend
strongly on the porous structure of carbons characterized by a complex network consisting of
micropores (< 2 nm), mesopores (2 ~ 50 nm), and macropores (> 50 nm)[2]. In particular, the
micropore network with characteristic pore sizes below 2 nm plays a crucial role. The adsorption
isotherm measurement is the conventional approach to characterize the PSD. Among the probe
molecules (He, Ar, N2, CO2, H2O etc.), the N2 adsorption at 77 K is the most frequently used for
ACs’ characterization [3]. Several theoretical models are employed to interpret such adsorption
isotherms and to derive the surface area and PSD. Here, the most well-known is the
22
this method fails in micropores where the micropore filling is an important adsorption
mechanism but it violates the assumptions of the BET theory [2].
Alternative methods such as the Dubinin-Stoeckli equation [4] have also been proposed
to determine the PSD of micropores. However, this equation is semi-empirical. It is based on the
assumption of a Gaussian PSD and requires the knowledge of the binding energy [4]. Recently,
the relationship between N2 or Ar isotherms and the pore size has been predicted using the DFT
[5-7]. This method needs information on the interaction potentials and requires isotherms
measured at extremely low relative pressure P/P0<10-5 (P0 is the saturated vapor pressure) which
is very time consuming. Besides the adsorption isotherm measurements, several other methods
for characterizing the PSD of ACs have also been introduced, including the NMR cryoporometry
[8], relaxometry [9], and diffusometry [10]. However, complicated experimental methods and
techniques are required in these approaches.
Simple characterization methods are highly desirable for a convenient and reliable
measurement of carbon PSDs in the micropore range. Here, a novel method is introduced to
characterize the PSD by taking a room temperature 1H MAS NMR spectrum of a known quantity
of water added to the AC sample. This approach is made possible by a DFT calculation of the
NICS [11], which establishes a quantitative relationship between the micropore size and the
NICS in ACs. This method is applicable to samples with graphite-like local internal surfaces
which can produce a NICS. It only requires taking one 1H MAS spectrum of the water/carbon
mixture and involves no additional knowledge such as the interaction potentials or adsorption
23 2.2 Experimental Details and DFT Calculation 2.2.1 Sample Preparation
The high temperature polymer PEEK was used to prepare the ACs by a method slightly
modified from the previously reported procedure [12]. The sample preparation process is divided
into two steps: carbonization and activation. The carbonization process creates very small
micropores and provides seeds for further micropore growth upon activation. The activation
process enlarges the micropores by a high temperature H2O vapor reacting with the weak bonds
in the carbonized sample. During the carbonization, 1 g of granulated Victrex® PEEKTM was
placed in the center of a tubular furnace and heated under argon flow to 900°C with a ramp rate
of 45°C/min. After 30 min at 900°C, the carbonized chunks were cooled down to room
temperature under argon flow and then ground into fine particles of approximately 0.5 mm in
diameter. The ground material was heated up again to 900°C and activated under the water vapor
carried by the Ar gas flow for a chosen time period before cooling down to room temperature. A
longer time activation leads to a larger micropore size and a larger burn-off value (BO), which is
defined as the ratio of the mass reduction during the activation step to the sample mass before the
activation but after the carbonization: BO
mcma
/mc, where ma is the mass after the activation and mc is the mass before the activation but after the carbonization. The PEEKprecursor loses approximately 50% of its mass in the carbonization step. The activated carbon
sample is labeled based on its BO value, for instance, P-92 represents an AC sample with a BO
value of 92%. Here “P” represents the precursor PEEK. Figure 2.1 is a transmission electron
24
Figure 2.1: TEM image of a carbon sample with BO = 92% activated at 900°C.
2.2.2 NMR Experiment
The 1H MAS NMR spectrum was recorded on a 9.4 T magnet (400 MHz for 1H) with a
TECMAG APOLLO spectrometer and a Chemagnetics 4mm MAS probe. About 10 mg carbon
powder was loaded into the MAS rotor with an air tight O-ring plug. The 1H spectrum was
acquired at a spinning speed of 8 kHz (all NMR spectra in this chapter were taken under 8 kHz
MAS unless otherwise specified). A background 1H MAS spectrum of the dry sample stored in a
desiccator was first recorded. It had a weak featureless broad peak of 60 ppm, containing about
20
4 10 protons/gram, and was subtracted from all the spectra presented in this chapter. After
that, a known amount of distilled water was injected into the sample-containing MAS rotor using
a syringe. Water was adsorbed in the micropores immediately after the injection and the sealed
sample reached equilibrium in less than 5 min as monitored by the NMR spectra. The amount of
water added to the AC sample was determined both by the volume of injected water and by
25
micropores, the sample was dried in a desiccator for 48 hours after the NMR experiment and the
background spectrum was taken again. The two background spectra (before adding water and
after drying in a desiccator) were identical, indicating that no permanent chemical bonds are
formed in the process of the experiment. The water loading was also implemented by placing AC
samples in a saturated water vapor at room temperature for 20 hours. The 1H MAS spectra of
water loading by the vapor adsorption and by the liquid injection were compared.
2.2.3 DFT Calculation Approach
All the DFT computation results were obtained using Gaussian 09-b01 [13]. The internal
surface structure of ACs was mimicked by the central carbon ring of the circumcoronene
molecule (shown in Figure 2.2). The circumcoronene structure was optimized at the
B3LYP/6-311G(d) level [14]. The NICS was computed by the Gauge-Independent Atomic Orbital (GIAO)
method [15-19]. The ghost atom [20] used to probe the NICS was placed at three different
locations in the center ring, namely, above the ring center, above the carbon atom and above the
C-C bond center, as illustrated in Figure 2.2. At each location, the NICS value was evaluated as a
function of the distance to the carbon surface.
26 2.2.4 Chemical Shift Mechanism in AC Micropores
The chemical shift mechanism resulting from the interatomic ring current, such as that of
a benzene molecule [21], has been recognized for a long time [22,23]. The diamagnetic response
of the cyclic conjugated electrons in benzene to the applied magnetic field leads to an upfield
chemical shift [21,23]. This effect has been observed in 1H NMR spectra for several different
adsorbates, such as hydrogen [24], water [25], ammonia [26] and others, on the surface of
aromatic systems. Since the chemical shift is due to the diamagnetic and paramagnetic effects of
the ring current associated with the aromatic and anti-aromatic compound, it is independent of
the probe atom. An upfield NICS value indicates the existence of a diatropic ring current [27].
Therefore the so-called NICS index is widely used for characterizing the aromaticity and
antiaromaticity [11,27,28].
As expected, there is also a large NICS effect in ACs. Figure 2.3 shows the static 1H, 19F,
and 23Na spectra of a 1M NaBF4 aqueous solution injected into a P-40 sample. Two
well-resolved peaks are clearly observed in all three spectra. The left peak of the 1H spectrum, peak A,
is due to the water stored in large mesopores and/or macropores. It is slightly shifted upfield by
0.1 ppm compared to that of the bulk water due to the isotropic bulk magnetic susceptibility
effect. Since the whole sample experiences the identical isotropic bulk magnetic susceptibility
effect, it is suitable to use peak A as a reference for measuring the NICS value. Setting the
chemical shift of the left peak as 0 ppm for all three nuclei, the right peaks, peak B, on all three
spectra exhibit the same chemical shift of -7.7 ppm. Peak B is associated with the water adsorbed
inside the micropores [25]. The upfield shift of peak B with respect to peak A is due to the NICS
effect [21-23]. It is not related to any effect of chemical bonding since all three nuclei exhibit the
27
10 5 0 -5 -10 -15 -20
23
Na
1H
Chemical Shift (ppm)
19F
Peak A
7.7 ppm
Peak B
Figure 2.3: Static 1H, 19F, 23Na spectra of a P-40 AC sample filled with 1 M NaBF4 solution. The
left peak (peak A) is set as the reference (0 ppm) and the right peaks (peak B) of all three nuclei exhibit the same chemical shift of -7.7 ppm due to the NICS effect.
2.2.5 DFT Calculation of NICS
The NICS value as a function of the distance between the probe atom and the carbon
surface (carbon atom center),
r , can be obtained from the DFT calculation [29]. Here the central carbon ring of the circumcoronene molecule is used to model the carbon microporesurface (Figure 2.2).The shielding tensor of the NICS can then be calculated using the DFT
method at the position specified by the NICS probe atom. The calculation result of
r is shown in Figure 2.4a. The NICS at three different locations, namely, above the ring center,above the carbon atom and above the C-C bond center, are nearly identical when the distance r is
larger than 0.32 nm. Since the water molecule cannot approach the surface closer than this
distance,
r is assumed to be independent of the horizontal position on a graphitic surface. For the convenience of calculation,
r is fitted empirically in the region 0.3 nm r 3.0 nm28
with the parameter A24.6 1.2 ppm , r0 0.23 0.01 nm , and 0.75 0.02 as shown in Figure 2.4a.
0 1 2 3
0 1 2 3 4 5 6 7 8
0 1 2 3 -0.6
-0.4 -0.2 0.0 0.2
over the ring center over the carbon atom over the bond center fit N IC S ( pp m )
Distance r (nm)
a d e vi a ti o n (p p m)
Distance r (nm)
0 -2 -4 -6 -8 -10 -12 -14 0 1 2 3 4 5 6 7 8 9 10
0 -2 -4 -6 -8 -10 -12 -14 -0.10 -0.05 0.00 0.05 0.10
b
Pore Size d (nm)Chemical Shift (ppm) empirical fit de v iat ion (n m)
Chemical Shift (ppm)
Figure 2.4: (a) The dependence of the NICS on the distance from the molecule to the surface obtained by a DFT calculation. Three probe atom locations are used: over the ring center, over the carbon atom, and over the bond center of the central carbon ring of circumcoronene. The
29 2.2.6 NICS Averaging in Slit-Shaped Pores
A simple exchange model is assumed to correlate the NICS-related isotropic chemical
shift with the pore size. As shown in Figure 2.5, inside a slit-shaped pore [30], water molecules
are distributed throughout the internal space of the micropores. On the NMR timescale of 10 ms,
a water molecule can explore all the nanopore space because of its fast translational motion.
Since the NICS is a function of the distance from the molecule to the surface, as shown in Figure
2.4a, the measured NICS-related isotropic chemical shiftof a fully filled micropore is the NICS
averaged over the pore space and can be calculated as
2
d w d w d w
w w w
avg d w d w d w
w w w
r dr d r dr r dr
d
dr dr dr
(2.1)
where avg is the averaged NICS, d is the pore width (from carbon center to carbon center) of
the slit-shaped pore, and w, chosen as 0.32 nm [24], is the closest distance between the water
hydrogen and the carbon layer. The NICS contributions from both the carbon surfaces are taken
into account in Eq. (2.1).
30
2.2.7 Correlation between the Pore Size and the Chemical Shift
By plugging
r Aexp
r r/ 0
into Eq. (2.1), the averaged NICS value, 𝛿 , canthen be calculated as a function of the pore size d by
2 /02
d w r r avg
w
A
d e dr
d w
(2.2)The function in Eq. (2.2) can be inverted numerically to obtain the dependence of the
pore size d on 𝛿 and this numerical result is shown in Figure 2.4b. Again, for the convenience
of future usage, the numerical result of d versus 𝛿 is fitted empirically with the following
function
1exp avg / 1 2exp avg / 2 0
d A A d (2.3)
The fitting parameters are A116.1 0.2 nm ,
1 0.531 0.008 ppm , A2 3.83 0.05 nm ,2 3.75 0.06 ppm
and d0 0.57 0.01 nm . As shown in Figure 2.4b, an excellent fit isachieved. Figure 2.4b shows that the water contained in the mesopores larger than 3 nm produces
a NICS value less than 2 ppm, which will contribute to peak A rather than peak B due to its
exchange with the intergranular water. Peak B corresponds to the water contained in the
micropores (d 2 nm).
A complete micropore filling is important for the application of this model, especially for
large micropores. Figure 2.6a compares the 1H MAS NMR spectrum of a P-0 sample with water
adsorbed under saturated water vapor pressure for 20 hours with that by liquid water injection.
After 20 hours exposure to the saturated water vapor, the mass ratio of the adsorbed water to P-0
is 0.19. Its spectrum shows a single peak B and the water is only adsorbed into the micropores.
31
internal surfaces of all the accessible micropores have a graphite-like surface structure, giving
rise to a nearly identical NICS. Further water injection with a syringe increases the water to AC
mass ratio from 0.19 to 0.39. At this point, peak A emerges, but peak B remains the same. This
indicates that the micropores are already fully filled with water during the 20-hour exposure to
the saturated water vapor. The additional water injected only goes to the large mesopores and/or
macropores, giving rise to peak A. For comparison, liquid water is injected into a dry P-0 AC
sample directly and the spectrum (Figure 2.6a) shows an identical peak B with that after 20-hour
exposure to the saturated water vapor. Thus, the water injection method also results in fully filled
micropores.
Figure 2.6b shows the 1H MAS NMR spectra of a P-92 AC sample filled with different
amount of water by the liquid water injection using a syringe. Here, peak B appears first and
grows in intensity as the amount of adsorbed water increases. After the mass ratio of water to
carbon reaches 1.42, peak A starts to emerge while peak B stops growing. It is noticed that in
Figure 2.6b, peak B shifts gradually toward a smaller NICS value as its intensity increases with
increased water filling. A 0.7 ppm chemical shift difference is observed between the spectra of
partially filled and fully filled P-92. When a small amount of water is initially added into the
micropores, water molecules are preferentially adsorbed on the surface and spend, on average,
more time near the surface where the NICS effect is large. With more water added, the pore
space is gradually filled up and the water distribution averaged over time is close to the volume
average used in Eq. (2.1). Therefore, the measured NICS-related isotropic chemical shift (shift of
peak B with respect to the shift of peak A) of a fully filled micropore would have a less negative
32
5
0
-5
-10
-15
2 0 -2 -4 -6 -8 -10-12
a
Chemical Shift (ppm)
Vapor adsorption Vapor adsorption + Water injection
Water injection
Peak B Peak A
Chemical Shift (ppm)
2
0
-2
-4
-6
-8
-10
1.83
1.42
0.93 0.67 Peak B
Chemical Shift (ppm)
0.7 ppm
Peak A
0.38
b
water to carbon mass ratio
Figure 2.6: (a) 1H MAS spectra of water in a P-0 AC sample with different water filling methods: Adsorption in saturated water vapor pressure (black), vapor adsorption followed by liquid water injection (red); liquid water injection by a syringe (blue). The inset shows the overlay of the three spectra. The identical peak B indicates that the micropores are fully filled by each method. (b) 1H MAS spectra of water in a P-92 AC sample at different water filling level with