INVESTIGATING NON-FULLERENE ACCEPTORS IN ORGANIC PHOTOVOLTAICS
Nicole Bauer
A dissertation submitted to the faculty of the University of North Carolina at Chapel Hill in partial fulfillment of the requirements for the degree of Doctor of Philosophy in the Department
of Chemistry.
Chapel Hill 2019
ii © 2019 Nicole Bauer
iii ABSTRACT
Nicole Bauer: Investigating Non-Fullerene Acceptors in Organic Photovoltaics (Under the direction of Wei You)
Organic photovoltaics are becoming a viable alternative to silicon solar technologies due to their lower cost and ease of fabrication. Recently, the rise of a new class of electron acceptor materials, known as non-fullerene acceptors (NFAs), has led to dramatic improvements in the performance of organic photovoltaics, reaching efficiencies over 15%. Despite these impressive improvements, the working mechanisms of these NFAs and their structure-property relationships are not well understood. In this dissertation, we investigated these new acceptors in an attempt to understand how their design influences their performance in an organic photovoltaic device. We first performed a comparative study of an NFA with a traditional fullerene derivative to
determine how and why their performance differs. We found that the devices incorporating the NFA displayed a lower efficiency due to lower charge mobility and a less desirable film
iv
v
ACKNOWLEDGEMENTS
First, I would like to thank my advisor, Dr. Wei You, for his support over the last five years. His optimism and guidance made all this work possible. I would also like to thank my committee, Dr. Joanna Atkin, Dr. Andrew Moran, Dr. Sergei Sheiko, and Dr. Scott Warren, for their time and support of this effort.
Second, I would like to thank Dr. Liang Yan for everything he has taught me about organic semiconductors, and always being willing to answer my questions and help when I needed it. I would also like to thank Dr. Qianqian Zhang and Jeromy Rech for making all of the polymers used in this work, I could not have done this without them. Additionally, I want to thank the other members of the You Group, past and present, for their help and for making the lab a fun and supportive place to work.
I would also like to thank our collaborators, Dr. Harald Ade, Dr. Xiaowei Zhan, Dr. He Yan, Dr. Franky So, and their students for making the acceptor materials used in this work and assisting with characterization and additional experiments.
I also thank all my family and friends, especially my parents. They have always supported me in whatever I chose to do, and I would not be where I am today without them.
vi
TABLE OF CONTENTS
LIST OF TABLES ... x
LIST OF FIGURES ... xi
LIST OF CHARTS ... xiii
LIST OF ABBREVIATIONS ... xiv
CHAPTER 1: INTRODUCTION ... 1
1.1 History and Introduction to Organic Photovoltaics ... 1
1.2 Donor Polymer Design ... 5
1.3 Introduction to Non-Fullerene Acceptors ... 7
CHAPTER 2: COMPARING NON-FULLERENE ACCEPTORS WITH FULLERENE IN POLYMER SOLAR CELLS: A CASE STUDY WITH FTAZ AND PYCNTAZ ... 9
2.1 Introduction ... 9
2.2 Results and Discussion ... 12
2.2.1 Photovoltaic Performance ... 12
2.2.2 Open-Circuit Voltage (Voc) ... 14
2.2.3 Short-Circuit Current (Jsc) ... 17
vii
2.2.5 Morphology ... 24
2.3 Conclusions ... 27
2.4 Experimental ... 28
2.4.1 Synthesis ... 28
2.4.2 Device Fabrication ... 28
2.4.3 SCLC Measurements ... 29
2.4.4 Long Wavelength EQE Measurements ... 30
2.4.5 Morphology ... 30
CHAPTER 3: DONOR POLYMER FLUORINATION DOUBLES THE EFFICIENCY IN NON-FULLERENE ORGANIC PHOTOVOLTAICS ... 31
3.1 Introduction ... 31
3.2 Results and Discussion ... 33
3.2.1 Optical and Electrochemical Properties ... 33
3.2.2 Device Performance ... 34
3.2.3 Device Physics ... 36
3.2.4 Morphology ... 41
3.3 Conclusions ... 43
3.4 Experimental ... 44
viii
3.4.2 SCLC Measurements ... 45
3.4.3 Morphology ... 45
CHAPTER 4: THE IMPACT OF FLUORINATION ON BOTH DONOR POLYMER AND NON-FULLERENE ACCEPTOR: THE MORE FLUORINE, THE MERRIER ... 47
4.1 Introduction ... 47
4.2 Experimental ... 50
4.2.1 Synthesis ... 50
4.2.2 UV-Vis Spectroscopy ... 50
4.2.3 Device Fabrication and Testing ... 50
4.2.4 SCLC Measurements ... 51
4.2.5 Morphology ... 52
4.3 Results and Discussion ... 52
4.3.1 Optical and Electrochemical Properties ... 52
4.3.2 Photovoltaic Performance ... 53
4.3.4 Light Intensity Dependence of Jsc and Voc ... 56
4.3.5 Mobility ... 57
4.3.6 Morphology ... 58
4.4 Conclusion ... 60
CHAPTER 5: CONCLUSION ... 62
ix
5.2 Requirements for High Performance NFAs ... 63
5.3 Impact of Donor Polymer Fluorination in NFA-based OPVs ... 63
5.4 Effect of Fluorination of Both the Donor and Acceptor Material ... 64
5.5 Outlook ... 65
APPENDIX A: SUPPORTING INFORMATION FOR CHAPTER 2 ... 67
APPENDIX B: SUPPORTING INFORATION FOR CHAPTER 3 ... 69
APPENDIX C: SUPPORTING INFORMATION FOR CHAPTER 4 ... 72
x
LIST OF TABLES
Table 2.1 Photovoltaic characteristics of SF-PDI2- and PCBM-based solar cells ... 13
Table 2.2 Voc, ECT, and energetic losses for FTAZ- and PyCNTAZ-based solar cells ... 14
Table 2.3 Electron and hole mobilities for SF-PDI2- and PCBM-based solar cells ... 23
Table 2.4 Domain characteristics of the four blend films extracted from
RSoXS measurements ... 27 Table 3.1 Photovoltaic characteristics of FTAZ:ITIC and HTAZ:ITIC solar cells ... 35 Table 3.2 Electron and hole mobility values for the FTAZ:ITIC and HTAZ:ITIC devices ... 40 Table 3.3 Domain spacing and relative purity for FTAZ:ITIC and
HTAZ:ITIC blends from RSoXS data ... 43 Table 4.1 Photovoltaic characteristics for all four blends... 55 Table 4.2 Hole and electron mobility values for all four blends ... 58 Table 4.3 Domain spacing and relative root-mean-square composition variation
xi
LIST OF FIGURES
Figure 1.1 Typical architectures for BHJ-based organic photovoltaics ... 2 Figure 1.2 The four steps to charge collection in an OPV ... 3 Figure 1.3 Characteristic current density-voltage (J-V) curve for an OPV ... 4 Figure 2.1 a) J-V characteristics of SF-PDI2- and PCBM-based solar cells;
b) Normalized absorption spectra of neat FTAZ, PyCNTAZ, and SF-PDI2 films ... 13
Figure 2.2 HOMO and LUMO levels of PyCNTAZ, FTAZ, SF-PDI2, and PCBM ... 15
Figure 2.3 Measured low energy external quantum efficiency (EQE) curves and
calculated fittings for a) FTAZ and b) PyCNTAZ based solar cells ... 17 Figure 2.4 Photoluminescence of neat a) FTAZ (excitation at 532 nm) and
b) PyCNTAZ (excitation at 618 nm) films and the blend films with
SF-PDI2 and PCBM (D:A=10:1) ... 19
Figure 2.5 Light intensity dependence of a) short-circuit current and b) open-circuit voltage .... 21 Figure 2.6 a) Photocurrent density and b) charge collection probability (P(E,T))
of SF-PDI2- and PCBM-based solar cells ... 22
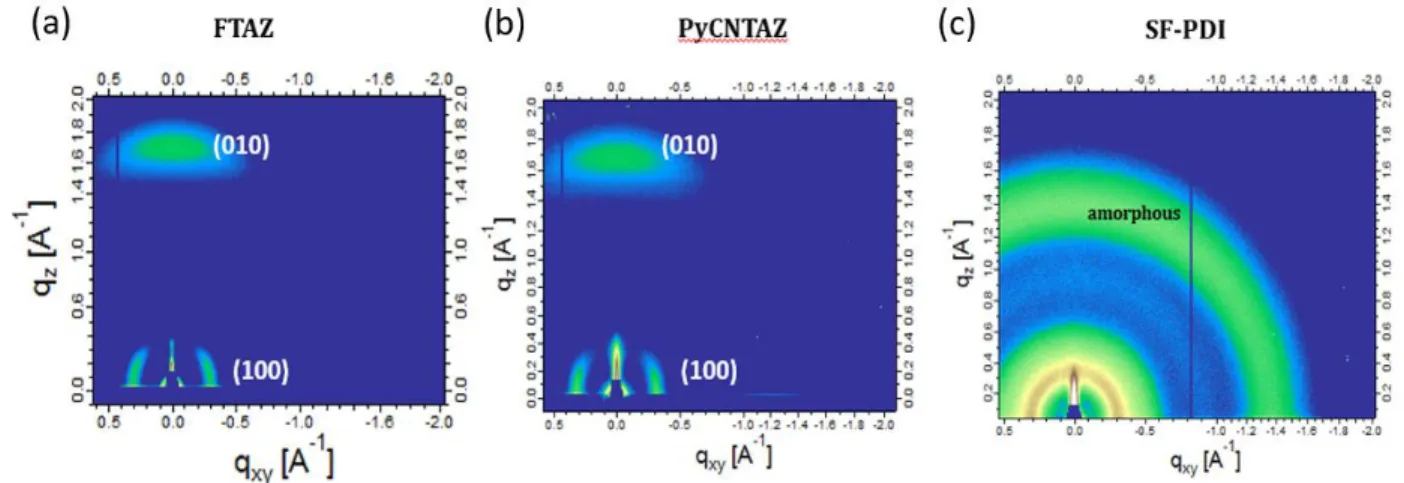
Figure 2.7 GIWAXS 2D patterns of the thin films based on neat materials: a) FTAZ;
b) PyCNTAZ; c) SF-PDI2 ... 24
Figure 2.8 GIWAXS 2D patterns of a) FTAZ:SF-PDI2, b) FTAZ:PCBM,
c) PyCNTAZ:SF-PDI2, and d) PyCNTAZ:PCBM blend films;
e) Lorentz-corrected RSoXS profiles of the blend films ... 25 Figure 3.1 a) Normalized absorption and b) energy levels of FTAZ, HTAZ, and ITIC ... 34 Figure 3.2 a) Representative J-V curves and b) EQE spectra of FTAZ:ITIC and
HTAZ:ITIC BHJ devices ... 36 Figure 3.3 Photoluminescence of a) neat FTAZ and HTAZ (excitation at 530 nm)
and b) neat ITIC (excitation at 650 nm) and both BHJ blend films ... 37 Figure 3.4 Light intensity dependence of a) Jsc and b) Voc for the FTAZ:ITIC
and HTAZ:ITIC devices ... 39 Figure 3.5 a) Photocurrent and b) charge collection probability of the FTAZ:ITIC
xii
Figure 3.6 2D GIWAXS patterns for a) FTAZ:ITIC and b) HTAZ:ITIC films ... 42 Figure 4.1 a) Normalized absorbance in thin film and b) energy levels for
4’-FT-HTAZ, 4’-FT-FTAZ, ITIC-Th, and ITIC-Th1 ... 53
Figure 4.2 a) Representative J-V curves and b) external quantum efficiencies
for all four devices ... 56 Figure 4.3 a) Jsc and b) Voc dependence on light intensity for all four devices ... 57
Figure 4.4 a) Sector averaged (±10°) profiles (solid line: out-of-plane direction; dotted line: in-plane direction) and b)-e) 2D GIWAXS patterns for all
xiii
LIST OF CHARTS
Chart 2.1 Chemical structures of SF-PDI2, FTAZ, and PyCNTAZ... 11
xiv
LIST OF ABBREVIATIONS
BHJ Bulk heterojunction
BnDT Benzo[1,2-b:4,5-b’]dithiophene
CuSCN Copper thiocyanate
CT State Charge transfer state
CV Cyclic voltammetry
ECT Energy of the charge transfer state
EQE External quantum efficiency
ETL Electron transport layer
FF Fill factor
FREA Fused ring electron acceptor
FTAZ 5,6-difluoro-2-alkyl-4,7-di(thiophen-2-yl)-2Hbenzo[d][1,2,3]triazole
GIWAXS Grazing incidence wide-angle X-ray scattering HOMO Highest occupied molecular orbital
HTAZ 2-alkyl-4,7-di(thiophen-2-yl)-2Hbenzo[d][1,2,3]triazole
HTL Hole transport layer
IDTT Indacenodithieno[3,2-b]thiophene
INCN 2-(3-oxo-2,3-dihydroinden-1-ylidene)malonitrile
ITIC 3,9-bis(2-methylene-(3-(1,1-dicyanomethylene)-indanone))- 5,5,11,11-tetrakis(4-hexylphenyl)-dithieno[2,3-d:2’,3’-d’]-s-indaceno[1,2-b:5,6-b’]dithiophene
xv
ITO Indium-doped tin oxide
Jsc Short-circuit current density
LUMO Lowest unoccupied molecular orbital
NFA Non-fullerene acceptor
OPV Organic photovoltaic
PCBM Phenyl-C61-butyric acid methyl ester
PCE Power conversion efficiency
PDI Perylene diimide
PEDOT:PSS Poly(3,4-ethylenedioxythiophene):poly(styrenesulfonate)
PL Photoluminescence
PSC Polymer solar cell
PyCNTAZ 2-alkyl-4,7-di(thiophen-2-yl)-2H-[1,2,3]triazolo[4,5-c]pyridine RSoXS Resonant soft X-ray scattering
SCLC Space charge limited current
SMA Small molecule acceptor
TAZ 2-methyl-2H-benzo[d][1,2,3]triazole
1
CHAPTER 1: INTRODUCTION
1.1 History and Introduction to Organic Photovoltaics
The increasing demand for clean, renewable energy has driven the development of new technologies for solar energy, such as organic photovoltaics (OPVs). OPVs have become a viable alternative to the widely produced silicon technologies due to their advantages such as lower cost and ease of processing. Additionally, OPVs can be semi-transparent and flexible, allowing them to be utilized in a wider variety of potential applications such as wearable electronics and smart windows.
In 1986, one of the first working OPV devices was reported by Tang et al.1The device
utilized a bilayer structure of copper phthalocyanine as the donor material and a perylene diimide derivative as the acceptor material, and obtained a power conversion efficiency (PCE) of ~1%. A few years later, in 1992, Heeger et al. demonstrated ultrafast electron transfer from a conjugated polymer to a fullerene, beginning the era of fullerene-based OPVs.2 Despite the efficient charge transfer in early bilayer devices, low efficiencies were observed due to the limited lifetime and short diffusion length of excitons. To combat this issue, Heeger et al. developed the bulk
heterojunction (BHJ), an interpenetrating network of donor and acceptor domains with nanoscale phase separation that greatly increases the interfacial area between the electron donor and
2
efficiencies compared to those with a bilayer structure, due to improved exciton dissociation and electron transfer in the film.
Figure 1.1 Typical architectures for BHJ-based organic photovoltaics
To improve charge transport and extraction for BHJ solar cells, researchers commonly utilize transport layers in addition to the electrodes and BHJ active layer. These transport layers allow for more selective transport of one charge carrier (electrons or holes) while blocking the other. Typical architectures for BHJ-based OPVs are displayed in Figure 1.1. Both
configurations contain a transparent electrode, often indium-doped tin oxide (ITO), on the side which is irradiated. The conventional device often contains a hole transport layer (HTL) on top of the ITO, followed by the active layer which is composed of a BHJ of the electron donor and acceptor. The device is completed with an electron transport layer (ETL), often made of a low work-function metal such as calcium, and a top electrode generally composed of either
aluminum or silver. The inverted device architecture is similar, but switches the position of the HTL and ETL. In this case, a high work function metal such as MoO3 is often utilized as the
3
order for highly efficient charge transfer to occur, each of these layers needs to have appropriate energy levels and work functions to allow for band alignment and Ohmic contact.
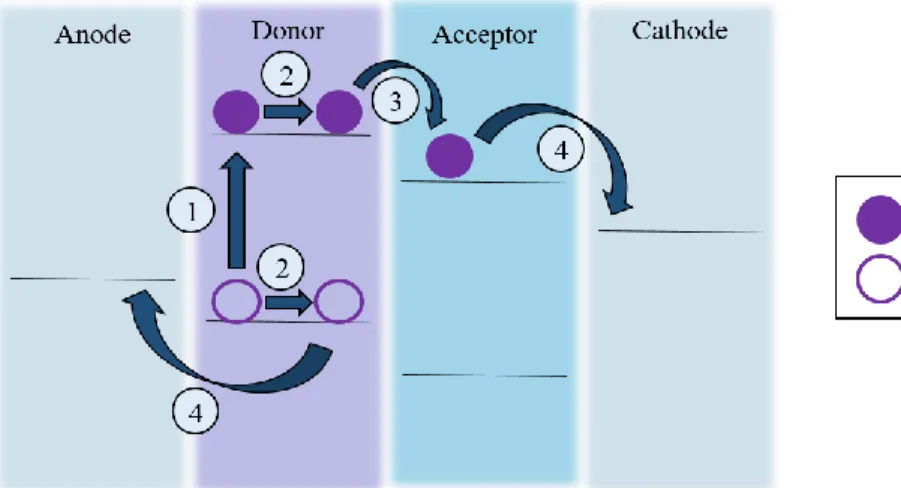
Figure 1.2 The four steps to charge collection in an OPV
Charge collection in an OPV can be split into four main steps: (1) exciton generation, (2) exciton diffusion, (3) charge separation, and (4) charge transport (Figure 1.2). In step (1), photons of appropriate energy are absorbed by the active layer (often by the donor polymer in a fullerene-based OPV) and an electron is excited from the highest occupied molecular orbital (HOMO) level to the lowest unoccupied molecular orbital (LUMO) level, leaving behind a positively charged hole. This electron-hole pair exists as a tightly bound Frenkel exciton due to the low dielectric constant of organic materials.4 In step (2), the exciton diffuses to the donor-acceptor interface in
4
(4), the free charge carriers travel through their respective phases and are collected at the electrodes.
Figure 1.3 Characteristic current density-voltage (J-V) curve for an OPV
In order to judge the efficacy of an OPV, there are three primary parameters to consider: the short-circuit current density (Jsc), open-circuit voltage (Voc), and fill factor (FF) (Figure 1.3).
The Jsc is the maximum current density output from the device, while the Voc is the maximum
voltage. The FF is the ratio between the measured maximum power point (MPP) in the device and the theoretical MPP determined by the product of the Jsc and Voc. The product of these three
parameters divided by the incident power (Pin) gives the power conversion efficiency (PCE), which
is the main figure of merit for OPVs (Equation 1.1).
PCE =𝑉𝑜𝑐 x 𝐽𝑠𝑐 x 𝐹𝐹
5
The Jsc, Voc, and FF are dependent on a variety of intrinsic properties of the donor and acceptor
materials, as well as the device fabrication conditions. For example, the Jsc can be affected by
properties such as the band gap of the materials, light absorption, charge mobility, and active layer thickness, while the FF is dependent on properties such as the charge recombination and morphology. Finally, the Voc is dependent on the energy of the CT state, which is generally
proportional to the difference between the HOMO level of the donor and the LUMO level of the acceptor.
1.2 Donor Polymer Design
While the donor material in an OPV can be either a small molecule or conjugated polymer, this dissertation will only focus on conjugated polymer donors. Over the past years, there has been a lot of research done to better understand the structure-property relationships of conjugated polymers. When designing a conjugated polymer for use in OPVs, there are three main components to consider: the backbone, the side chains, and the substituents. The backbone plays a major role in determining properties such as the energy levels, band gap, and intra- and intermolecular interactions, which are extremely important in determining a polymer’s
performance in an OPV. Side chains are important to consider as well, as they affect the solubility and processability of the polymer, as well as the intermolecular interactions between polymer chains and the interactions between the polymer and the electron acceptor. Lastly, substituents (such as fluorine atoms) can be added along the backbone to fine tune the physical and electronic properties of the polymer.5
6
complex architectures. The majority of polymers designed for OPVs utilize a “donor-acceptor” (D-A) structure, where the repeat unit consists of an electron-rich donor moiety linked to an electron-poor acceptor moiety. This D-A structure promotes increased planarity of the backbone to facilitate internal charge transfer and electron delocalization between the donor and acceptor moieties, which decreases the bandgap and allows for more light absorption. Additionally, D-A polymers typically display localized HOMO and LUMO levels on the donor and acceptor moiety, respectively. By adjusting the electron-donating ability of the donor moiety or the electron-withdrawing ability of the acceptor moiety, the HOMO and LUMO levels of the polymer can be independently tuned. It is important to note that while these polymers have both a donor and acceptor moiety, they are still an electron donor material.
Fluorine is a commonly used substituent to improve the performance of a polymer in an OPV. As Chapters 3 and 4 will focus on the impact of fluorination, we will give a brief
introduction to this “fluorine effect.” Due to its small atomic radius, fluorine can be added along
the polymer backbone to tune the optoelectronic properties without introducing the steric hindrance associated with many other substituents. Additionally, the electron-withdrawing properties of fluorine from its high electronegativity allow it to lower both the HOMO and LUMO levels of a polymer, which can increase the Voc without having a major effect on the
bandgap and the Jsc. Additionally, fluorine can increase the planarity of the backbone through
7
substituents, have a large effect on the performance of the polymer in an OPV. While fluorine substituents do often lead to an improvement in the PCE, there are some instances in which the position or number of the substituents can decrease the performance.6
1.3 Introduction to Non-Fullerene Acceptors
As mentioned above, fullerene and its derivatives were the most commonly used acceptors for OPVs due to their high electron mobility, electron affinity, and ability to form a favorable morphology with a variety of donor polymers. Despite these advantages, however, fullerenes absorb very little visible light and have relatively fixed energy levels, limiting the polymers they can be paired with to form a working device. Additionally, fullerenes tend to aggregate in a thin film over time, causing an unstable morphology that can have a negative effect on the PCE. Recently, non-fullerene acceptors (NFAs) have emerged as a promising alternative to fullerene derivatives as electron acceptors. Although NFAs can be both n-type semiconducting polymer and small molecule acceptors, the term NFA is generally associated with an acceptor-donor-acceptor (A) type fused-ring small molecule acceptor. These A-D-A acceptors may also be referred to as small molecule acceptors (SMA-D-As) or fused ring electron acceptors (FREAs). NFAs allow for easier tuning of optical and electronic properties than fullerene derivatives, and can be matched to a wide variety of donor polymers. NFAs generally have stronger light absorption than fullerenes, allowing them to contribute to exciton generation in a device and increase the Jsc, especially if their absorption is complementary to that of the
8
Early NFAs were comprised of a wide variety of chemical structures, including building blocks such as phthalocyanines and rylenes, among others.7,8 One of the most commonly used
structures was perylene diimide (PDI) due to its high electron mobility, high electron affinity, and variety of sites for functionalization. PDI-based molecules also exhibit a strong tendency for π-π stacking between molecules, which is beneficial for charge transport in an OPV. However, this stacking tendency can also lead to crystallites which are too large for a favorable BHJ morphology, which can hinder exciton dissociation.7 Due to this crystallite formation, designing an efficient
PDI-based NFA is a challenging prospect.
9
CHAPTER 2: COMPARING NON-FULLERENE ACCEPTORS WITH FULLERENE IN POLYMER SOLAR CELLS: A CASE STUDY WITH FTAZ AND PYCNTAZ1
2.1 Introduction
Organic photovoltaics (OPVs) are promising candidates for solar energy applications for reasons including potentially low fabrication cost (from both a processing and a materials’ perspective), light weight, and mechanical flexibility of the devices when compared to silicon solar cells. The most common electron acceptors used in OPVs are fullerene derivatives because of their high electron affinity and relatively high electron mobility.12 Despite these advantages, fullerenes have a number of drawbacks, including difficult synthesis, rather fixed energy levels, and poor light absorption in the visible region. To address these fullerene-associated issues, non-fullerene acceptors (NFAs) have gained significant momentum in recent years, due to their many advantages over traditional fullerenes.13 For example, one can easily tune the optical and
electronic properties of NFAs via molecular design, which could allow for enhanced open-circuit voltage (Voc) from their energy levels matching those of the donor polymer 14,15 and increased
current (Jsc) from their complementary absorption to that of the donor polymer.16,17 Benefitting
from the experiences gained and lessons learned from decades of research on fullerene-based bulk heterojunction (BHJ) systems, the community has made rapid progress in the past two years
1Reprinted with permission from Bauer, N.; Zhang, Q.; Zhao, J.; Ye, L.; Kim, J-H.; Constantinou, I.; Yan, L.; So,
10
with record high efficiency reaching ~12% for NFA-based devices,18,19 on par with the highest efficiency achieved for fullerene blends.20–22
Though a higher Voc is usually obtained for NFA-based organic solar cells than that of
their fullerene-based counterparts, the NFA-based devices often suffer from a noticeably reduced short-circuit current (Jsc) and/or fill factor (FF).23 Since both Jsc and FF are closely related to the
loss mechanisms in photovoltaic devices (e.g., bimolecular recombination),24,25 it is important to understand such loss mechanisms in NFA-based solar cells, ideally in a comparative manner with the corresponding solar cells based on fullerenes. Unfortunately, such studies have only begun to emerge.26,27
We set our study by first choosing SF-PDI2 as the small molecule, non-fullerene electron
acceptor. In a previous study by Zhao et al., SF-PDI2 was paired with the polymer donor
PffBT4T-2DT and achieved a high Voc of 0.98 V in their BHJ devices, leading to a respectable
power conversion efficiency (PCE) of 6.3%.28 We then selected two TAZ-based donor polymers, FTAZ and PyCNTAZ (structures given in Chart 2.1), that have shown impressive device
performance in their BHJ solar cells based on fullerene acceptors.29,30 The first donor polymer, FTAZ, containing a fluorinated benzotriazole as the electron-accepting moiety, was reported by Price et al. in 2011.29 They obtained a relatively high V
oc of 0.79 V with an impressive FF of
72%, giving an overall PCE of over 7%.25,31 The other donor polymer chosen for this work, PyCNTAZ, was introduced by Li et al. in 2015.30 In BHJ solar cells with PCBM, PyCNTAZ displayed a Voc of 0.96 V, higher than that of FTAZ, leading to a higher PCE of 8.37% at an
11
Chart 2.1 Chemical structures of SF-PDI2, FTAZ, and PyCNTAZ
In this study, we aim to directly compare the photovoltaic performance of four BHJ blends based on two acceptors (SF-PDI2 and PC61BM, referred to here as PCBM) and two donor
polymers (FTAZ and PyCNTAZ), and investigate the device physics and morphology to determine the origins of the differences in performance. Notably, for both polymers, the SF-PDI2-based photovoltaic device has a higher Voc than that of the PCBM-based counterpart. This
higher Voc is directly correlated with the higher charge transfer state energy (Ect) of the SF-PDI2
blend, mainly due to the higher-lying lowest unoccupied molecular orbital (LUMO) level of SF-PDI2. However, the SF-PDI2-based device displays a lower FF than that of the PCBM-based
device due to a mobility imbalance and less pure domains. Furthermore, the SF-PDI2-based
device shows a lower Jsc, which can be ascribed to inefficient charge transfer from the donor
polymer to the non-fullerene acceptor (i.e., SF-PDI2) and increased non-geminate recombination
12 2.2 Results and Discussion
2.2.1 Photovoltaic Performance
To investigate the performance differences displayed between devices containing a fullerene and a non-fullerene acceptor, the small molecule acceptor SF-PDI2 was paired with the
donor polymers FTAZ and PyCNTAZ in bulk heterojunction (BHJ) solar cells. Devices were also fabricated using PCBM as the acceptor with both polymers for comparison. A conventional device configuration was used (ITO/HTL/Active Layer/Ca/Al), where the hole transport layer (HTL) was poly(3,4-ethylenedioxythiophene)-poly(styrenesulfonate) (PEDOT:PSS) for FTAZ-based devices and copper thiocyanate (CuSCN) for PyCNTAZ-FTAZ-based devices. Due to the deeper HOMO (highest occupied molecular orbital) level of PyCNTAZ, using CuSCN as HTL can help improve the photovoltaic device performance when compared to PEDOT:PSS as HTL, as we previously demonstrated.30 Active layer thicknesses for all four devices were kept at ~150 nm to minimize thickness effects on performance, and the donor:acceptor (D:A) ratio in the BHJ blend for all devices was 1:2 by weight. The J-V curves are shown in Figure 2.1a and the photovoltaic characteristics are summarized in Table 2.1. For the SF-PDI2 blends, the PyCNTAZ-based
device displays a higher Jsc than the FTAZ-based device, which can be ascribed to less
overlapping/more complementary absorption of PyCNTAZ and SF-PDI2 (Figure 2.1b) and
efficient utilization of both components to generate current. Pleasingly, when compared to the fullerene-based device, the SF-PDI2-based device gives a higher Voc value for both polymers
than the PCBM-based one, i.e., 0.935 V vs. 0.846 V for FTAZ:SF-PDI2 and FTAZ:PCBM,
respectively, and 1.152 V vs. 0.975 V for PyCNTAZ:SF-PDI2 and PyCNTAZ:PCBM,
respectively. However, the SF-PDI2-based device has a lower Jsc and FF than those of the
13
for both polymers. Below, we will discuss each device characteristic in further detail and strive to identify the underlying reasons for the observed trends.
Figure 2.1 a) J-V characteristics of SF-PDI2- and PCBM-based solar cells; b) Normalized
absorption spectra of neat FTAZ, PyCNTAZ, and SF-PDI2 films
Table 2.1 Photovoltaic characteristics of SF-PDI2- and PCBM-based solar cells
Blend Jsc (mA/cm2) Voc (V) FF (%) PCE (%)
FTAZ:SF-PDI2 6.70±0.29 0.935±.005 36.7±1.6 2.30±0.15
FTAZ:PCBM 9.16±0.32 0.846±.007 73.3±2.0 5.68±0.23 PyCNTAZ:SF-PDI2 8.15±0.12 1.152±0.003 46.5±1.3 4.37±0.17
14
2.2.2 Open-Circuit Voltage (Voc)
To determine the cause of the higher Voc for SF-PDI2-based devices, we first considered
the energy levels of the donors and acceptors. Such values can be extracted from previous reports,28–30,32 which are presented in Figure 2.2. It has long been argued that Voc is primarily
proportional to the difference between the LUMO energy level of the acceptor and the HOMO energy level of the donor, if Ohmic contacts are achieved at both cathode and anode interfaces. SF-PDI2 has a higher-lying LUMO level than PCBM, –3.83 eV compared to –4.07
eV, respectively. This difference (~ 0.2 eV) certainly accounts for a higher Voc for both SF-PDI2
-based solar cells; yet the observed Voc difference (~ 0.09 V for FTAZ-based devices and ~ 0.15
V for PyCNTAZ-based devices) needs further investigation (vide infra).
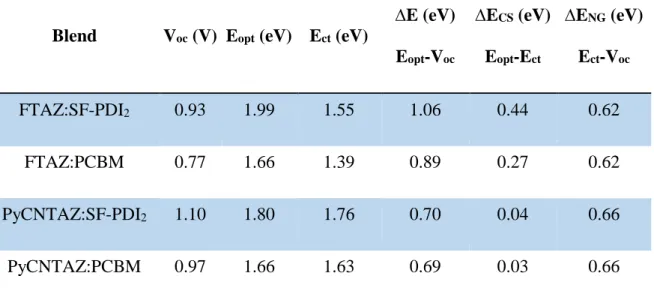
Table 2.2 Voc, ECT, and energetic losses for FTAZ- and PyCNTAZ-based solar cells
Blend Voc (V) Eopt (eV) Ect (eV)
∆E (eV) Eopt-Voc
∆ECS (eV)
Eopt-Ect
∆ENG (eV)
Ect-Voc
FTAZ:SF-PDI2 0.93 1.99 1.55 1.06 0.44 0.62
FTAZ:PCBM 0.77 1.66 1.39 0.89 0.27 0.62
PyCNTAZ:SF-PDI2 1.10 1.80 1.76 0.70 0.04 0.66
15
Figure 2.2 HOMO and LUMO levels of PyCNTAZ, FTAZ, SF-PDI2, and PCBM
Vandewal et al demonstrated that Voc is primarily determined by the interfacial
charge-transfer (CT) states between the donor and the acceptor, with additional loss coming from the radiative emission and non-radiative emission.33,34 Equation 2.1 presents the relationship,
𝑉𝑜𝑐 = 𝑘𝑇
𝑞 𝑙𝑛 ( 𝐽𝑝ℎ
𝐽0 + 1) =
𝐸𝐶𝑇
𝑞 + 𝑘𝑇
𝑞 𝑙𝑛 (
𝐽𝑠𝑐ℎ3𝑐2
𝑓𝑞2𝜋(𝐸𝐶𝑇− 𝜆)) +
𝑘𝑇
𝑞 𝑙𝑛(𝐸𝑄𝐸𝐸𝐿) (2.1)
which can also be re-written as (q is the elementary charge, i.e., e)
𝑒𝑉𝑜𝑐 = 𝐸𝐶𝑇+ 𝑘𝑇𝑙𝑛 ( 𝐽𝑠𝑐ℎ3𝑐2
𝑓𝑞2𝜋(𝐸𝐶𝑇− 𝜆)) + 𝑘𝑇𝑙𝑛(𝐸𝑄𝐸𝐸𝐿) (2.2)
16
energy of the CT state manifold. Unlike a typical inorganic solar cell where there are essentially no CT states (thus ∆𝐸𝐶𝑆 ~ 0), the presence of the CT state manifold constructs a significant channel of energy loss (∆𝐸𝐶𝑆), manifested by the typically observed smaller Voc when compared
with the band gap (i.e., 𝑒𝑉𝑜𝑐 = 𝐸𝑜𝑝𝑡− ∆𝐸𝐶𝑆− ∆𝐸𝑁𝐺). Experimentally, high sensitivity external
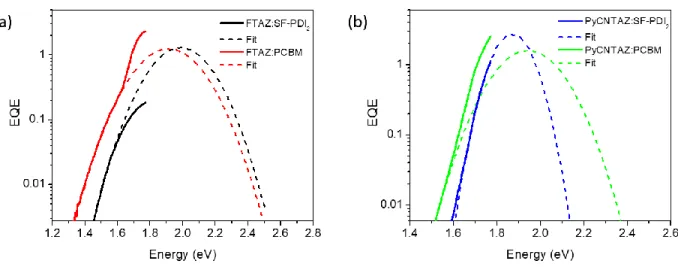
quantum efficiency (EQE) measurements were performed and the resulting spectra (Figure 2.3) were fitted to obtain an estimate for 𝐸𝐶𝑇 (Table 2.2) using Equation 2.3.32
𝐸𝑄𝐸 (𝐸) ∝ 1
𝐸√4𝜋𝜆𝑘𝑇exp (−
(𝐸𝐶𝑇+𝜆−𝐸)2
4𝜆𝑘𝑇 ) (2.3)
With optically determined band gap (𝐸𝑜𝑝𝑡) and measured Voc, the aforementioned ∆𝐸𝐶𝑆 and
∆𝐸𝑁𝐺 can thereby be determined for each blend (Table 2.2).
For both polymers, the difference in 𝐸𝐶𝑇 between the fullerene and non-fullerene device is almost identical to the difference in Voc (numerically), for example, ∆𝐸𝐶𝑇 of 0.15 eV (1.55 –
1.39) vs. ∆𝑉𝑜𝑐 of 0.16 (0.93 – 0.77) for FTAZ. This observation implies that the Voc loss in these
systems is independent of the choice of acceptor (i.e., SF-PDI2 or PCBM). Furthermore, ∆𝐸𝑁𝐺 is
similar for all devices at ~ 0.6 eV, indicating that Voc losses from non-geminate recombination
are also very similar in all four blends. However, while the charge separation energy (∆𝐸𝐶𝑆) for FTAZ-based cells is ‘normal’, 0.27 eV for FTAZ:PCBM and 0.44 eV for FTAZ:SF-PDI2, the
PyCNTAZ-based devices display exceptionally low driving forces (∆𝐸𝐶𝑆) of ~ 0.03 eV for both devices. While not as common, devices that maintain efficient charge separation and high performance but display a low ∆𝐸𝐶𝑆 have been recently reported, interestingly, also for SF-PDI2
17
Figure 2.3 Measured low energy external quantum efficiency (EQE) curves and calculated fittings for a) FTAZ and b) PyCNTAZ based solar cells
2.2.3 Short-Circuit Current (Jsc)
Comparing the Jsc values in Table 2.1 raises one important question we try to answer
with this study: why is Jsc lower in both cases for SF-PDI2-based devices when compared with
PCBM-based devices? In fact, there are multiple possible causes which can occur at various stages of the photovoltaic process (i.e., charge generation, charge transport and charge
collection), to account for a lowered Jsc. For example, insufficient exciton quenching could lead
to insufficient charge generation, and bimolecular recombination could compete with charge transport to the electrode, to name a few.
We first measured the photoluminescence (PL) quenching to study exciton
splitting/charge generation in the BHJ blends, and the data is presented in Figure 2.4. Due to the absorption overlap of SF-PDI2 with the two donor polymers, we chose to use D:A=10:1 to allow
PCBM-18
based blends (for both FTAZ and PyCNTAZ), indicating that there may be an issue with donor to acceptor charge transfer in the SF-PDI2-based systems, especially for PyCNTAZ. Incomplete
charge transfer in the device would decrease the Jsc at the source of charge generation. For the
FTAZ-based blends (Figure 2.4a), the amount of quenching was 82% and 96% for FTAZ:SF-PDI2 and FTAZ:PCBM, respectively, suggesting that the driving force (∆𝐸𝐶𝑆 > 0.2 eV) is large
enough to allow only 10% acceptor to sufficiently quench the PL of FTAZ with either SF-PDI2
or PCBM. On the other hand, for PyCNTAZ-based blends (Figure 2.4b), the amount of
quenching was only 34% and 81% for PyCNTAZ:SF-PDI2 and PyCNTAZ:PCBM, respectively.
It is possible that due to the low driving force (∆𝐸𝐶𝑆 ~ 0 eV) of the PyCNTAZ blends, energy
transfer may also play an important role in the PL quenching, in addition to photo-induced charge transfer. In the PyCNTAZ:PCBM blend, though the driving force is small (∆𝐸𝐶𝑆 ~ 0 eV), PCBM has a smaller band gap and there can be both energy transfer and charge transfer in the PyCNTAZ:PCBM system. Thus, ~ 10% PCBM is still able to quench a much larger degree of the PL of PyCNTAZ (Figure 2.4b). However, in the PyCNTAZ:SF-PDI2 blend, there is
essentially no energy transfer for quenching the PL of PyCNTAZ because the band gap of SF-PDI2 is larger than that of PyCNTAZ; thus, the PL quenching is purely dependent upon the
photo-induced charge transfer for the PyCNTAZ:SF-PDI2 blend, which is not sufficient due to
19
Figure 2.4 Photoluminescence of neat a) FTAZ (excitation at 532 nm) and b) PyCNTAZ (excitation at 618 nm) films and the blend films with SF-PDI2 and PCBM (D:A=10:1)
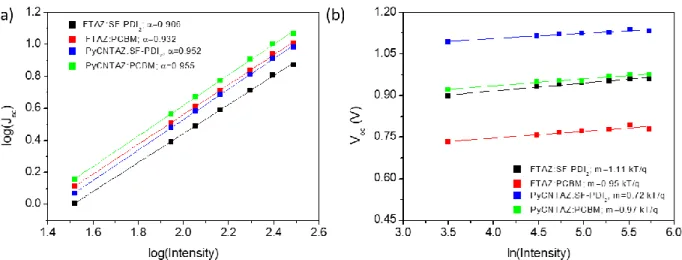
We next attempted to probe the recombination mechanisms occurring in these devices, since the recombination, in particular the bimolecular recombination, is known to have a strong impact on charge transport. To this end, light intensity dependence of Jsc and Voc were measured
for the four devices. On the one hand, Jsc is known to have a power law dependence on light
intensity, following the relation
𝐽𝑠𝑐 ∝ 𝐼𝛼 (2.4)
where I is the light intensity and α is the slope of the log-log plot of Jsc vs intensity.37 An α value
close to unity is indicative of weak bimolecular recombination at short-circuit condition. The log plot of Jsc vs light intensity is displayed in Figure 2.5a. For both polymers, the α value for the
20
recombination would compete with charge extraction and lead to a lower current in the non-fullerene based devices.
On the other hand, when bimolecular recombination is the only loss mechanism, Voc can
be related to light intensity by the following equation
𝑉𝑜𝑐 = 𝐸𝑔𝑎𝑝
𝑞 − 𝑘𝑇
𝑞 ln [
(1−𝑃𝐷)𝛾𝑁𝑐2
𝑃𝐷𝐺 ] (2.5)
where Egap is the HOMODonor – LUMOAcceptor difference, k is the Boltzmann constant, T is the
temperature in Kelvin, q is the elementary charge (i.e., e), PD is the dissociation probability of
electron-hole pairs, γ is the recombination constant, NC is the effective density of states, and G is
the generation rate of bound electron-hole pairs.37 In this equation, G is proportional to the light
intensity, and a semi-log plot of Voc vs light intensity will yield a slope of kT/q if bimolecular
recombination is the sole loss mechanism. Figure 2.5b presents the Voc vs light intensity data for
all four devices. For both polymers, the PCBM-based blends have a slope very close to kT/q, indicating that bimolecular recombination is the major loss mechanism at open-circuit condition in these devices. However, the FTAZ:SF-PDI2 device shows a slope greater than kT/q whereas
PyCNTAZ:SF-PDI2 has a slope less than kT/q. These results indicate that the FTAZ:SF-PDI2
device suffers from a combination of trap-assisted and bimolecular recombination at open-circuit condition,38,39 while PyCNTAZ:SF-PDI2 is mainly affected by surface recombination.40,41 Due to
these additional recombination channels, the number of charges that can successfully traverse the active layer and make it to the electrode will be less for the SF-PDI2-based devices compared to
21
Figure 2.5 Light intensity dependence of a) short-circuit current and b) open-circuit voltage
Lastly, we studied the charge collection by comparing the charge collection probability, 𝑃(𝐸, 𝑇), for all blends. Experimentally, the photocurrent density (Jph) was first measured as a
function of the effective voltage Veff (Figure 2.6a) for each device. Jph is defined as JL-JD, where
JL is the current density under illumination and JD is the current density in the dark, and Veff is
V0-V, where V0 is the voltage at which Jph=0.42,43 The photocurrent density (Jph) was then used to
calculate the charge collection probability, 𝑃(𝐸, 𝑇), for each blend using the equation
𝑃(𝐸, 𝑇) = 𝐽𝑝ℎ
𝐽𝑝ℎ,𝑠𝑎𝑡 (2.6)
where Jph,sat is the saturated photocurrent density in the device.43 At short-circuit condition, the
PCBM-based devices have a higher 𝑃(𝐸, 𝑇) than the non-fullerene devices, 92.4% compared to 73.5% for FTAZ:PCBM and FTAZ:SF-PDI2, respectively, and 89.3% compared to 79.8% for
22
collection process is more efficient in the fullerene devices, which contributes to the higher Jsc of
the fullerene-based devices for both polymers.
Figure 2.6 a) Photocurrent density and b) charge collection probability (P(E,T)) of SF-PDI2- and
PCBM-based solar cells
2.2.4 Fill Factor (FF)
We previously showed that the main reason for the unusually high FF of the FTAZ:PCBM device was the high hole mobility (1.2 × 10⁻³ cm2 V-1 s-1) and the balanced
mobility (i.e., electron mobility on the same order of magnitude, ~ 5 × 10⁻³ cm2 V-1 s-1).25 Indeed, the space-charge limited current (SCLC) mobilities for the PCBM-based devices in this study further confirmed the balanced mobilities (Table 2.3) for both polymers.
However, when switching out PCBM for SF-PDI2, the SF-PDI2-based devices show a large
23
the electron mobility; this large mobility imbalance is likely a major cause of the decreased FF in the SF-PDI2-based devices.
In addition to the mobility imbalance, the SF-PDI2-based devices also display lower
mobilities overall, in particular, for the electrons (on the order of 10-5 cm2 V-1 s-1). This may be due to the morphology of the SF-PDI2-based films, which will be discussed in more detail in the
next section. The low, imbalanced mobilities can lead to a build-up of space charge and exacerbate the charge transport via increased bimolecular recombination. This agrees with the results of the light intensity measurements, which indicate that the SF-PDI2-based devices suffer
from more recombination than the PCBM-based devices. The increased recombination would not only decrease the Jsc as mentioned previously, it would also have a negative effect on the FF for
the non-fullerene based devices.
Table 2.3 Electron and hole mobilities for SF-PDI2- and PCBM-based solar cells
Blend Electron Mobility (cm2 V-1 s-1) Hole Mobility (cm2 V-1 s-1)
FTAZ:SF-PDI2 3.68E-5 ± 7.38E-6 6.35E-4 ± 2.19E-4
FTAZ:PCBM 1.68E-3 ± 5.65E-4 4.23E-3 ± 3.33E-3
PyCNTAZ:SF-PDI2 1.88E-5 ± 2.53E-6 5.04E-4 ± 1.36E-4
24 2.2.5 Morphology
The morphology of BHJ thin films offers important information to further understand the observed photovoltaic behavior of these thin film based devices. To determine the molecular packing within the neat and blend films, grazing incidence wide-angle X-ray scattering (GIWAXS) measurements were performed. The scattering signatures of neat FTAZ and
PyCNTAZ films are very similar, and both exhibit clear (100) peaks at q= 0.3 Å-1 in the in-plane direction and (010) peaks located at q=1.7 Å-1 in the out-of-plane direction (Figure 2.7a-b),
suggesting the polymers have a face-on orientation with respect to the substrate. Such face-on feature was frequently observed before in many high-performance conjugated polymers and considered to be advantageous for hole transport across the active layer.45 As shown in Figure 2.7c, the neat SF-PDI2 film does not display a (010) reflection peak; rather, it shows weak (100)
diffuse rings and an amorphous halo around q=1.3 Å-1 without a clear orientation preference.
25
Shown in Figure 2.8a-d are the 2D GIWAXS patterns of these polymers blended with PCBM or SF-PDI2. The SF-PDI2-based blend films display weak (100) and (010) diffraction
peaks, indicative of poor lamellar packing and π-π stacking. In contrast, the PCBM-based blends
exhibit more clear lamellar (100) and (200) peaks, and (010) peak in the out-of-plane direction in addition to an isotropic ring located at q= 1.35 Å-1, which is originated from pure PCBM
aggregates.46 Comparison of the GIWAXS patterns between fullerene and SF-PDI2-based films
indicates that the PCBM-based films are more ordered, which agrees well with the higher hole/electron mobility observed for these PCBM-based devices (Table 2.3). A higher degree of molecular ordering in the film could afford improved charge transport and thus higher charge mobility, leading to the higher Jsc and FF values measured for the PCBM-based devices.
Figure 2.8 GIWAXS 2D patterns of a) FTAZ:SF-PDI2, b) FTAZ:PCBM, c) PyCNTAZ:SF-PDI2,
26
Resonant soft X-ray scattering (RSoXS) was also utilized to determine the domain spacing and relative average composition variation (ACV) of the four blend films. The Lorentz corrected RSoXS profiles acquired at a photon energy of 283.2 eV are normalized for thickness, contrast, and absorption differences (Figure 2.8e).47 All RSoXS profiles are dominated by a single size distribution and the relative ACV can be extracted via integration of the scattering profiles over the full q-range probed and normalized to the highest ACV assigned a value of 1 (Table 2.4). The relative ACVs are 0.83 and 1 for FTAZ:SF-PDI2 and FTAZ:PCBM,
respectively, and 0.49 and 0.56 for PyCNTAZ:SF-PDI2 and PyCNTAZ:PCBM, respectively.
Generally, higher relative ACV (i.e., more pure domains) is important as impure domains lead to enhanced biomolecular recombination and thus lower device FF in both fullerene and non-fullerene based OPV systems.48,49 In our case study, the highest relative ACV obtained in the FTAZ:PCBM film is quite consistent with its highest device FF up to ~73%. It is clear that the PCBM blends have more pure domains for both polymers, which is another factor contributing to the higher FF of the fullerene devices. The long period (domain spacing) of the SF-PDI2 films
is close to the exciton diffusion length, 25.6 nm for FTAZ:SF-PDI2 and 20.0 nm for
PyCNTAZ:SF-PDI2. Despite having longer long period (49.0 nm for FTAZ:PCBM and 37.7 nm
for PyCNTAZ:PCBM), the PCBM-based devices display higher Jsc and FF values, likely due in
part to the higher charge mobility of these PCBM-based systems, which allows for more efficient charge transport and extraction. As shown in the 12%-efficiency NFA-based devices,49,50 the blend films based on IT-M are more ordered compared with the SF-PDI2 films. We thus
27
Table 2.4 Domain characteristics of the four blend films extracted from RSoXS measurements
Blend Domain Purity Domain Spacing [nm]
FTAZ:SF-PDI2 0.83 25.6
FTAZ:PCBM 1 49.0
PyCNTAZ:SF-PDI2 0.49 20.0
PyCNTAZ:PCBM 0.56 37.7
2.3 Conclusions
Solar cells based on the non-fullerene acceptor SF-PDI2 have a larger Voc than those
based on PCBM, however, they also have a lower Jsc and FF, leading to a decreased overall
power conversion efficiency. The increased Voc in the non-fullerene devices is explained by the
higher-lying LUMO level of SF-PDI2, which increases the HOMODonor – LUMOAcceptor gap, and
more importantly, leads to a higher 𝐸𝐶𝑇 for these devices. In all four devices, the energy loss due
to non-geminate recombination (∆𝐸𝑁𝐺) is very similar (~ 0.6 eV), yet the driving force for charge separation (∆𝐸𝐶𝑆) is exceptionally small (~ 0.03 eV) for the PyCNTAZ-based devices (with either PCBM or SF-PDI2 as the acceptor). This interesting discovery certainly warrants
further investigation. For example, what structural features of molecules would lead to such a low ∆𝐸𝐶𝑆? On the other hand, the SF-PDI2-based devices show insufficient charge generation,
transport and collections, which would explain the low Jsc of these devices. Notably, the light
intensity dependence of Voc and Jsc indicates more recombination loss channels, including
trap-assisted recombination and surface recombination in the SF-PDI2-based devices, in addition to
28
losses would account for the decreased Jsc for the SF-PDI2-based solar cells. Finally, the
SF-PDI2-based devices demonstrate less pure domains, low electron mobilities, and an imbalance in
the electron and hole mobilities, all of which contribute to the observed decrease in FF. In summary, our understanding of the causes of the decreased Jsc and FF generally
observed in non-fullerene acceptor based OPVs, can aid in the design of new non-fullerene acceptors with improved Jsc and FF, while maintaining the potential increase in Voc in these
non-fullerene acceptor based solar cells.
2.4 Experimental 2.4.1 Synthesis
FTAZ,29 PyCNTAZ,30 and SF-PDI228 were synthesized according to literature procedure.
The purity of all synthesized molecular materials were confirmed by NMR analysis.
2.4.2 Device Fabrication
Solar cells were fabricated on glass substrates with patterned indium doped tin oxide (ITO). The ITO substrates were sonicated in deionized water, acetone, and isopropyl alcohol for fifteen minutes each, followed by UV-ozone treatment for 15 minutes. For FTAZ devices, PEDOT:PSS (Clevios PH500 from Heraeus) was spun cast on the cleaned ITO at 4000 rpm for 60 s, then baked at 130°C for fifteen minutes in air. The substrates were then transferred into a nitrogen filled glovebox. For PyCNTAZ devices, CuSCN was dissolved in dipropylsulfide (20 mg/mL) and stirred for 24 h, after which the saturated solution was filtered with a 0.2 μm
29
Donor:acceptor blend solutions were prepared (D:A=1:2, 7 mg/mL polymer for all four solutions) in 1,2,4-trichlorobenzene and stirred at 130°C for 5 h. The solutions were spun cast onto the PEDOT:PSS or CuSCN films for 60 s at the appropriate speed and then dried under vacuum to yield ~150 nm films. The devices were finished by evaporation of 30 nm of calcium and 70 nm of aluminum as the cathode and tested under AM 1.5G irradiation calibrated with an NREL certified standard silicon solar cell. Current density-voltage curves were measured via a Keithley 2400 digital source meter.
2.4.3 SCLC Measurements
Electron and hole mobilities were measured via the space-charge limited current (SCLC) method. Electron-only devices were fabricated with the configuration
ITO/PEI/Donor:Acceptor/Ca/Al, where PEI is polyethyleneimine, used for reducing the work function of ITO.51 Hole-only devices were fabricated with the configuration
ITO/HTL/Donor:Acceptor/MoO3/Al, where the HTL was PEDOT:PSS for FTAZ-based devices
and CuSCN for PyCNTAZ-based devices. The dark current densities were measured with an applied voltage from 0 to 6 V using a Keithley 2400 digital source meter. The applied voltage was corrected from the voltage drop due to series and contact resistance. The Mott-Gurneys law was utilized to extract mobility values:
𝐽 =9
8𝜀𝑟𝜀0𝜇ℎ 𝑉2 𝐿3
where εr is the dielectric constant of the tetramer, ε0 is the permittivity of free space, μh is the
30 2.4.4 Long Wavelength EQE Measurements
Devices for long wavelength EQE measurements were spun cast at University of North Carolina Chapel Hill, and the top contacts were evaporated at North Carolina State University. Active layer thicknesses were ~150 nm for both FTAZ devices and ~120 nm for PyCNTAZ devices. Long wavelength EQE measurements were conducted using an in-house setup consisting of a Xenon DC arc lamp, an ORIEL 74125 monochromator, a Keithley 428 current amplifier, an SR 540 chopper system and a Stanford Research Systems SR830 DSP lock-in amplifier. For the calibration of the spectrum, a Si and a Ge photodiode purchased from Newport Corporation were used as necessary. A 700 nm and 1000 nm long-pass filters were used in order to isolate the desired part of the spectrum for the monitoring of the sub-bandgap response.
2.4.5 Morphology
31
CHAPTER 3: DONOR POLYMER FLUORINATION DOUBLES THE EFFICIENCY IN NON-FULLERENE ORGANIC PHOTOVOLTAICS2
3.1 Introduction
A popular and effective method to improve the power conversion efficiency (PCE) of polymer solar cells (PSCs) is fluorination of the donor polymer.6,56–58 One successful, well-studied example of donor fluorination is the copolymer of benzodithiophene (BnDT) and fluorinated benzotriazole (FTAZ), which was introduced in 2011 by Price et al.29 In that study, the performance of FTAZ in bulk heterojunction (BHJ) devices was compared with that of its non-fluorinated counterpart, HTAZ (Chart 3.1). Price et al. found that fluorination increased the short circuit current (Jsc), open circuit voltage (Voc), and fill factor (FF) of the solar cells, leading
to an overall improvement in PCE from 4.3% to 7.1% for HTAZ and FTAZ, respectively. Later, Li et al. optimized the molecular weight of FTAZ31 and designed a series of BnDT-(X)TAZ polymers with varying amounts of fluorination (from 0 to 100% F) to further investigate the impact of fluorine in this system.25 The authors found that PCE increased as amount of fluorine
increased, due mainly to an increase in FF. Through a comprehensive study of device properties, this increase in FF was attributed solely to an increase in hole mobility with increased
fluorination.25
Recently, non-fullerene acceptors (NFAs) have become more popular as electron acceptors than traditional fullerene derivatives in PSCs.7,8,59 Compared with fullerene
2Reprinted with permission from Bauer, N.; Zhang, Q.; Zhu, J.; Peng, Z.; Yan, L.; Zhu, C.; Ade, H.; Zhan, X.; You,
32
derivatives, NFAs benefit from improved light absorption and easier tuning of optoelectronic properties, allowing for complementary absorption and energy level matching with those of donor polymers to improve Jsc and Voc. Among all NFAs, ITIC (Chart 3.1) and its derivatives
are the most studied and have shown great potential in advancing the efficiency of polymer solar cells. ITIC has an indacenodithieno[3,2-b]thiophene core and 2-(3-oxo-2,3-dihydroinden-1-ylidene)malononitrile end groups, and was first introduced as a NFA by Lin et al. in 2015.10 When ITIC was paired with PTB7-Th, a popular donor polymer, in BHJ solar cells, a PCE of 6.80% was obtained, which was the highest efficiency for NFA-based devices at that time. Since then, ITIC and its derivatives have become commonly used acceptor molecules to reach higher PCEs for PSCs.14,19,68,69,60–67 Just recently, Zhao et al. found that fluorination of the acceptor molecule can also lead to improved PSC performance. They designed a fluorinated ITIC derivative which, when paired with the FTAZ polymer, achieved a PCE of 13.1%, the highest reported efficiency for PSCs to date.70
While there are a few reports of donor polymer fluorination improving efficiency in NFA-based solar cells,17,71 the majority of work on the so-called “F effect” has been focused on fullerene-based systems (e.g., PCBM, Phenyl-C61-butyric acid methyl ester). In this study, we
aim to investigate the impact of donor polymer fluorination in these NFA-based systems, and determine if fluorination has a positive effect on device performance similar to that in fullerene-based devices. To accomplish this, we have fabricated BHJ devices with either non-fluorinated TAZ (i.e., HTAZ) or its fluorinated version (i.e., FTAZ) as the donor polymer and ITIC as the non-fullerene acceptor, as FTAZ has proven to be a good match for ITIC and its derivatives in previous reports.60,61 By studying the photovoltaic and morphological properties of the
33
this NFA-based system due in part to an improved Voc and FF. This result is similar to these
polymers with PCBM29; however, unlike the PCBM-based devices, the increase in efficiency for
the ITIC-based devices was also in large part due to an increase in Jscwith fluorination.
Chart 3.1 Chemical structures of FTAZ, HTAZ, and ITIC
3.2 Results and Discussion
3.2.1 Optical and Electrochemical Properties
We first considered the optical and electronic properties of FTAZ, HTAZ, and ITIC. As displayed in Figure 3.1a, the absorption of both FTAZ and HTAZ is complementary to that of ITIC, which would allow for an improved Jsc compared to fullerene-based devices with these
polymers. The highest occupied molecular orbital (HOMO) levels of the materials were measured via cyclic voltammetry (Figure B1), and the lowest unoccupied molecular orbital (LUMO) levels were calculated using the HOMO level and absorption onset from UV-Vis spectra. The HOMO and LUMO levels of the materials are displayed in Figure 3.1b. As expected, the HOMO level of FTAZ is lowered compared to that of HTAZ, due to the electron-withdrawing nature of the fluorine substituents, which would lead to an increase in Voc for the
34
Figure 3.1 a) Normalized absorption and b) energy levels of FTAZ, HTAZ, and ITIC
3.2.2 Device Performance
To determine the effect of fluorination on photovoltaic performance, bulk heterojunction devices were prepared with a device structure of ITO/ZnO/polymer:ITIC/MoO3/Al, a
polymer:ITIC ratio of 1:1.5 and an active layer thickness of ~90 nm. The photovoltaic
characteristics are given in Table 3.1, with representative J-V curves displayed in Figure 3.2a. As expected, addition of fluorine substituents led to an increase in Voc due to the lower HOMO
level of FTAZ, as Voc is largely correlated to the difference between the HOMO level of the
donor and LUMO of the acceptor. Fluorination also led to a 40% improvement in FF, which is similar to that observed in the fullerene-based devices for these polymers.29 Additionally, the
FTAZ:ITIC device also displayed a large increase in Jsc, with a Jsc 30% higher than that of the
HTAZ:ITIC device. Notably, this improvement in Jsc has not been observed in previously
35
to those obtained when the donor polymer FTAZ was paired with other high-performing, non-fluorinated ITIC derivatives.60,61
In addition to the J-V characteristics, the external quantum efficiency (EQE) of the devices was measured. As shown in Figure 3.2b, both FTAZ:ITIC and HTAZ:ITIC display a broad EQE response with contributions from both the donor and acceptor; however, FTAZ:ITIC has a higher response across the entire spectrum, reaching a maximum of ~70% compared to only ~60% for HTAZ:ITIC. This increase in EQE for FTAZ:ITIC is consistent with the improved Jsc observed in the FTAZ-based device.
Table 3.1 Photovoltaic characteristics of FTAZ:ITIC and HTAZ:ITIC solar cells
Blend Voc (V) Jsc (mA/cm2) FF (%) PCE (%)
FTAZ:ITIC 0.911 ± 0.001 16.25 ± 0.46 56.5 ± 1.5 8.37 ± 0.40
36
Figure 3.2 a) Representative J-V curves and b) EQE spectra of FTAZ:ITIC and HTAZ:ITIC BHJ devices
3.2.3 Device Physics
To further understand the effect of donor polymer fluorination in these devices, we first investigated the cause of the large Jsc increase in the FTAZ:ITIC device. We chose to focus on
the increase in Jsc first rather than the similarly large increase in FF, because the Jsc improvement
was not previously observed in PCBM-based devices with HTAZ and FTAZ. In order to understand this enhancement in Jsc, we needed to consider the various processes involved in
current generation in PSCs. To generate current, an exciton needs to first be formed and subsequently dissociated into free charge carriers at the donor-acceptor (D-A) interface. Then, these free charge carriers need to be transported through the device and extracted at the
electrodes before recombination occurs.
37
both blends. Similarly, both polymers are able to efficiently quench the PL of ITIC, as displayed in Figure 3.3b. The high PL quenching efficiency for all materials suggests efficient exciton dissociation in both the FTAZ- and HTAZ-based devices, likely due to a morphology with small and/or mixed enough domains.
Figure 3.3 Photoluminescence of a) neat FTAZ and HTAZ (excitation at 530 nm) and b) neat ITIC (excitation at 650 nm) and both BHJ blend films
We then considered the recombination mechanisms occurring in the devices, as recombination will compete with charge extraction and lower the current generation. To gain insight into the recombination mechanisms in the FTAZ:ITIC- and HTAZ:ITIC-based devices, we measured the light intensity dependence of both Jsc and Voc (Figure 3.4). Jsc is known to have
a power law dependence on light intensity, and the slope of the Jsc vs intensity log plot will equal
one if there is minimal bimolecular recombination in the device.37 From the log-log plot of Jsc vs
38
signifies there is a small amount of bimolecular recombination for both devices. In a previous study,72 the light intensity dependence of the FTAZ:PCBM-based device was also studied. The
slope of the log-log plot was determined to be 0.93, indicating a slightly lower degree of
bimolecular recombination in the PCBM-based device than the ITIC-based device studied here. The Voc dependence on light intensity is displayed in Figure 3.4b. When bimolecular
recombination is the sole loss mechanism, a plot of Voc vs the natural log of light intensity will
have a slope equal to kT/q.37 Similar to J
sc, the Voc dependence on light intensity shows
comparable slopes for both the FTAZ- and HTAZ-based device, with a slope of 0.91 kT/q and 0.85 kT/q for FTAZ:ITIC and HTAZ:ITIC, respectively. This again indicates a similar degree of recombination in these devices, which decreases the overall current generation for both blends. Additionally, these values suggest that bimolecular recombination is the dominant mechanism in these devices as opposed to monomolecular, as monomolecular recombination will lead to a slope of 2 kT/q in the Voc vs intensity plot.39 The results obtained from the light intensity study
are similar to those obtained by Li et al. in their earlier study,25 where they found that all devices had nearly identical bimolecular recombination coefficients, regardless of fluorination amount. Here, we demonstrate that replacing PCBM with ITIC as the acceptor again leads to a
39
Figure 3.4 Light intensity dependence of a) Jsc and b) Voc for the FTAZ:ITIC and HTAZ:ITIC
devices
After exciton dissociation, the newly generated free charge carriers need to be transported through the device and extracted at the electrodes to generate current. To study the charge
transport in these solar cells, we first measured the charge mobility via the space charge limited current (SCLC) method. The electron and hole mobility values are given in Table 3.2. The device based on fluorinated FTAZ displays a higher electron and hole mobility than that of the device based on non-fluorinated HTAZ. This higher charge mobility would lead to improved charge transport in the FTAZ:ITIC-based device, contributing to the improvement in Jsc and also
40
Table 3.2 Electron and hole mobility values for the FTAZ:ITIC and HTAZ:ITIC devices
Blend Hole Mobility
( × 10-5 cm2 V-1 s-1) ( × 10Electron Mobility -5 cm2 V-1 s-1)
FTAZ:ITIC 9.3 ± 1.4 0.59 ± 0.17
HTAZ:ITIC 1.9 ± 0.6 0.15 ± 0.06
To further understand the charge transport and extraction in these PSCs, we measured the photocurrent and charge collection probability (Figure 3.5). The photocurrent (Jph) is calculated
by subtracting the dark current density (JD) from the current density under illumination (JL). This
value can then be plotted against the effective voltage, Veff, which is found by subtracting the
applied voltage (V) from the compensation voltage (V0) at which Jph is equal to zero.42 The plot
of Jph vs Veff gives insight to the saturated photocurrent, Jph,sat, which is the point at which all free
carriers are extracted to the electrodes with minimal recombination. The saturated photocurrent is independent of the electric field, and affected by both field-independent losses and the optical absorption of the film.43 Figure 3.5a demonstrates that the FTAZ:ITIC-base device has a higher Jph,sat than that of the HTAZ:ITIC-based device, which agrees with the higher Jsc of this device.
This increase in photocurrent could be due in part to the higher absorption of the FTAZ-based blend compared to that of the HTAZ-based one (Figure B2). Additionally, by normalizing the photocurrent with respect to Jph,sat, we are able to calculate the charge collection probability (Pc)
of the devices (Figure 3.5b).43 The FTAZ:ITIC-based device displays a higher Pc than that of the
41
Figure 3.5 a) Photocurrent and b) charge collection probability of the FTAZ:ITIC and HTAZ:ITIC devices
3.2.4 Morphology
42
has already been justified.73,74 The relative composition variations, related to domain purities, are 1 and 0.9 for FTAZ:ITIC and HTAZ:ITIC, respectively (Table 3.3). The more pure domains for the FTAZ:ITIC blend trends with the higher FF observed for its device, as impure domains can lead to increased bimolecular recombination and reduce the FF. Additionally, the FTAZ:ITIC blend has a smaller domain spacing of 50 nm compared to 60 nm for the HTAZ:ITIC one, which is beneficial for charge transport and agrees with the higher Jsc for the FTAZ:ITIC-based
photovoltaic device.
43
Table 3.3 Domain spacing and relative purity for FTAZ:ITIC and HTAZ:ITIC blends from RSoXS data
Blend Domain spacing (nm) Relative Composition Variations
FTAZ:ITIC 50.2 1
HTAZ:ITIC 59.8 0.9
3.3 Conclusions
In summary, with FTAZ/HTAZ as the exemplary conjugated polymers, we show that fluorination of the donor polymer also leads to much improved device performance in solar cells with ITIC as the non-fullerene acceptor, similar to our previous discovery of
fluorination-induced-efficiency enhancement in fullerene (e.g., PCBM)-based devices. The observed increase in Voc with fluorination – in both PCBM-based devices and ITIC-based ones – can be ascribed to
the lower HOMO level of the fluorinated FTAZ compared to its non-fluorinated counterpart HTAZ. Furthermore, the increase of FF by 40% from HTAZ to FTAZ in their ITIC-based devices – also similar to the FF enhancement observed in their PCBM-based devices – can be largely explained by the increased hole mobility with fluorination, as well as the increase in electron mobility. However, a large improvement of 30% was observed for the Jsc, which was
not seen in previous studies of these two polymers in their PCBM-based BHJ solar cells. By studying the various processes involved in current generation in PSCs, we determined that the increase in Jsc for the ITIC-based devices is due to improved charge transport and extraction in
44
electron and hole mobility, as well as a higher saturated photocurrent and charge collection probability for the FTAZ:ITIC-based device.
The results of this study demonstrate that donor polymer fluorination is also a viable method to further increase efficiency in NFA-based PSCs, and may improve performance through different mechanisms than those observed in fullerene-based PSCs. To fully understand the “F effect” in NFA-based solar cells, further study is required utilizing other efficient,
fluorinated donor polymers, such as those recently reported by Zhang et al.75 Additionally, there
have been a few reports demonstrating that fluorination of the non-fullerene acceptor leads to improved device performance61,70, which should also be considered in future studies of the “F effect.”
3.4 Experimental 3.4.1 Device Fabrication
Solar cells were fabricated on glass substrates with patterned indium doped tin oxide (ITO). ITO substrates were cleaned via sonication in deionized water, acetone and isopropyl alcohol for fifteen minutes each, followed by UV-ozone treatment for 15 minutes. The ZnO precursor solution was prepared by dissolving 1 g zinc acetate dihydrate and 0.28 g ethanolamine in 10 mL of 2-methoxyethanol. The solution was stirred overnight, and then spun cast onto the cleaned ITO at 6000 rpm for 60 s, then baked at 200°C for 30 minutes in air. The substrates were then transferred into a nitrogen filled glovebox. Polymer:ITIC solutions (D:A=1:1.5, 6 mg/mL polymer) in chloroform were prepared for both polymers and spun cast at 5000 rpm for 60 s. The solar cells were finished by evaporation of 10 nm MoO3 and 50 nm of aluminum, with a device
45
standard silicon solar cell. Current density-voltage curves were measured via a Keithley 2400 digital source meter.
3.4.2 SCLC Measurements
Electron and hole mobilities were measured via the space-charge limited current (SCLC) method. Electron-only devices were fabricated with the configuration
ITO/ZnO/Polymer:ITIC/Ca/Al, and hole-only devices were also prepared with the configuration ITO/PEDOT:PSS/Polymer:ITIC/MoO3/Al. The dark current densities were measured with an
applied voltage from 0 to 6 V using a Keithley 2400 digital source meter. The applied voltage was corrected from the voltage drop due to series and contact resistance. The Mott-Gurneys law was utilized to extract mobility values:
𝐽 =9
8𝜀𝑟𝜀0𝜇ℎ 𝑉2 𝐿3
where εr is the dielectric constant of the tetramer, ε0 is the permittivity of free space, μh is the
hole mobility, V is the voltage drop across the device, and L is the thickness of the active layer.
3.4.3 Morphology
R-46
SoXS was performed in a transmission geometry with linearly polarized photons under high vacuum (1×10⁻⁷ torr) and a cooled (-45 °C) CCD (Princeton PI-MTE, 2048 pixels×2048 pixels)

![Table 2.4 Domain characteristics of the four blend films extracted from RSoXS measurements Blend Domain Purity Domain Spacing [nm]](https://thumb-us.123doks.com/thumbv2/123dok_us/8327769.2208479/42.918.195.724.152.400/domain-characteristics-extracted-measurements-domain-purity-domain-spacing.webp)


