IJEDR1803064
International Journal of Engineering Development and Research (www.ijedr.org)
359
Intrusion Detection System Based on Principal
Component Analysis and Machine Learning
Techniques
1Nitu Dash, 2Sujata Chakravarty, 3Amiya Kumar Ratha 1Assistant Professor, 2Professor & Senior Member, IEEE, 3Professor
1Regional College of Management, Bhubaneswar, India 2Orissa Engineering College, Bhubaneswar, India 3Veer SurendraSai University of Technology, Burla, India
_____________________________________________________________________________________________________ Abstract - Intrusion is widely recognized as a chronic and recurring problem of computer systems security. Its growth changes continuously with the increasing volume of hacking techniques. In this paper, machine learning has been used to develop an intrusion detection system (IDS) that can effectively distinguish between normal and intrusive traffic. The system explores two different Neural Network techniques i.e. Multilayered Perceptron (MLP) and Radial Basis Function (RBF). The well-known gradient descent Backpropagation learning algorithm optimizes the parameters of the model. NSL KDD dataset is used for experimental work. One of the major problems faced by the researchers to develop IDS is large dimensionality of the datasets. In this study, Principal Component Analysis (PCA) has been used to reduce the curse of dimensionality and increase the computational efficiency. A number of useful performance evaluation measures including accuracy, sensitivity, specificity and confusion matrix are considered to examine the efficiency of the model. The results show that the feature subset obtained from PCA gives a higher detection and accuracy rate with a lower false alarm rate when compared with the obtained results using all features. Secondly, RBF based intrusion detection system gives more accuracy as compared with MLP. Thus, RBFIDS can be effectively used in the real life applications.
Keywords - Intrusion Detection System (IDS); Principal Component Analysis (PCA), Multilayered Perceptron (MLP); Backpropagation Learning algorithm; Radial Basis Function (RBF).
____________________________________________________________________________________________________ I. INTRODUCTION
Communication system plays a vital role in everyone’s life. Growth of computer network and Internet users worldwide have become the best source of information. This have increased networking infrastructure and has led to the development of a variety of network-based applications. Therefore, internetworking security has become a key concern nowadays to protect the information from various network attacks and threats of external and internal attackers [1].
Several tools of security systems exists which protect the attacks such as firewalls, antivirus and data encryption, but still it is difficult to ensure that network will be free of security flaws. Intrusion Detection System has emerged as another technique that have increased the tools of security systems to monitor, identify and detect intrusions with high level of accuracy [2]. Intrusion means to interrupt someone without permission. An intrusion is a set of actions that compromises integrity, confidentiality or availability of a resource [3]. A secure system assures these three security tokens are fulfilled. Intrusion detection is the process of detecting and responding to events that violate the computer security policies and practices. It is a dynamic monitoring system that complements the static monitoring abilities of a firewall. IDS can be a software application or device that identifies inbound and outbound suspicious patterns attempting to break into or compromise a system.
The IDSs are generally classified as shown in the Fig. 1.
Fig. 1Taxonomy of IDS
Intrusion Detection System can be categorized into two groups based on its deployment [4].
IDS Classification
By Deployment
Host-based
IDS
Network
based IDS
By Detection/Analysis
Model
Misuse
Detection
IJEDR1803064
International Journal of Engineering Development and Research (www.ijedr.org)
360
Host-based Intrusion detection system (HIDS) - HIDS are installed as agents on a host computer. It can look into system and application log files to detect any intruder activity. Some HIDS systems are reactive i.e. they inform host only when something wrong is happened. On the other side, some HIDS are proactive in nature i.e. they can sniff the network traffic coming to a particular host on which the HIDS is installed and alert host in real time.Network-based Intrusion detection system (NIDS) – NIDS is an enterprise level security systems focusing on huge network traffics that capture data packets traveling on the network media (Cables, wireless) and perform a matching with database of known intruder signatures. If a packet is matched with an intruder signature, an alert message is generated or the packet is logged to a file or database.
Similarly, on the basis of analysis, IDS can be categorized into two types [5]:
Misuse detection (or Signature based detection): These systems work by matching user activity with stored signatures of known attacks. Such detection systems use a predefined knowledge base to check whether the new network connection is in that knowledge database. If yes, the IDS consider this connection as a possible attack and then block it.
Anomaly detection (or Behavior detection): In this case, the system learns the characteristics of normal user activities. Then it uses those patterns to compare behaviour of running events against learned normal events to identify deviations.
This paper is organized as follows. In section 2, related works are studied. Section 3 proposes the architecture of anomaly detection. Dataset description is given in section 4. Section 5 depicts the pre-processing phase and section 6 explains parameters used for evaluation. Section 7 consists of discussion on Principal Component Analysis algorithm and its role in feature optimization of the dataset. Description of MLP and RBF is given in Section 8. In section 9, performance evaluation and analysis is presented and finally section 10 gives the conclusion.
II. RELATED WORK
In 2007, Panda and Patra [6] proposed a model to detect attacks using Naïve Bayes, and concluded that NB classifier produces better result in terms of detection rate and false positives than back propagation neural network classifier. In 2009, the same authors [7] concluded in another article that NB classifier is better than JRip, Ridor, NNge, Decision Table, and Hybrid Decision Table. In 2009. JingwenTian, Meijuan GAO proposed a system using radial basic function neural network (RBFNN) [8] which implemented least square method to train the network and detect various intrusion behaviours rapidly. In 2009, Tong, X. et.al. [9], proposed a real-time pattern classification using RBF network and memory of past events was restored by Elman network. In 2009 Chen et al. [10] had combined RBFNN with Particle swarm optimization (PSO) algorithm to increase detection rate of NIDS. In 2011, Yuan Liu [11] has proposed a combination of Quantum behave PSO (QPSO) and gradient descent that is used to train the RBFNN. In 2012, Susheel Kumar Tiwari and Mahendra Singh Sisodiai [12] developed a model using Naive Bayes based on K-Means Clustering that shows higher detection rate as compared to single clustering or classification algorithm. In 2012, Roshan Chitrakar and Huang Chuanhe [13] proposed a hybrid approach by combining k-Medoids clustering with Naïve Bayes. In 2012, Koc, Mazzuchi and Sarkani [14] applied a hidden naive Bayes (HNB) classifier to a network intrusion detection system and it extensively improved the accuracy of denial-of-services (DoS) attacks. In 2014, Alazab, Hobbs, Abawajy, Khraisat & Alazab [15] proposed Support vector machine (SVM) with three types of kernel (Linear, polynomial and RBF) to detect unknown attacks.
III.ARCHITECHTURE OF THE PROPSED MODEL
IJEDR1803064
International Journal of Engineering Development and Research (www.ijedr.org)
361
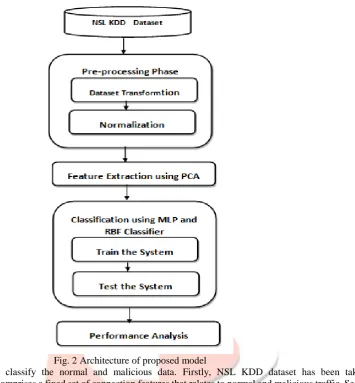
Fig. 2 Architecture of proposed modelFour steps are needed to classify the normal and malicious data. Firstly, NSL KDD dataset has been taken for experimentation. This dataset comprises a fixed set of connection features that relates to normal and malicious traffic. Secondly, in the pre-processing phase, dataset is cleaned, processed and normalized for use as input to the system. Thirdly, these input samples are projected into new feature space using PCA for dimensionality reduction. Fourthly, the system is trained and tested to draw a conclusion whether intrusion have happened or not. Here we have used MLP and RBF Classifier for classification. Finally, the performance of each algorithm is evaluated.
IV.DATASET DESCRIPTION
NSL-KDD dataset has been used to verify the effectiveness and practicability of the proposed IDS system. NSL-KDD is a dataset developed by Tavallaee et al. [16] and is a reduced version of the original KDD 99 [17] dataset. NSL-KDD dataset consists of 41 features and one class attribute. The training dataset consists of 21 different attacks and test dataset have 37 types of attacks. The attack types are grouped into four categories: DoS, Probe, U2R and R2L.
Denial of Service (DoS) attacks: - An attacker tries to prevent valid users from using a service provided by a system by consuming the bandwidth or by overloading computational resources. Smurf, Teardrop, Neptune, pod are the common DoS attacks.
Probe: -Attacker collects information of target system prior to initiating an attack. Portsweep and Satan are the common Probing attacks.
User to root attacks (U2R): -An attacker have access to a local victim host and tries to gain the root privileges of the system. Rootkit and perl is User to Root attacks.
Remote to user attacks (R2L): -An attacker tries to gain access to a victim machine without having an account on it. Guess password, Multihop, Spy are common Remote to User attacks.
Also, it has a reasonable number of training and test instances which makes it practical to run the experiments[18]. Table 1 Distribution of normal and attack traffic instances in NSL-KDD dataset
Dataset Normal DoS Probe R2L U2R Total
KDDTrain+ 67343 45927 11656 995 52 125973
KDDTest+ 9710 7458 2422 2887 67 22544
V. DATA PRE-PROCESSING
IJEDR1803064
International Journal of Engineering Development and Research (www.ijedr.org)
362
Character values of three features i.e. Protocol type, Service and Flag in every packet of NSL KDD dataset is converted to numeric value.b. Normalize numeric values:
The dataset is normalized between a range (0-1) for classification as it produces better accuracy rate. Features having high value range like duration [0 - 58329], num_compromised [0 -884], count [0 - 511], dst_host_count [0 - 255], src_bytes [0 - 693375640], dst_bytes [0 - 5203179] are scaled linearly to the range [0.0, 1.0] by using the Equation 1 [19]:
𝑓 = 𝑓−𝑚𝑖𝑛
𝑚𝑎𝑥−𝑚𝑖𝑛 (1)
Given f= feature value, min=minimum value, max=maximum value of value ranges. VI. EVALUATION MEASURES
Metrics used to evaluate the performance of the models are Classification Accuracy(ACC), Sensitivity or Detection rate (DR) or True positive rate (TPR), Specificity(SPEC) or True negative rate(TNR) and Precision(PR) [20].
a. Classification Accuracy: Accuracy means probability that the algorithms can correctly predict positive and negative instances as well as the number of false alarms.
Accuracy (ACC) = (TP+TN) / (TP+TN+FP+FN) (1)
b.Sensitivity or true positive rate (TPR): It means probability that the algorithms can correctly predict positive (intrusive) instances to the total number of intrusive instances.
Sensitivity or TPR = TP/TP + FN (2)
c. Specificity or (TNR): Itmeans probability that the algorithms can correctly predict negative (normal) instances to the total number of normal instances.
Specificity = TN/TN + FP (3)
d. False positive rate (FPR): FPR is defined as the fraction of negative instances predicted as positive class the model.
FPR = FP / (TN + FP) (4)
e. False negative rate (FNR): FNR is the fraction of positive instances predicted as negative class.
FNR = FN / (TP + FN) (5)
f. Confusion Matrix: The confusion matrix compares the labels of actual class against the predicted ones as shown in Table 2. Thus TNs and TPs predicts correctly while the FNs and FPs predicts incorrectly [21].
Table 2 Confusion matrix for evaluation of attack Class Normal (Prediction) Attack (Prediction)
Normal True Negative (TN) (Good: Correct Detection)
False Positive (FP) (Bad: Incorrect Rejection) Attack False Negative (FN)
(Bad: Incorrect Detection)
True Positive (TP) (Good: Correct Rejection)
VII. FEATURE EXTRACTION USING PRNCIPAL COMPONENT ANALYSIS
Dimensionality reduction is one of the most popular techniques to remove irrelevant and redundant features. This is the prior step before applying a learning algorithm. Attribute space reduction leads to a better model with higher classification accuracy in less time.
PCA is a linear transformation technique. It transforms data in such a way that the first coordinate represents data with highest variance, second coordinate represents data with second highest variance and so on. Therefore, PCA successfully reduces the large dimension of datasets by considering the coordinates having high variance values and ignore the data that has low variance [22].
The PCA Algorithm
STEP 1: Get some data (here NSL KDD dataset) STEP 2: Subtract the mean
𝑋̅ =∑𝑛𝑖=1𝑋𝑖
𝑛 (7)
STEP 3: Calculate the covariance matrix
𝑣𝑎𝑟(𝑋) = ∑𝑛𝑖=1(𝑋𝑖− 𝑋̅)(𝑋𝑖− 𝑋̅)
𝑛−1 (8)
STEP 4: Calculate the Eigen vectors and Eigen values of the covariance matrix
STEP 5: Generate a feature vector by choosing the components whose signal value is more and these features are called principal components.
STEP 6: Get the new data by multiplying the obtained components with the old data.
VIII. METHODOLOGIES
In this section, all the classifier considered in this study are described. a. Multilayer Perceptions (MLP)
IJEDR1803064
International Journal of Engineering Development and Research (www.ijedr.org)
363
algorithm is an iterative gradient descent algorithm developed to minimize the mean square error between the actual and desired output. The main advantages of this method are that they are easy to use, and they can approximate any input/output map.Fig. 3 Architecture of feed forward neural network MLP Algorithm
Step1: Design Network and set parameters Step2: Initialize weights with random values.
For a specified number of training iterations do: For each input and ideal (expected) output pattern
Calculate the actual output from the input Calculate output neurons error
Calculate hidden neurons error
Calculate weights variations (New weight ) Step3: Learn by new weights.
b. Radial Basis Classifier (RBF)
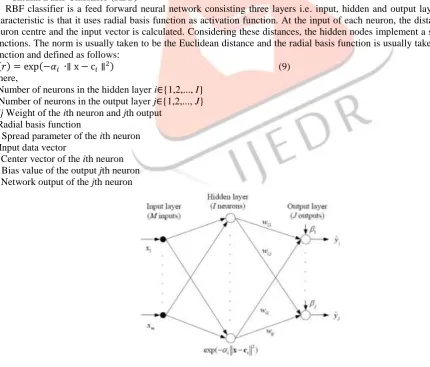
RBF classifier is a feed forward neural network consisting three layers i.e. input, hidden and output layer [24]. Its main characteristic is that it uses radial basis function as activation function. At the input of each neuron, the distance between the neuron centre and the input vector is calculated. Considering these distances, the hidden nodes implement a set of radial basis functions. The norm is usually taken to be the Euclidean distance and the radial basis function is usually taken to be Gaussian function and defined as follows:
∅(𝑟) = exp(−𝛼𝑖 ∙∥ x − c𝑖∥2) (9)
where,
I Number of neurons in the hidden layer i∈{1,2,..., I}
J Number of neurons in the output layer j∈{1,2,..., J}
wij Weight of the ith neuron and jth output φRadial basis function
αi Spread parameter of the ith neuron x Input data vector
ci Center vector of the ith neuron
βj Bias value of the output jth neuron
ŷj Network output of the jth neuron
Fig. 4 Network architecture of RBF
IJEDR1803064
International Journal of Engineering Development and Research (www.ijedr.org)
364
RBF networks possess only one hidden layer that simplifies the design of the network. An RBF network builds the network in incremental way while training by adding one neuron at a time unless a certain MSE (Mean Squared Error) is achieved. IX. EXPERIMENTAL RESULTSIn this paper, NSL KDD 20 % dataset has been considered for experiment. It includes 25192 records. A machine learning tool [26] WEKA 3.7.13 is used to measure the classification performance of MLP and RBF Classifier. 10-fold cross validation has been used for training and testing the system.
Parameters used for MLP are learningRate =0.3; momentum = 0.2; randomSeed = 0; validationThreshold = 20 and the number of epochs used is 500.
Parameters used for RBF are numFunctions=12; tolerance= 1.0E-8; useAttributeWeights=true; ridge = 0.01; useNormalizedBasisFunctions=true.
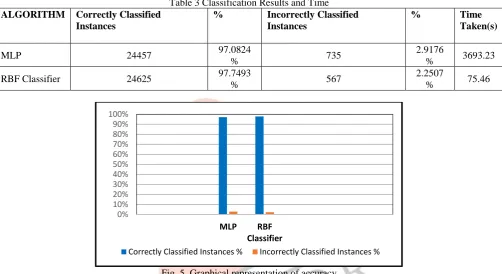
The performance of each algorithm is evaluated after applying cross validation. Following results are given in Table 3 and Figure 5.
Table 3 Classification Results and Time ALGORITHM Correctly Classified
Instances
% Incorrectly Classified Instances
% Time
Taken(s)
MLP 24457 97.0824
% 735
2.9176
% 3693.23
RBF Classifier 24625 97.7493
% 567
2.2507
% 75.46
Fig. 5 Graphical representation of accuracy
To overcome the curse of dimensionality, PCA has been applied as feature reduction method. Parameters selected for PCA are maximumAttributeNames = 5, maximumAttributes = 9, varianceCovered = 0.95
The performance of each algorithm after applying PCA is evaluated and the following results are obtained. Table 4 and Figure 6 validates it.
Table 4 Classification Results and Time after applying PCA ALGORITHM Correctly Classified
Instances
% Incorrectly Classified Instances
% Time
Taken(s)
PCA + MLP 24658 97.8803
% 534
2.1197
% 41.37
PCA + RBF
Classifier 24717 98.1162% 475
1.8838
% 36.28
0% 10% 20% 30% 40% 50% 60% 70% 80% 90% 100%
MLP RBF
Classifier
IJEDR1803064
International Journal of Engineering Development and Research (www.ijedr.org)
365
Fig. 6 Graphical representation of accuracy with PCAThe performance of each algorithm before and after applying PCA is compared and results are shown in table 5 Fig.7. Table 5 Comparative Results of Classification before and after applying PCA
ALGORITHM Correctly Classified Instances
Correctly Classified Instances %
Incorrectly Classified Instances
Incorrectly Classified Instances %
MLP 24457 97.08% 735 2.92%
PCA + MLP 24658 97.88% 534 2.12%
RBF Classifier 24625 97.75% 567 2.25%
PCA + RBF 24717 98.12% 475 1.88%
Fig. 7 Graphical Results of Classification before and after applying PCA
The overall accuracy achieved without attribute selection by MLP and RBF classifiers are 97.0824 % and 97.7493 %. The time consumed to build different model is 3693.23 for MLP and 75.46 for RBF Classifier. Comparing the accuracy and time required to build each model, it can be concluded that RBF classifier gives better performance than MLP.
On the other hand, when PCA feature extraction technique is used, the overall accuracy has improved in less time for all the classifiers. RBF classifier gives better performance i.e. 98.1162% accuracy in 36.28 seconds while MLP accuracy is 97.8803% in 41.37 seconds.
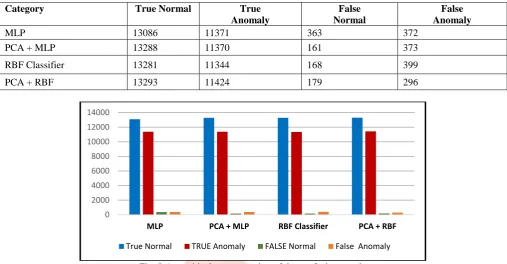
Table 6 summarizes result of both classifiers in confusion matrix format. 0%
10% 20% 30% 40% 50% 60% 70% 80% 90% 100%
Correctly Classified Instances % Incorrectly Classified Instances %
0% 10% 20% 30% 40% 50% 60% 70% 80% 90% 100%
MLP PCA + MLP RBF Classifier PCA + RBF
IJEDR1803064
International Journal of Engineering Development and Research (www.ijedr.org)
366
Table 6 Confusion matrixFig. 8 A graphical representation of the confusion matrix
Fig. 8 describes the correctly classified instances and the incorrectly classified instances of each algorithm. After classification, it is clearly shown that the RBF classifier has higher true normal and true anomaly with less False Normal and False anomaly than MLP.
X. CONCLUSION
Intrusion Detection using machine learning techniques is currently a potential area of research. In this study, two different machine learning techniques, Multilayered Perceptron (MLP) and Radial Basis Function (RBF) are discussed and analyzed to find out a suitable classifier for intrusion detection. NSL KDD dataset has been considered for the experiment. PCA has been used to overcome the problem of high dimensionality of the dataset. Experimental results reveal that Principal Component Analysis proved to be a very efficient technique that can be used for data dimensionality reduction without the loss of the originality of the data set and gives better results. After experimental analysis, it can be established that RBF classifier has higher classification accuracy and lower error rate as compared to MLP. Thus, RBF-IDS can be effectively used for intrusion detection in the real life applications.
Reference
[1]
Richard Power. 1999 CSI/FBI computer crime and security survey. Computer Security Journal, Volume XV (2), 1999.[2]
A. Lazarevic, V. Kumar and J. Srivastava, "Intrusion Detection: A Survey," in Managing Cyber Threats, vol. 5, Springer US, 2005, pp.19-78.[3]
A. Abraham, C. Grosan, C.M. Vide, Evolutionary design of intrusion detection programs, International Journal of Network Security 4 (March (3)) (2007)328–339.[4]
Glenn M. Fung and O. L. Mangasarian, “Multi-category Proximal Support Vector Machine Classifiers”, Springer Science and Business Media, Machine Learning, 59, 77–97, 2005.[5]
Ning, Peng, and Sushil Jajodia. "Intrusion detection techniques." The Internet Encyclopedia 2 (2003): 355-367.[6]
M. Panda, and M. R. Patra, “Network intrusion detection using naïve Bayes,” International Journal of Computer Science and Network Security (IJCSNS), Vol. 7, No. 12, December 2007, pp. 258-263.[7]
M. Panda, and M. R. Patra, “Semi-naïve Bayesian method for network intrusion detection system,” In Proc. of the 16thInternational Conference on Neural Information Processing, December 2009.[8]
Tian, Jingwen, Meijuan Gao, and Fan Zhang. "Network intrusion detection method based on radial basic function neural network." E-Business and Information System Security, 2009. EBISS'09. International Conference on. IEEE, 2009.[9]
Tong, X., Wang, Z., & Yu, H. (2009). A research using hybrid RBF/Elman neural network for intrusion detection system secure model. Computer Physics Communications, 180(10), 1795–1801.[10]
Chen, Zhifeng, and Peide Qian. "Application of PSO-RBF neural network in network intrusion detection." Intelligent Information Technology Application, 2009. IITA 2009. Third International Symposium on. Vol. 1. IEEE, 2009.[11]
Liu, Yuan. "Qpso-optimized rbf neural network for network anomaly detection. “Journal of Information & ComputationalScience 8.9 (2011): 1479-1485. 0
2000 4000 6000 8000 10000 12000 14000
MLP PCA + MLP RBF Classifier PCA + RBF
True Normal TRUE Anomaly FALSE Normal False Anomaly
Category True Normal True
Anomaly
False Normal
False Anomaly
MLP 13086 11371 363 372
PCA + MLP 13288 11370 161 373
RBF Classifier 13281 11344 168 399
![Fig. 1 Taxonomy of IDS Intrusion Detection System can be categorized into two groups based on its deployment [4]](https://thumb-us.123doks.com/thumbv2/123dok_us/8199922.1369641/1.595.120.473.623.775/fig-taxonomy-intrusion-detection-categorized-groups-based-deployment.webp)