M E T H O D O L O G Y
Open Access
Global tests of P-values for multifactor
dimensionality reduction models in selection
of optimal number of target genes
Hongying Dai
1*, Madhusudan Bhandary
2, Mara Becker
3, J Steven Leeder
3, Roger Gaedigk
3and Alison A Motsinger-Reif
4Abstract
Background:Multifactor Dimensionality Reduction (MDR) is a popular and successful data mining method
developed to characterize and detect nonlinear complex gene-gene interactions (epistasis) that are associated with disease susceptibility. Because MDR uses a combinatorial search strategy to detect interaction, several filtration techniques have been developed to remove genes (SNPs) that have no interactive effects prior to analysis. However, the cutoff values implemented for these filtration methods are arbitrary, therefore different choices of cutoff values will lead to different selections of genes (SNPs).
Methods:We suggest incorporating a global test of p-values to filtration procedures to identify the optimal number of genes/SNPs for further MDR analysis and demonstrate this approach using a ReliefF filter technique. We compare the performance of different global testing procedures in this context, including the Kolmogorov-Smirnov test, the inverse chi-square test, the inverse normal test, the logit test, the Wilcoxon test and Tippett’s test.
Additionally we demonstrate the approach on a real data application with a candidate gene study of drug response in Juvenile Idiopathic Arthritis.
Results:Extensive simulation of correlated p-values show that the inverse chi-square test is the most appropriate approach to be incorporated with the screening approach to determine the optimal number of SNPs for the final MDR analysis. The Kolmogorov-Smirnov test has high inflation of Type I errors when p-values are highly correlated or when p-values peak near the center of histogram. Tippett’s test has very low power when the effect size of GxG interactions is small.
Conclusions:The proposed global tests can serve as a screening approach prior to individual tests to prevent false discovery. Strong power in small sample sizes and well controlled Type I error in absence of GxG interactions make global tests highly recommended in epistasis studies.
Keywords:P-value, Global tests, ReliefF, Multifactor dimensionality reduction
Background
Recent advances in genotyping technology have allowed for the rapid and easy interrogation of large numbers of genetic variants for association with common, complex disease. While there have been a number of successes in association mapping studies, the associations found typic-ally explain very little of the overall heritability of the traits
being studied. There are several potential reasons for this “missing heritability”, and one of those potential explana-tions is epistatic interacexplana-tions (gene-gene interacexplana-tions). It is hypothesized that such interactions play an important role in the etiology of complex (non-Mendelian) traits, but detecting such interactions presents a number of statistical and computation challenges [1]. In response to these chal-lenges, a number of new data-mining approaches have been developed [2].
Multifactor Dimensionality Reduction (MDR) is a popu-lar and highly successful statistical method developed to * Correspondence:[email protected]
1
Department of Medical Research, Children’s Mercy Hospital, 2401 Gillham Road, Kansas City, MO 64108, USA
Full list of author information is available at the end of the article
detect and characterize nonlinear complex gene-gene or gene-environment interactions (epistasis) that could be associated with disease susceptibility. The method was first proposed by Ritchie et al. [3] to detect estrogen-metabolism gene interactions associated with sporadic breast cancer. MDR has several advantages over more traditional statistical approaches such as logistic regression modeling: 1) MDR is a non-parametric approach with no requirement to the dis-tribution of data. 2) MDR can analyze non-linear associa-tions in genotypic combinaassocia-tions. 3) MDR has improved power to detect gene-gene interaction in small to moderate sample sizes. Since the introduction of the original MDR implementation, many works have been published to im-prove modeling and prediction accuracy with the MDR method. For more information on the history and develop-ment of the method, please refer to the comprehensive re-view of the MDR and its extended methods by Moore [4].
While the MDR approach is widely used, to make this paper self-contained, we give a brief description of the method. MDR is often applied to genotypic data to detect gene-gene (GxG) interactions among single nucleotide polymorphism (SNP) and the ori-ginal implementation of this method can be extended to detect the interactions in other types of data when the explanatory variables are categorical variables and the outcome variable is binary. As the scale of associ-ation studies has expanded (with larger numbers of SNPs), a filtration step is often implemented in the first step of MDR analysis to remove noisy SNPs. In this step, a subset of genes that are unlikely to inter-act with others is removed by filtration methods such as SURF [5], TuRF [6] etc. ReliefF [7], has become a commonly applied filter, and we will focus on this fil-ter in the current study. Affil-ter this step, the remaining SNPs are used for the dimensionality reduction and model selection steps of the MDR algorithm. In this step, all variable combinations are considered for k-way (k= 2, 3, 4 . . .) interactions. For each multi-locus combination, the ratio of cases to controls within each contingency table cell is calculated, and then each cell is assigned a status of high-risk or low-risk by com-paring this ratio to the ratio of cases: controls in the overall dataset. Cells with a ratio greater than the overall ratio are assigned“high-risk”status, and those with a ratio lower than the overall ratio are assigned “low-risk” status. Subsequently, a balanced classification accuracy is calcu-lated for each multi-locus combination, and the optimal model is selected based on the highest balanced accuracy. This model selection approach is performed in concert with a cross-validation procedure, usually 10-fold, which ran-domly divides the whole data set into a training set and a validation set. The testing accuracy is the balanced accuracy when the classification rule developed from the training data set is applied to the testing data set. The cross
validation count (CVC) summarizes the number of times a model is the top model in each of the cross-validation splits of the data. The optimal k-way (k= 2, 3, 4 . . .) interaction model with the highest training accuracy and the highest CVC is then selected as the winner model. Finally, the sig-nificance of the selected optimal model is assessed by per-mutation testing (comparing the testing/prediction accuracy against the empirical distribution built by at least 1000 permutations). MDR can be performed by an open source software mdr2.0 and model goodness-of-fit and sig-nificance can be assessed using software mdrpt1.0 [8] or in the MDR.R R software package [9].
In this work, we seek to address two existing issues in the current MDR analysis. First, current filtration approaches do not evaluate the significance of the SNPs considered (or provide p-value for their measures) and there is no clear guideline for the cutoff point of such filtration measures. This leads inconsistency in the optimal number of SNPs remaining for the final MDR analysis.
Second, as there is a growing appreciation that the eti-ology of human diseases is extremely complex, many inves-tigators are using MDR to evaluate many potential interactive effects, and not just a single final best model [10]. In this type of approach, not one but numerous tests can be performed in search of an optimal model in thek -way interaction, as the number of partitions fork-way
inter-action over mloci is m
k ¼k!ðmm!kÞ!. For instance, if an
investigator is interested to detect significant 2-way interactions among 50 SNPs, 1225 tests will be performed which will inflate the family-wise Type I error rate
to 1ð1αÞ
m
k ¼1ð10:05Þ1225
1, where α¼0:05 is the nominal error rate for an individual test without proper control.
False discoveries and losing power to detect the signal after the multiplicity adjustment are two concurrent issues in analyzing high dimensional data. Instead of replacing all the existing methods to control the false discovery, we propose to add the global tests to the current MDR frame-work as an ad-hoc screening process to prevent false dis-coveries. We will explain the rationale and utility of global tests in Section Global tests.
Methods Global tests
The idea of global testing is to assess the patterns of p-values from multiple testing ofkway interactions among
mloci (n¼ m
k ¼k!ðmm!kÞ!tests). Under the null hypoth-esis of no GxG interactions, the p-values will follow uni-form (0, 1). To see this, let Tbe the test statistic with the cumulative distribution function (CDF)F0(t)and the inverse CDF F1
0 ð Þt for t2Runder H0. Let P be the p-value
corresponding to the test statistic T. Under H0, we have
PrðP≤pÞ ¼Pr F1
0 ð ÞP ≤F01ð Þp
¼F0 F01ð Þp
¼p for
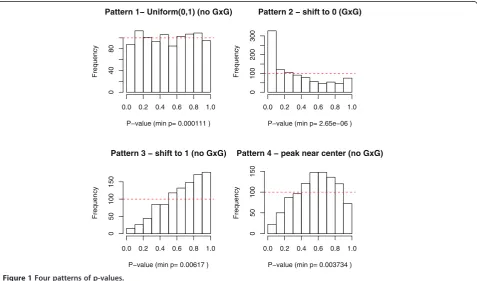
p2ð0;1Þ(Pattern 1 in Figure 1).
When a proportion of m loci have k-way interactions (Hα), it is expected to observe the p-values shifting towards 0. To see this, let F(t) be the CDF under Hα and F tð Þ>
F0ð Þt for t2R, then PrðP≤pÞ ¼Pr F01ð ÞP
≤F01ð ÞÞ ¼p F F1
0 ð Þp
>p for p2ð0;1Þ (Pattern 2 in Figure 1). Due to correlations/linkage disequilibrium among SNPs and the redundancy of SNPs in high order models, sometimes p-values shift toward 1, i.e. PrðP≤pÞ<p for p2ð0;1Þ (Pattern 3 in Figure 1). When p-values are correlated, they might peak near center of histogram (Pattern 4 in Figure 1). Patterns 3 and 4 are deviated from uniformity but they do not indicate potentialk-way interactions amongmloci.
The rationale of global testing is to ensure p-values are not randomly and uniformly distributed (Pattern 1) before we investigate each single p-value. Correlated p-values without significant effects (H0) might even shift toward 1 or peak near the center (Patterns 3 and 4). The goals are to rule out Patterns 1, 3 and 4 and only move forward to the final MDR analysis when p-values are in Pattern 2.
If the entire set of p-value follows a uniform distribu-tion, then it is very likely for a small p-value to be a false discovery by chance. As shown in Figure 1, the entire set of p-values might have four different Patterns: uniform, shifting to 0, shifting to 1 or peak near the center. In all four cases, we notice that the minimum p-values are less than 0.05 (0.0001111 in Pattern 1, 2.65e-6 in Pattern 2, 0.00617 in Pattern 3 and 0.003734 in Pattern 4). If we take the distribution of the entire set of p-values into ac-count, then the minimum p-values in Patterns 1, 3 and 4 are false discoveries by chance.
Combined global testing and filtration technique
A global test will serve as an ad-hoc diagnostic tool to exam all p-values from k-way interactions among m genes in MDR-analysis. These p-values come from empirical distri-butions generated through permutation testing. Let P ¼piði¼1;2;⋯;nÞ be identical and independently
Pattern 1− Uniform(0,1) (no GxG)
P−value (min p= 0.000111 )
Frequency
0.0 0.2 0.4 0.6 0.8 1.0
04
0
8
0
Pattern 2 − shift to 0 (GxG)
P−value (min p= 2.65e−06 )
Frequency
0.0 0.2 0.4 0.6 0.8 1.0
0
100
200
300
Pattern 3 − shift to 1 (no GxG)
P−value (min p= 0.00617 )
Frequency
0.0 0.2 0.4 0.6 0.8 1.0
0
5
0
100
150
Pattern 4 − peak near center (no GxG)
P−value (min p= 0.003734 )
Frequency
0.0 0.2 0.4 0.6 0.8 1.0
0
5
0
100
150
distributed (i.i.d.) p-values from the MDR analysis ofk–way
interactions amongm–loci (n¼ m
k ¼ m
!
k!ðmkÞ!). We will
consider a one-sided test to compare
H0:PeUniformð0;1Þ versus
Ha:PrðP≤pÞ>p for p2ð0;1Þ
8 <
: ð1Þ
Rejecting H0 indicates significant GxG interactions in some target genes.
We propose incorporating global testing of p-values with ReliefF [7] gene filtration technique to detect the patterns ofk-way GxG interaction amongmgenes (SNPs) and re-move noisy genes (SNPs) with little interactive effects to determine the optimal number of SNPs for the final MDR analysis. The ReliefF algorithm estimates weights to meas-ure the potential accuracy of attributes in prediction of phenotype. The redundant attribute will be assigned a lower score. When applied in gene-gene interactions, a higher ReliefF score indicates a stronger interactive effect for the corresponding gene (SNP). ReliefF algorithm first usesx- nearest neighborhood approachðx¼1;2;⋯;mÞto match a selected subject with xsubjects in neighborhood (with shortest distances across all SNPs) from the control group and from test group respectively. An attribute (SNP) will be assigned score 1 (−1) if the attribute from the selected subject matches (mismatches) one of x nearest subjects from the same phenotype group. Similarly, an at-tribute will be assigned score −1 (1) if the attribute from the selected subject matches (mismatches) one of the near-est subjects from the different phenotype group. The score will be aggregated for all subjects and normalized (divided) by the total number of subjects and neighbors. Detailed de-scription of ReliefF algorithm for filtering genotyping data can be found in Section 3 of [4].
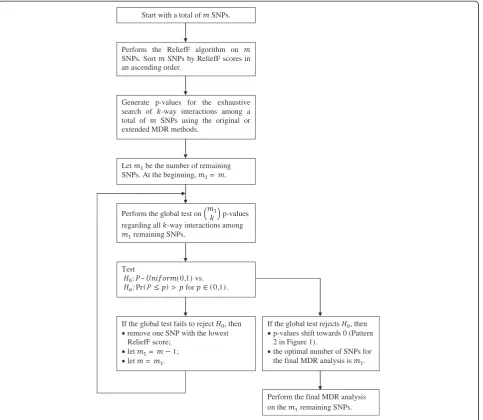
The flow chart of the testing procedure is presented in Figure 2. Starting with a set of m candidate SNPs, per-form the ReliefF algorithm onmSNPs and sort SNPs by ReliefF scores in an ascending order. Generate p-values for the exhaustive search of k-way interactions among a total of m SNPs using the original or extended MDR methods. For eachk-way interaction, one p-value of MDR analysis is generated by permutation test. Let m1 be the
number of remaining SNPs. Perform the global testing on m1
k
p-values. Remove one SNP that has the lowest
ReliefF score and all interactions corresponding to this SNP. Perform the global testing about hypothesis testing (1) on the p-values of the k-way interactions of the remaining SNPs. Continue to remove SNPs with the lowest ReliefF score one by one and perform global testing after each removal of a SNP. One can stop the process when the remaining SNPs reach a predetermined minimum number.
Choose the optimal number of SNPs for the final MDR analysis as the largest number of SNPs with global testing p-value<α. Often we set α¼0:05 . To be more rigorous of controlling family-wise Type I error, one can apply FDR algorithm on the global testing values and the first p-value with FDR<0.05 will determine the optimal number of SNPs.
Global tests of P-values
Here we introduce 6 global tests that can be applied to test hypothesis (1). These six tests are based on different approaches to detect deviation from uniformity. We will survey these methods and compare their power using a case study and Monte-Carlo simulations.
Test 1 one sided Kolmogorov-Smirnov test [KS]
KS test is a non-parametric test that can be applied to compare the distance between an empirical distribu-tion of i.i.d. p-values and Uniform(0, 1). For hypoth-esis test (1), define the one-sided KS statistic as
Dþn ¼ supp 1n
P
i¼1
n
Ifpi≤pgp !
, where Ifpi≤pgis an indicator
function which equals 1 if pi≤pand 0 ifpi>p. According
to [11], the p-value of one-sided KS test follows
nð1tÞ
½ is the largest integer not greater than nð1tÞ andt2ð0;1Þ.
Test 2 one-sided inverse chi-square test [inverse chi]
Test 3 one sided inverse normal test [inverse norm] Transform p-value to normal z score by letting zi¼Φ1ð Þpi where Φ1 is inverse cumulative normal
distribution. Under H0, Z¼
P
i¼1
n zi
!
=pffiffiffineNð0;1Þ. For
one sided test (1), reject H0 if Z<Zα where Zα is
α100%percentile of the standard normal distribution.
Test 4 one sided logit test [logit]
Logit transform p-value by lettingL¼P
i¼1
n
lnðpi=ð1piÞÞ.
[13] shows that under H0, the distribution of L can be Fisher [12] shows that if pii:ei:d:Uniformð0;1Þ for
i¼1;2;⋯;n, then 2P
i¼1
n
lnð Þpi eχ22nwhere χ22nis
chi-square distribution with 2ndegrees of freedom. For a one
sided test (1), reject H0 if 2 P
i¼1
n
lnð Þpi >χ22n;1αwhere
χ2
2n;1αis 1ð αÞ 100%percentile ofχ22n.
PrDþn >t¼ tP
i¼0
nð1tÞ
½
n
i ð1ti=nÞn
closely approximated by Student’s t-distribution with 5nþ4
degrees of freedom, namely L¼L
ffiffiffiffiffiffiffiffiffiffiffiffiffiffiffiffi 3 5ðnþ4Þ
π2nð5nþ2Þ
q
t5nþ4. Therefore, for one-sided test (1), we can reject H0 if L<t5nþ4;αwhere t5nþ4;α is α100% percentile of the t-distribution.
Test 5 one sided Wilcoxon test [Wilcoxon]
Ordernp-values from MDR testing along withn2
obser-vations randomly drawn from Uniform(0,1) from least to greatest and denote them by S1;S2;⋯;SN with
N¼nþn2. LetWbe the sum of the ranks corresponding
tonp-values from MDR testing. For one-sided test (1), we can rejectH0if W≤n Nð þ1Þ ωαwhere the constantωα is chosen to make the Type I error probability equal α. Values of ωα are given in Table A6 by [14]. For large
sample sizes, i.e. min(n,n2) going to infinity, one can apply normal approximation on the standardizedW.
Test 6 Tippett and Wilkinson’s test [Tippett]
Tippett’s Test [15] is based on the property of the min-imal p-value in multiple testing. Let pð Þ1;pð Þ2;⋯;pð Þn be
the ordered p-values in an ascending order. When p-values identically and independently follow Uniform (0,1) distribution, Tippett’s test will reject H0 if pð Þ1 <1ð1αÞ1=n. The p-value of Tippett’s test equals 11pð Þ1n. Tippett’s test is very easy to perform but it only takes the smallest p-value into account.
Wilkinson [16] extended Tippett’s procedure to therth smallest p-values where r¼1;2;⋯;n. By expanding
αþð1αÞ
ð Þn, Wilkinson tabulated the probability,
Start with a total of SNPs.
Perform the ReliefF algorithm on SNPs. Sort SNPs by ReliefF scores in an ascending order.
Let be the number of remaining SNPs. At the beginning, = .
Perform the global test on p-values regarding all -way interactions among
remaining SNPs.
Test
: ~ (0,1) vs. : Pr( ) > for (0,1).
If the global test fails to reject , then remove one SNP with the lowest ReliefF score;
let = 1; let = .
If the global test rejects , then p-values shift towards 0 (Pattern 2 in Figure 1).
the optimal number of SNPs for the final MDR analysis is .
Perform the final MDR analysis on the remaining SNPs. Generate p-values for the exhaustive
search of -way interactions among a total of SNPs using the original or extended MDR methods.
denoted by Cγ,α of obtaining r significant statistics by
chance in a group of n tests. Suppose there are r tests with p-values less than α, Wilkinson’s test rejects H0 if cr;α<α[17]. BecauseP(r)has been distributed with
para-meters r and n-r + 1, tables of the incomplete beta func-tion can be used to obtain critical values of P(r)directly.
In our work, we will not include Wilkinson’s test in case study and power simulation because this method does not provide p-value for the testing results.
Case study
We used a real dataset to illustrate how to apply our pro-posed global testing to prevent false discovery and to deter-mine the optimal number of SNPs for the final MDR analysis. Juvenile Idiopathic Arthritis (JIA) is one of the most common chronic diseases of childhood, affecting an estimated 300,000 children in the U.S. alone, and is an im-portant cause of morbidity and disability in children [18]. Although methotrexate (MTX) is the most commonly used second-line agent used to treat JIA worldwide, this antifo-late drug has shown considerable inter-individual variability in clinical response and adverse reactions [19]. The polyglu-tamation of methotrexate (MTXglu) is an intracellular mechanism that retains the drug and enhances target en-zyme inhibition within the folate pathway [20], and high concentrations of“long chain”methotrexate polyglutamates (MTXglu3-5) have been associated with improved response to the drug in adults with rheumatoid arthritis [21]. Studies have reported the extensive variability in intracellular MTXglu concentrations in JIA, and an association of long chain MTXglu with toxicity (but not efficacy) in children [22]. Due to the complexity of the folate cycle as well as the extensive variability in response to the drug in clinical prac-tice, it is hypothesized that genetic factors may contribute to differences seen in distinct patterns of MTXglu concen-trations intracellularly, which might further impact patients’ responses to MTX.
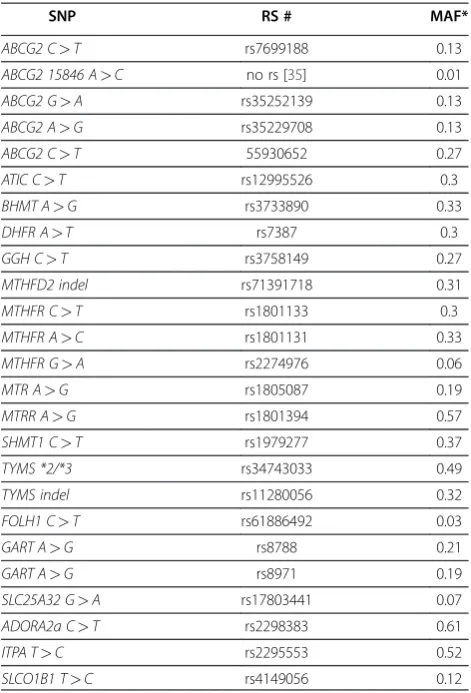
In this case study, we analyzed 25 SNPs from 17 can-didate genes in the folate pathway (Table 1). MTXglu was measured in all patients after at least 3 months on stable MTX therapy and a range of 1 to 5 glutamate moi-eties were reported as a percentage of the total polygluta-mate concentration (MTXglun%). Hierarchical clustering was performed to identify patterns of MTXglun%, and two clusters were determined based on the hierarchical cluster-ing of normalized MTXglu1-5%. Subjects in cluster 1 had lower concentration of short chain polyglutamates (MTXglu1-2%) and higher concentration of long chain polyglutamates (MTXglu3-5%) as compared to subjects in cluster 2 (p<0.05). These clusters reflected distinct patterns in the proportion of MTXglu concentrations.
There were 30 subjects in Cluster 1 and 74 subjects in Cluster 2. The MTXglu clustering phenotype was coded 1
and 0 for MDR analysis. Genotypes, coded 0 for common homozygote, 1 for heterozygote and 2 for rare homozygote for 25 SNPs, were measured. The overall goal of the ana-lysis was to assess whether interactions among SNPs are associated with MTXglu clustering. While the scale of this study is not so large that an exhaustive search of all SNPs is computationally limited, this data is used to demonstrate the proposed approach.
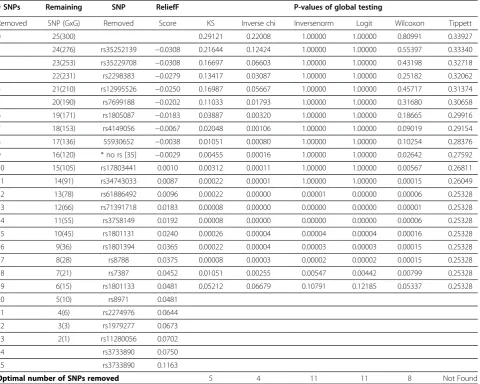
For illustrative purposes, we will focus on 2-way inter-actions among 25 SNPs and will determine the optimal number of targeted SNPs for testing 2-way interactions. We first applied the ReliefF algorithm to 25 SNPs. As shown in Table 2, ReliefF scores ranged from−0.0308 to 0.1163. Although a higher score indicates stronger inter-action with other SNPs, there is no clear cutoff point for ReliefF scores.
To circumvent this limitation, we incorporated global testing of p-values and ReliefF algorithm using the method proposed in Section Combined global testing and filtration technique. We first generated p-values for Table 1 List of 25 SNPs from 17 candidate genes in the folate pathway
SNP RS # MAF*
ABCG2 C>T rs7699188 0.13
ABCG2 15846 A>C no rs [35] 0.01
ABCG2 G>A rs35252139 0.13
ABCG2 A>G rs35229708 0.13
ABCG2 C>T 55930652 0.27
ATIC C>T rs12995526 0.3
BHMT A>G rs3733890 0.33
DHFR A>T rs7387 0.3
GGH C>T rs3758149 0.27
MTHFD2 indel rs71391718 0.31
MTHFR C>T rs1801133 0.3
MTHFR A>C rs1801131 0.33
MTHFR G>A rs2274976 0.06
MTR A>G rs1805087 0.19
MTRR A>G rs1801394 0.57
SHMT1 C>T rs1979277 0.37
TYMS *2/*3 rs34743033 0.49
TYMS indel rs11280056 0.32
FOLH1 C>T rs61886492 0.03
GART A>G rs8788 0.21
GART A>G rs8971 0.19
SLC25A32 G>A rs17803441 0.07
ADORA2a C>T rs2298383 0.61
ITPA T>C rs2295553 0.52
SLCO1B1 T>C rs4149056 0.12
all 2-way interactions among 25 SNPs through per-mutation testing. Then we applied global testing, in-cluding KS test, Inverse chi test, Inverse norm test, Logit test, Wilcoxon test and Tippett’s tests on
25 2
¼300 p-values of 2-way interactions among 25
SNPs. The global tests were performed to evaluate whether the distribution of p-values deviated from uniformity (null hypothesis) and shifted towards 0 (alternative hypothesis -Pattern 2 in Figure 1). Then we removed one SNP with the lowest ReliefF score step by step and repeated the global testing process until only 5 SNPs were remained. We stopped the global testing procedure at 5 SNPs because it is not meaningful or necessary to perform global testing when the number of SNPs is less than 5 in any case study.
The entire procedure of filtration and global testing of p-values are summarized in Table 2. The optimal number of SNPs is the largest number of SNPs with global testing
p-value<0.05. In this case study, KS test and Inverse chi test were more sensitive to deviation from uniformity as the tests became significant after 5 and 4 SNPs removed respectively (Table 2). Inverse norm test and Logit test were more conservative, suggesting removal of 11 SNPs. Wilcoxon test, removing 8 SNPs, was moderate as compared to the other tests. Tippett’s test failed to detect significant GxG interactions with all FDR corrected p-values>0.05. Our fur-ther simulation studies (discussed in Section Power simula-tion) indicate that Tippett’s test, which only takes the smallest p-value into account, might not be appropriate for global testing of p-values.
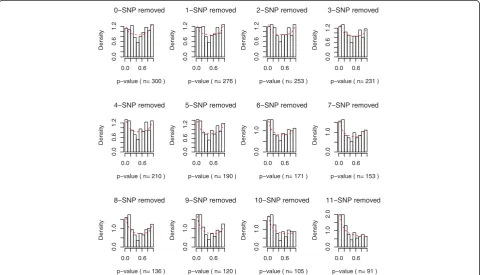
Figure 3 and 4 both revealed strong patterns of transi-tion when noisy SNPs were removed. In Figure 3, as SNPs with low ReliefF scores were removed sequentially, the histogram of p-values started to shift toward 0. Also in Figure 4, the global test p-values were in decreasing trends when noisy SNPs were removed one by one. Table 2 FDR adjusted P-value in global testing
# SNPs Remaining SNP ReliefF P-values of global testing
Removed SNP (GxG) Removed Score KS Inverse chi Inversenorm Logit Wilcoxon Tippett
0 25(300) 0.29121 0.22008 1.00000 1.00000 0.80991 0.33927
1 24(276) rs35252139 −0.0308 0.21644 0.12424 1.00000 1.00000 0.55397 0.33340
2 23(253) rs35229708 −0.0308 0.16697 0.06603 1.00000 1.00000 0.43198 0.32718
3 22(231) rs2298383 −0.0279 0.13417 0.03087 1.00000 1.00000 0.25182 0.32062
4 21(210) rs12995526 −0.0250 0.16987 0.05667 1.00000 1.00000 0.45717 0.31374
5 20(190) rs7699188 −0.0202 0.11033 0.01793 1.00000 1.00000 0.31680 0.30658
6 19(171) rs1805087 −0.0183 0.03887 0.00320 1.00000 1.00000 0.18665 0.29916
7 18(153) rs4149056 −0.0067 0.02048 0.00106 1.00000 1.00000 0.09019 0.29154
8 17(136) 55930652 −0.0038 0.01051 0.00080 1.00000 1.00000 0.10254 0.28376
9 16(120) * no rs [35] −0.0029 0.00455 0.00016 1.00000 1.00000 0.02642 0.27592
10 15(105) rs17803441 0.0010 0.00312 0.00011 1.00000 1.00000 0.00567 0.26811
11 14(91) rs34743033 0.0087 0.00022 0.00001 1.00000 1.00000 0.00015 0.26049
12 13(78) rs61886492 0.0096 0.00022 0.00000 0.00001 0.00000 0.00006 0.25328
13 12(66) rs71391718 0.0183 0.00008 0.00000 0.00000 0.00000 0.00001 0.25328
14 11(55) rs3758149 0.0192 0.00008 0.00000 0.00000 0.00000 0.00006 0.25328
15 10(45) rs1801131 0.0240 0.00026 0.00004 0.00004 0.00004 0.00016 0.25328
16 9(36) rs1801394 0.0365 0.00022 0.00004 0.00003 0.00003 0.00015 0.25328
17 8(28) rs8788 0.0375 0.00008 0.00003 0.00002 0.00002 0.00015 0.25328
18 7(21) rs7387 0.0452 0.01051 0.00255 0.00547 0.00442 0.00799 0.25328
19 6(15) rs1801133 0.0481 0.05212 0.06679 0.10791 0.12185 0.05337 0.25328
20 5(10) rs8971 0.0481
21 4(6) rs2274976 0.0644
22 3(3) rs1979277 0.0673
23 2(1) rs11280056 0.0702
24 rs3733890 0.0750
25 rs3733890 0.1163
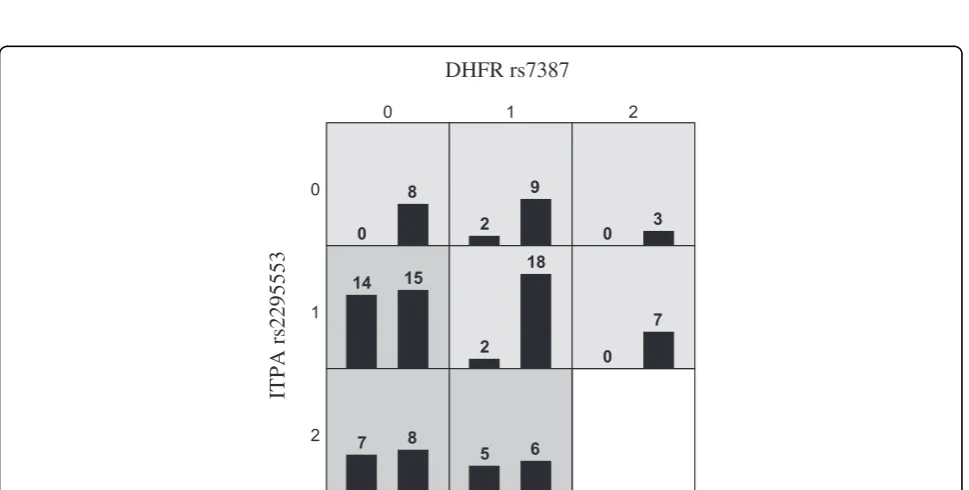
Once the p-value of global testing was under 0.05, it continued to stay under 0.05. There were only a few exceptions at the end of the filtration procedure, prob-ably due to smaller sample sizes and reduction of power. After the filtration and global testing, we removed 4 SNPs as suggested by Inverse chi test with FDR correction (Table 2) and performed MDR analysis on the remaining 21 SNPs. The results of MDR analysis indicated that there was significant two-way interaction betweenDHFR(rs7387) and ITPA (rs2295553) with testing balance accuracy = 0.7374 (p = 0.0045). The MDR analysis was performed by an open source software mdr2.0 and model goodness-of-fit and sig-nificance was assessed by permutation using software mdrpt1.0 [8].
The dihydrofolate reductase (DHFR) enzyme is a well known important target of MTX action. When DHFR is inhibited by MTX the subsequent production of reduced folates such as tetrahydrofolate (THF) 5,10 methenyl-THF and 5-methyl-THF are altered, affecting not only total cel-lular folate concentrations but also the downstream effects from one carbon donation including homocysteine remethylation and pyrimidine and purine synthesis thought to result in an anti-proliferative effect [23]. The in-hibition ofDHFRalso results in a buildup of the precursor dihydrofolate (DHF) which in its polyglutamated state has inhibitory effects upon enzymes within the pathway as well [24]. Inosine triphosphate pyrophosphatase (ITPA) plays a
role in de novo purine synthesis, and is closely related to adenosine metabolism, which is thought to contribute to MTX response via its anti-inflammatory effect [25]. Varia-tions in ITPA interestingly have been shown by other authors to contribute to MTX response as part of a candi-date gene study in JIA [26], as well as“predisposing genetic attribute”in studies utilizing MDR in adults with rheuma-toid arthritis [27,28]. How these 2 genes directly affect MTXglu patterns remains difficult to determine, as the dir-ect understanding of how MTXglu patterns are associated with response is yet to be elucidated. However, both genes encode enzymes closely linked to or directly affected by MTX, thus as we gain a more detailed knowledge of cellu-lar folate metabolism and its disruption by anti-folate agents such as MTX, we will then develop a better under-standing of this complex system, and how alterations in the folate pathway affect response to the drug.
Power simulation
In the two empirical studies described below, we investi-gate the performance of 6 global testing when p-values ex-hibit different patterns (Figure 1) of variation. Data were generated from the Uniform distribution or varying mix-tures of Beta distributions based on the inference regarding the patterns of p-values as described in Section Global tests and Figure 1. Here we give the rationale of using uniform or beta mixture to simulate p-values under null and
0−SNP removed
p−value ( n= 300 )
Density
0.0 0.6
0.0
0.6
1.2
1−SNP removed
p−value ( n= 276 )
Density
0.0 0.6
0.0
0.6
1.2
2−SNP removed
p−value ( n= 253 )
Density
0.0 0.6
0.0
0.6
1.2
3−SNP removed
p−value ( n= 231 )
Density
0.0 0.6
0.0
0.6
1.2
4−SNP removed
p−value ( n= 210 )
Density
0.0 0.6
0.0
0.6
1.2
5−SNP removed
p−value ( n= 190 )
Density
0.0 0.6
0.0
0.6
1.2
6−SNP removed
p−value ( n= 171 )
Density
0.0 0.6
0.0
1.0
7−SNP removed
p−value ( n= 153 )
Density
0.0 0.6
0.0
1.0
8−SNP removed
p−value ( n= 136 )
Density
0.0 0.6
0.0
1
.0
9−SNP removed
p−value ( n= 120 )
Density
0.0 0.6
0.0
1
.0
10−SNP removed
p−value ( n= 105 )
Density
0.0 0.6
0.0
1
.0
11−SNP removed
p−value ( n= 91 )
Density
0.0 0.6
0.0
1
.0
2.0
10 15
0.0
0.4
0.8
KS Test
Number of SNPs Removed
P−value
10 15
0.0
0.4
0.8
Inverse Chi Test
Number of SNPs Removed
P−value
10 15
0.0
0.4
0.8
Inverse Norm Test
Number of SNPs Removed
P−value
10 15
0.0
0.4
0.8
Logit Test
Number of SNPs Removed
P−value
10 15
0.0
0.4
0.8
Wilcoxon Test
Number of SNPs Removed
P−value
0 5 0 5
0 5 0 5
0 5 0 5 10 15
0.0
0.4
0.8
Tippett Test
Number of SNPs Removed
P−value
Figure 4Global Testing of p-values combined with filtration technique (The red line is at nominal rate 0.05.The optimal number of genes is determined when the global test first has p-value<0.05).
ITPA rs2295553
DHFR rs7387
Figure 5Gene to gene interaction detected by MDR after filtering out 6 SNPs according to the one sided inverse chi-square test.
(The distribution of MTXglu clustering among genotypic combinations between DHFR-rs7387 and ITPA-rs2295553 is listed. The genotype for DHFR-rs7387 and ITPA-rs2295553 is coded as 0-homozygote, 1-heterozygote and 2-rare homozygote. In each cell, the first column stands for the number of subjects in cluster 1 (low concentration of MTXglu1-2% and high concentration of MTXglu3-4%) and the second column stands for the
number of subjects in cluster 2(high concentration of MTXglu1-2% and low concentration of MTXglu3-5%.Genotypic combinations in relatively
alternative hypotheses. Under the null hypothesis of no GxG interactions, we have proved that p-values follow Uniform(0,1) distribution (Pattern 1). When this null hy-pothesis is violated, we introduce a latent variable to indi-cate the status of underlying hypothesis for each test. For pi;i¼1;2;⋯;n, introduce a latent variable Zi where for
hypothesis testing (1), we have
Zi¼0if H0:no GxG for the ithtest Patternð 1;PrðP≤pÞ ¼pÞ
Zi¼1if Ha:GxG for the ithtest Patternð 2;PrðP≤pÞ>pÞ;
ð2Þ
for p2ð0;1Þ. The proportion of tests where Hα holds is denoted by the mixing weight PrðZi¼1Þ ¼π where π2ð0;1Þ.
Conditioning onZi, we have
pijZi¼0eUniformð0;1Þ
pijZi¼1eBeta að ;bÞwhere a>0and b>0;ða;bÞ 6¼ð1;1Þ:
ð3Þ
The marginal distribution of combined p-values becomes Peð1πÞUniformð0;1Þ þπBeta a;bð Þ , which indicates that with 1ð πÞ 100% of chance, a p-value is drawn fromUniform(0,1) and withπ100%of chance, a p-value is drawn fromBeta(α,b). Beta distribution is very flexible to characterize the patterns of p-values (Figure 1) where Uniform (0,1) is a special case of Beta (1,1). One can also adjust the shape and scale parametersaandbto model the deviation from uniformity.
The p-values from MDR analysis are correlated due to linkage disequilibrium among SNPs and sharing the SNPs among GxG interactions. The dependence among p-values might cause inflation of Type I errors or lead to bias in glo-bal tests. As a result, it is critical to extensively simulate p-values with varying correlation structures and assess the robustness of global tests for correlated p-values. In this work, we simulated correlated Uniform variables with random correlation matrixΣ and Beta random variables with correl-ation coefficient ρ¼0:2;0:8;Betað2;5Þ;Uniformð0:1;0:9Þ respectively. The details of generating correlated uniform [29] and beta distributions [30] are summarized in Appendix 1.
The first simulation study concerns the Type I error of global testing when there does not exist any GxG interac-tions among genes (SNPs). We generated p-values from
Independent Uniform(0,1), CorrelatedUniformð0;1Þ,
Correlated0:9Uniformð0;1Þ þ0:1Betað5;1Þ, (4.1) Correlated0:5Uniformð0;1Þ þ0:5Betað5;1Þ, (4.2) Correlated0:9Uniformð0;1Þ þ0:1Betað6;3Þ, (4.3) Correlated0:5Uniformð0;1Þ þ0:5Betað6;3Þ. (4.4)
These six scenarios cover Patterns 1, 3 and 4 with no signs of GxG interactions in Figure 1. For each simulation, the sample size of p-values varies from 20 to 500 and we
performed global tests on each sample of p-values. We repeated the process 1000 times, and calculate the percent-age of rejection of null hypothesis for each test. Under the hypothesis of no GxG interaction, this rejection rate is con-sidered as Type I error. As shown in Table 3, the Type I error rates are well controlled to be near or under the nom-inal rate 0.05 when p-values are i.i.d Uniform(0,1). When p-values are correlated Uniform with random correlation matrices, there was slight inflation in five global tests except Tippett’s test. It is good to notice that the inflation is not se-vere as most tests have Type I error rates under 0.07. Such mild inflation is acceptable in screening testing and we will discuss how to further address this issue in Discussion Section.
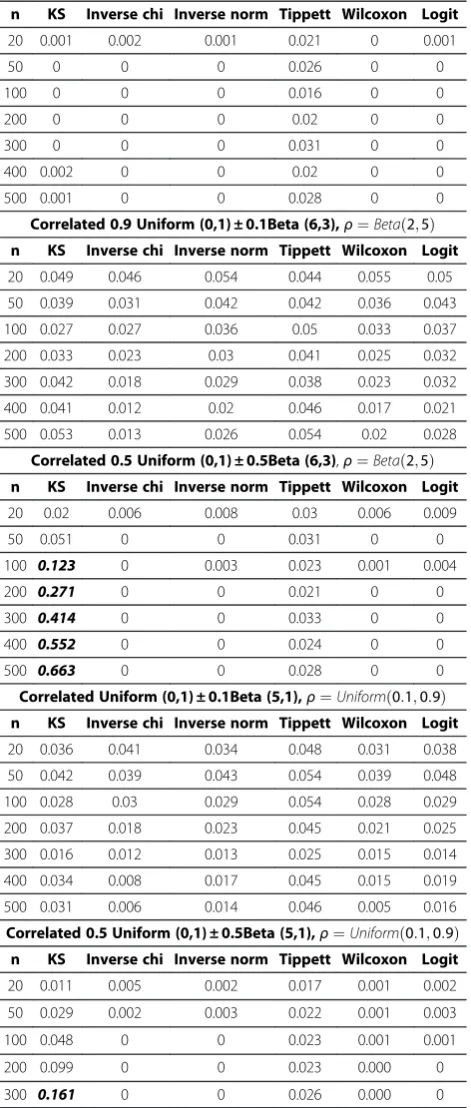
In addition to Uniform distributions, we also simulated correlated Beta mixtures in formula (4.1)-(4.4) regarding p-values shifting to 1 or peaking near the center (Patterns 3 and 4). We conservatively set correlation coefficient ρ¼0:8 (Table 3) to simulate very strong correlation among Beta variates, which is most likely to inflate Type I errors in global tests. The simulation results for mild correlation in-cluding ρ¼0:2;Betað2;5Þ;Uniformð0:1;0:9Þare summar-ized in Appendix 1 (Table 4). The results from Table 3 and Appendix 1 (Table 4) show that Inverse chi test and Tippett’s test are very robust to dependency in p-values with well controlled Type I error rates. The KS test has the highest inflation in several scenarios we simulated, espe-cially when correlated p-values had peaks near center (Pat-tern 4). For strongly correlated p-values (ρ¼0:8 Table 3), the inverse norm, the Wilcoxon and Logit tests also had modest inflations when sample sizes get larger (n>200). When p-values were moderately correlated ( ρ¼0:2; Betað2;5Þ;Uniformð0:1;0:9Þ, (Table 4)), the inverse norm, the Wilcoxon and the Logit tests had well controlled Type I errors for all tested sample sizes.
In the second simulation study, we are interested in the power of each of the approaches to detect the GxG interac-tions by performing the hypothesis testing (1) to detect PrðP≤pÞ>p(Pattern 2 with GxG interactions). We simu-lated p-values from a wide range of beta mixture distribu-tion where the mixing π was set to be 0.1 and 0.4, indicating different proportions of tests with significant GxG interactions. In most cases, parameters a<bwill have PrðP≤pÞ>pfor p2ð0;1Þ which coincides with Pattern 2. Under alternative hypothesis of a proportion of tests having GxG interaction, we simulated p-values from 6 Beta mixtures:
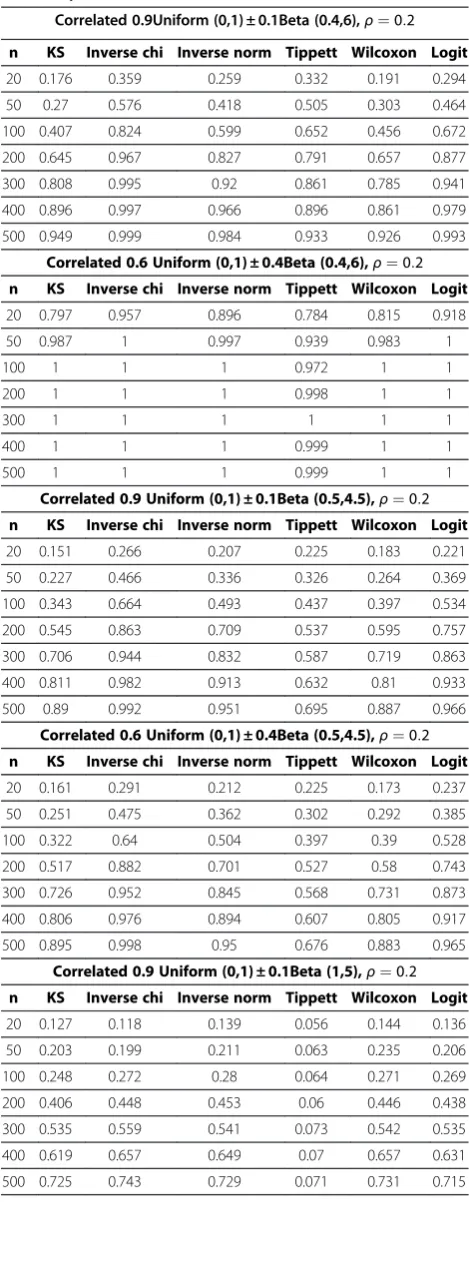
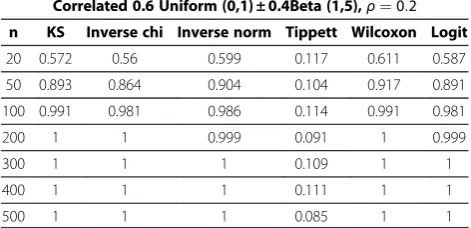
As in the Type I error simulation, in the power simula-tion, we used sample sizes ranging from 20 to 500 and per-form simulation 1000 times. The power is the percentage of results across the 1000 replicates where the null hypoth-esis was rejected. We present the power comparison results under week correlation ρ¼0:2 in Table 5 because all six global tests are free of Type I errors in this scenario. Power comparisons for ρ¼0:8;Betað2;5Þ;Uniformð0:1;0:9Þ are summarized in Appendix 1 (Table 6). These results indicate that Tippett’s test, which only takes the smallest p-value into account, might not be appropriate for detecting the patterns of alternation. Among the other five global tests, Inverse chi test has the strongest power in most simulated cases. These five global tests have strong power to detect PrðP≤pÞ>pfor small to moderate sample sizes.
The global tests have been implemented in R. The R code is available at http://www.childrensmercy.org/Content/ view.aspx?id=22812.
Discussion and conclusions
Multifactor Dimensionality Reduction (MDR) is a novel statistical method developed to characterize and detect nonlinear complex gene-gene interactions (epistasis) that could be associated with disease susceptibility. We suggest incorporating global test to filtration procedures to reveal a trend of gene interactive patterns when noisy genes are removed step by step using ReliefF or other filtration tech-niques. The optimal number of genes for further MDR analysis can be identified by p-values of global testing. A real data applications and empirical assessment of our proposed methods reveal strong trends in global testing of p-values and clear patterns of distribution of p-values in three scenarios: 1) presence of GxG interactions, 2) ab-sence of GxG interactions, 3) weak GxG interactions that needs filtration to remove noisy genes. The proposed global tests can serve as a screening approach before indi-vidual tests to prevent false discovery. Strong power in Table 3 Type I error of six global tests of p-values when
p-values are independent or strongly correlated (The nominal Type I error rate is 0.05 and the severe inflation of Type I error with simulated error rate>0.1 is written in bold italic)
Independent Uniform (0,1)
n KS Inverse chi Inverse norm Tippett Wilcoxon Logit
20 0.052 0.053 0.049 0.051 0.052 0.050
50 0.051 0.052 0.051 0.048 0.051 0.050
100 0.046 0.049 0.050 0.049 0.049 0.051
200 0.047 0.048 0.047 0.052 0.049 0.048
300 0.051 0.054 0.053 0.051 0.053 0.053
400 0.042 0.046 0.046 0.048 0.047 0.046
500 0.051 0.050 0.049 0.051 0.050 0.050
Correlated Uniform (0,1)
n KS Inverse chi Inverse norm Tippett Wilcoxon Logit
20 0.061 0.059 0.063 0.050 0.065 0.062
50 0.058 0.060 0.063 0.049 0.061 0.062
100 0.060 0.066 0.068 0.049 0.066 0.067
200 0.063 0.069 0.073 0.050 0.072 0.072
300 0.069 0.071 0.074 0.052 0.073 0.074
400 0.064 0.066 0.073 0.048 0.071 0.072
500 0.064 0.070 0.071 0.049 0.068 0.069
Correlated Uniform (0,1) ± 0.1Beta (5,1),ρ¼0:8
n KS Inverse chi Inverse norm Tippett Wilcoxon Logit
20 0.061 0.047 0.058 0.035 0.061 0.057
50 0.081 0.037 0.054 0.046 0.06 0.053
100 0.080 0.039 0.061 0.045 0.056 0.057
200 0.156 0.031 0.062 0.039 0.059 0.059
300 0.180 0.017 0.04 0.039 0.049 0.042
400 0.270 0.025 0.055 0.052 0.053 0.056
500 0.278 0.017 0.052 0.046 0.060 0.052
Correlated 0.5 Uniform (0,1) ± 0.5Beta (5,1),ρ¼0:8
n KS Inverse chi Inverse norm Tippett Wilcoxon Logit
20 0.239 0.007 0.009 0.035 0.013 0.009
50 0.652 0.002 0.022 0.025 0.02 0.022
100 0.911 0.001 0.018 0.023 0.018 0.019
200 0.998 0 0.021 0.034 0.025 0.021
300 1 0 0.029 0.033 0.039 0.027
400 1 0 0.027 0.024 0.034 0.023
500 1 0 0.031 0.024 0.036 0.025
Correlated 0.9 Uniform (0,1) ± 0.1Beta (6,3),ρ¼0:8
n KS Inverse chi Inverse norm Tippett Wilcoxon Logit
20 0.072 0.041 0.05 0.038 0.052 0.05
50 0.107 0.039 0.065 0.051 0.068 0.062
100 0.148 0.048 0.086 0.04 0.089 0.086
200 0.227 0.038 0.088 0.048 0.101 0.086
300 0.296 0.024 0.097 0.042 0.119 0.095
400 0.353 0.04 0.108 0.053 0.131 0.105
Table 3 Type I error of six global tests of p-values when p-values are independent or strongly correlated (The nominal Type I error rate is 0.05 and the severe inflation of Type I error with simulated error rate>0.1 is written in bold italic)(Continued)
500 0.439 0.041 0.12 0.033 0.148 0.111
Correlated 0.5 Uniform (0,1) ± 0.5Beta (6,3),ρ¼0:8
n KS Inverse chi Inverse norm Tippett Wilcoxon Logit
20 0.421 0.01 0.038 0.025 0.063 0.029
50 0.837 0.008 0.089 0.019 0.147 0.071
100 0.989 0.008 0.16 0.024 0.253 0.122
200 1 0.001 0.268 0.023 0.411 0.207
300 1 0 0.392 0.022 0.581 0.32
400 1 0.004 0.492 0.031 0.679 0.422
Table 4 Type I error of six global tests of p-values when p-values are moderately correlated (The nominal Type I error rate is 0.05 and the severe inflation of Type I error with simulated error rate>0.1 is written in bold italic)
Correlated Uniform (0,1) ± 0.1Beta (5,1),ρ¼0:2
n KS Inverse chi Inverse norm Tippett Wilcoxon Logit
20 0.018 0.031 0.022 0.048 0.021 0.026
50 0.014 0.019 0.008 0.046 0.01 0.013
100 0.014 0.014 0.013 0.05 0.014 0.014
200 0.003 0.01 0.006 0.044 0.004 0.007
300 0.002 0.005 0.002 0.05 0.001 0.002
400 0.001 0.003 0 0.045 0 0
500 0.002 0.002 0.003 0.042 0.001 0.003
Correlated 0.5 Uniform (0,1) ± 0.5Beta (5,1),ρ¼0:2
n KS Inverse chi Inverse norm Tippett Wilcoxon Logit
20 0 0 0 0.023 0 0
50 0 0 0 0.023 0 0
100 0 0 0 0.029 0 0
200 0 0 0 0.025 0 0
300 0 0 0 0.024 0 0
400 0 0 0 0.021 0 0
500 0 0 0 0.024 0 0
Correlated 0.9 Uniform (0,1) ± 0.1Beta (6,3),ρ¼0:2
n KS Inverse chi Inverse norm Tippett Wilcoxon Logit
20 0.041 0.051 0.047 0.047 0.042 0.049
50 0.032 0.049 0.043 0.042 0.034 0.048
100 0.033 0.032 0.035 0.043 0.035 0.036
200 0.017 0.009 0.023 0.052 0.017 0.024
300 0.017 0.016 0.015 0.039 0.011 0.016
400 0.028 0.006 0.014 0.044 0.01 0.017
500 0.021 0.007 0.013 0.048 0.009 0.015
Correlated 0.5 Uniform (0,1) ± 0.5Beta (6,3),ρ¼0:2
n KS Inverse chi Inverse norm Tippett Wilcoxon Logit
20 0.008 0.004 0.003 0.025 0.001 0.003
50 0.021 0.002 0.001 0.024 0.001 0.002
100 0.046 0.001 0.001 0.028 0 0.001
200 0.165 0 0 0.023 0 0
300 0.337 0 0 0.025 0 0
400 0.558 0 0 0.017 0 0
500 0.66 0 0 0.018 0 0
Correlated Uniform (0,1) ± 0.1Beta (5,1),ρ¼Betað2;5Þ
n KS Inverse chi Inverse norm Tippett Wilcoxon Logit
20 0.034 0.043 0.036 0.047 0.034 0.04
50 0.019 0.022 0.02 0.05 0.018 0.021
100 0.012 0.018 0.011 0.038 0.008 0.012
200 0.002 0.008 0.006 0.045 0.006 0.006
300 0.005 0.009 0.005 0.037 0.004 0.007
400 0.004 0.005 0.002 0.038 0.002 0.002
500 0 0.003 0.001 0.05 0 0.002
Table 4 Type I error of six global tests of p-values when p-values are moderately correlated (The nominal Type I error rate is 0.05 and the severe inflation of Type I error with simulated error rate>0.1 is written in bold italic)
(Continued)
Correlated 0.5 Uniform (0,1) ± 0.5Beta (5,1),ρ¼Betað2;5Þ
n KS Inverse chi Inverse norm Tippett Wilcoxon Logit
20 0.001 0.002 0.001 0.021 0 0.001
50 0 0 0 0.026 0 0
100 0 0 0 0.016 0 0
200 0 0 0 0.02 0 0
300 0 0 0 0.031 0 0
400 0.002 0 0 0.02 0 0
500 0.001 0 0 0.028 0 0
Correlated 0.9 Uniform (0,1) ± 0.1Beta (6,3),ρ¼Betað2;5Þ
n KS Inverse chi Inverse norm Tippett Wilcoxon Logit
20 0.049 0.046 0.054 0.044 0.055 0.05
50 0.039 0.031 0.042 0.042 0.036 0.043
100 0.027 0.027 0.036 0.05 0.033 0.037
200 0.033 0.023 0.03 0.041 0.025 0.032
300 0.042 0.018 0.029 0.038 0.023 0.032
400 0.041 0.012 0.02 0.046 0.017 0.021
500 0.053 0.013 0.026 0.054 0.02 0.028
Correlated 0.5 Uniform (0,1) ± 0.5Beta (6,3),ρ¼Betað2;5Þ
n KS Inverse chi Inverse norm Tippett Wilcoxon Logit
20 0.02 0.006 0.008 0.03 0.006 0.009
50 0.051 0 0 0.031 0 0
100 0.123 0 0.003 0.023 0.001 0.004
200 0.271 0 0 0.021 0 0
300 0.414 0 0 0.033 0 0
400 0.552 0 0 0.024 0 0
500 0.663 0 0 0.028 0 0
Correlated Uniform (0,1) ± 0.1Beta (5,1),ρ¼Uniformð0:1;0:9Þ
n KS Inverse chi Inverse norm Tippett Wilcoxon Logit
20 0.036 0.041 0.034 0.048 0.031 0.038
50 0.042 0.039 0.043 0.054 0.039 0.048
100 0.028 0.03 0.029 0.054 0.028 0.029
200 0.037 0.018 0.023 0.045 0.021 0.025
300 0.016 0.012 0.013 0.025 0.015 0.014
400 0.034 0.008 0.017 0.045 0.015 0.019
500 0.031 0.006 0.014 0.046 0.005 0.016
Correlated 0.5 Uniform (0,1) ± 0.5Beta (5,1),ρ¼Uniformð0:1;0:9Þ
n KS Inverse chi Inverse norm Tippett Wilcoxon Logit
20 0.011 0.005 0.002 0.017 0.001 0.002
50 0.029 0.002 0.003 0.022 0.001 0.003
100 0.048 0 0 0.023 0.001 0.001
200 0.099 0 0 0.023 0.000 0
300 0.161 0 0 0.026 0.000 0
small sample sizes and well controlled Type I error in ab-sence of GxG interactions makes these tests highly recom-mended in epistasis studies.
Global testing has not been implemented in MDR ana-lyses in the literature we have reviewed. Currently, research-ers rely on adjustment of individual p-values such as false discovery rate (FDR) as suggested by [31]. Due to high dimensionality in genetic interactions, the FDR and other multiple testing adjustments often lose power in MDR ana-lyses. Some MDR studies [27] have utilized the false positive report probability proposed by [32] but this method has been pointed out by [33] to be heuristic and wrong in for-mulation. In contrast, the global tests proposed by this paper are based on rigorous statistical theories and inferences.
Through extensive simulation on correlated p-values, our study shows that the Inverse chi test is the most powerful approach to be incorporated with the filtration techniques to determine the optimal number of SNPs for the final MDR analysis. The KS test might have high infla-tion of Type I errors when p-values are highly correlated or when p-values peak near the center of histogram (Pattern 4). The Tippett’s test has very low power when the effect size of Pattern 2 is small.
We observe mild inflation of Type I error (<0.07) when p-values are Uniform with a random correlation matrix. Table 4 Type I error of six global tests of p-values when p-values are moderately correlated (The nominal Type I error rate is 0.05 and the severe inflation of Type I error with simulated error rate>0.1 is written in bold italic)
(Continued)
500 0.218 0 0 0.024 0.001 0
Correlated 0.9 Uniform (0,1) ± 0.1Beta (6,3),ρ¼Uniformð0:1;0:9Þ
n KS Inverse chi Inverse norm Tippett Wilcoxon Logit
20 0.05 0.036 0.038 0.033 0.044 0.039
50 0.054 0.031 0.047 0.043 0.045 0.044
100 0.044 0.031 0.048 0.05 0.045 0.056
200 0.091 0.034 0.057 0.047 0.058 0.058
300 0.117 0.024 0.054 0.049 0.054 0.05 s8
400 0.097 0.022 0.048 0.048 0.048 0.05
500 0.116 0.014 0.042 0.035 0.043 0.043
Correlated 0.5 Uniform (0,1) ± 0.5Beta (5,1),ρ¼Uniformð0:1;0:9Þ
n KS Inverse chi Inverse norm Tippett Wilcoxon Logit
20 0.108 0.009 0.016 0.027 0.017 0.016
50 0.298 0.002 0.014 0.025 0.013 0.014
100 0.459 0.002 0.014 0.024 0.016 0.014
200 0.774 0 0.016 0.017 0.022 0.017
300 0.908 0 0.016 0.023 0.023 0.015
400 0.933 0 0.024 0.024 0.029 0.019
500 0.975 0 0.016 0.02 0.032 0.013
Uniform distributions have random correlation matrices. The nominal Type I error rate is 0.05 and the severe inflation of Type I error with simulated error rate>0.1 is written in bold italic).
Table 5 Power of six global tests of correlated P-values (The correlation coefficient for Beta random variables is
ρ. Uniform distributions have random correlation matrices)
Correlated 0.9Uniform (0,1) ± 0.1Beta (0.4,6),ρ¼0:2
n KS Inverse chi Inverse norm Tippett Wilcoxon Logit
20 0.176 0.359 0.259 0.332 0.191 0.294
50 0.27 0.576 0.418 0.505 0.303 0.464
100 0.407 0.824 0.599 0.652 0.456 0.672
200 0.645 0.967 0.827 0.791 0.657 0.877
300 0.808 0.995 0.92 0.861 0.785 0.941
400 0.896 0.997 0.966 0.896 0.861 0.979
500 0.949 0.999 0.984 0.933 0.926 0.993
Correlated 0.6 Uniform (0,1) ± 0.4Beta (0.4,6),ρ¼0:2
n KS Inverse chi Inverse norm Tippett Wilcoxon Logit
20 0.797 0.957 0.896 0.784 0.815 0.918
50 0.987 1 0.997 0.939 0.983 1
100 1 1 1 0.972 1 1
200 1 1 1 0.998 1 1
300 1 1 1 1 1 1
400 1 1 1 0.999 1 1
500 1 1 1 0.999 1 1
Correlated 0.9 Uniform (0,1) ± 0.1Beta (0.5,4.5),ρ¼0:2
n KS Inverse chi Inverse norm Tippett Wilcoxon Logit
20 0.151 0.266 0.207 0.225 0.183 0.221
50 0.227 0.466 0.336 0.326 0.264 0.369
100 0.343 0.664 0.493 0.437 0.397 0.534
200 0.545 0.863 0.709 0.537 0.595 0.757
300 0.706 0.944 0.832 0.587 0.719 0.863
400 0.811 0.982 0.913 0.632 0.81 0.933
500 0.89 0.992 0.951 0.695 0.887 0.966
Correlated 0.6 Uniform (0,1) ± 0.4Beta (0.5,4.5),ρ¼0:2
n KS Inverse chi Inverse norm Tippett Wilcoxon Logit
20 0.161 0.291 0.212 0.225 0.173 0.237
50 0.251 0.475 0.362 0.302 0.292 0.385
100 0.322 0.64 0.504 0.397 0.39 0.528
200 0.517 0.882 0.701 0.527 0.58 0.743
300 0.726 0.952 0.845 0.568 0.731 0.873
400 0.806 0.976 0.894 0.607 0.805 0.917
500 0.895 0.998 0.95 0.676 0.883 0.965
Correlated 0.9 Uniform (0,1) ± 0.1Beta (1,5),ρ¼0:2
n KS Inverse chi Inverse norm Tippett Wilcoxon Logit
20 0.127 0.118 0.139 0.056 0.144 0.136
50 0.203 0.199 0.211 0.063 0.235 0.206
100 0.248 0.272 0.28 0.064 0.271 0.269
200 0.406 0.448 0.453 0.06 0.446 0.438
300 0.535 0.559 0.541 0.073 0.542 0.535
400 0.619 0.657 0.649 0.07 0.657 0.631
Our global tests are implemented for screening SNPs and investigators can continue to use multiplicity adjustment algorithms such as FDR to adjust individual p-values in the final MDR analysis to prevent false discoveries. As a result, slight inflation in Type I error (<0.07) is acceptable in prac-tice. Moreover, in our case study, we show that one can utilize the decreasing trend of global test results (Figure 4) to facilitate decision making. If global tests provided false discoveries, then the trend of global tests results would ran-domly fluctuate up and down. Figure 4 with a decreasing trend for global testing results as well Figure 3 with histo-grams systematically switching to Pattern 2 can also serve as diagnostic tools to prevent false discoveries or selection bias in global tests.
It is worthwhile to point out the proposed global tests can effectively prevent false discovery without losing the power to detect significant GxG interactions. To prevent the false discovery, current MDR applications typically choose one optimal model for each k-way interaction. This method has two major drawbacks: firstly, the false positive discovery is not reduced by choosing one opti-mal model; secondly, choosing one optiopti-mal models may overlook other potential GxG interactions that also con-tributes to the disease susceptibility.
The major contribution of our manuscript is to in-corporate global testing procedures to MDR framework. Our proposed global tests will provide p-values to help practitioners determine the appropriate number of SNPs to be remained in the final analysis. The current filtra-tion process does not provide p-values. Therefore, using arbitrary cutoff value in the current process might lead to over-filtering or under-filtering of SNPs.
All 6 global tests are based on statistical inference instead of permutation. These 6 tests run very fast in a single com-puter. The major computational challenges are in the gen-eration of p-values for MDR through permutation tests but this is not the major focus of our work. Several works have been devoted to improve the efficiency and shorten the computing time in MDR analysis in high-throughput data. Table 5 Power of six global tests of correlated P-values (The correlation coefficient for Beta random variables is
ρ. Uniform distributions have random correlation matrices)(Continued)
Correlated 0.6 Uniform (0,1) ± 0.4Beta (1,5),ρ¼0:2
n KS Inverse chi Inverse norm Tippett Wilcoxon Logit
20 0.572 0.56 0.599 0.117 0.611 0.587
50 0.893 0.864 0.904 0.104 0.917 0.891
100 0.991 0.981 0.986 0.114 0.991 0.981
200 1 1 0.999 0.091 1 0.999
300 1 1 1 0.109 1 1
400 1 1 1 0.111 1 1
500 1 1 1 0.085 1 1
Table 6 Power of six global tests of correlated P-values (The correlation coefficient for Beta random variables is
ρUniform distributions have random correlation matrices)
Correlated 0.9 Uniform (0,1) ± 0.1Beta (0.4,6),ρ¼0:8
n KS Inverse chi Inverse norm Tippett Wilcoxon Logit
20 0.19 0.402 0.285 0.329 0.204 0.323
50 0.293 0.654 0.458 0.547 0.324 0.514
100 0.41 0.833 0.644 0.665 0.48 0.7
200 0.705 0.963 0.856 0.785 0.693 0.901
300 0.864 0.989 0.943 0.861 0.834 0.956
400 0.934 0.996 0.967 0.878 0.862 0.978
500 0.962 0.999 0.989 0.914 0.928 0.994
Correlated 0.6 Uniform (0,1) ± 0.4Beta (0.4,6),ρ¼0:8
n KS Inverse chi Inverse norm Tippett Wilcoxon Logit
20 0.848 0.968 0.913 0.787 0.837 0.924
50 0.994 0.999 0.998 0.922 0.989 0.998
100 1 1 0.999 0.956 0.999 0.999
200 1 1 1 0.987 1 1
300 1 1 1 0.993 1 1
400 1 1 1 0.992 1 1
500 1 1 1 0.994 1 1
Correlated 0.9 Uniform (0,1) ± 0.1Beta (0.5,4.5),ρ¼0:8
n KS Inverse chi Inverse norm Tippett Wilcoxon Logit
20 0.145 0.282 0.199 0.243 0.158 0.237
50 0.281 0.491 0.376 0.345 0.296 0.409
100 0.374 0.686 0.532 0.425 0.418 0.573
200 0.598 0.874 0.734 0.531 0.627 0.771
300 0.774 0.951 0.866 0.579 0.767 0.89
400 0.855 0.975 0.914 0.641 0.836 0.936
500 0.938 0.993 0.962 0.635 0.91 0.977
Correlated 0.6 Uniform (0,1) ± 0.4Beta (0.5,4.5),ρ¼0:8
n KS Inverse chi Inverse norm Tippett Wilcoxon Logit
20 0.149 0.287 0.221 0.217 0.178 0.242
50 0.265 0.518 0.4 0.334 0.323 0.438
100 0.421 0.693 0.539 0.434 0.438 0.575
200 0.604 0.856 0.726 0.485 0.644 0.754
300 0.778 0.951 0.858 0.582 0.761 0.886
400 0.871 0.978 0.931 0.612 0.858 0.942
500 0.921 0.981 0.948 0.658 0.901 0.957
Correlated 0.9 Uniform (0,1) ± 0.1Beta (1,5),ρ¼0:8
n KS Inverse chi Inverse norm Tippett Wilcoxon Logit
20 0.157 0.147 0.158 0.066 0.154 0.154
50 0.192 0.234 0.231 0.069 0.222 0.22
100 0.32 0.355 0.347 0.064 0.344 0.34
200 0.491 0.521 0.501 0.061 0.502 0.488
300 0.655 0.698 0.663 0.068 0.651 0.652
400 0.776 0.784 0.754 0.068 0.751 0.741
Table 6 Power of six global tests of correlated P-values (The correlation coefficient for Beta random variables is
ρUniform distributions have random correlation matrices)(Continued)
Correlated 0.6 Uniform(0,1) ± 0.4Beta(1,5),ρ¼0:8
n KS Inverse chi Inverse norm Tippett Wilcoxon Logit
20 0.698 0.676 0.695 0.124 0.703 0.682
50 0.966 0.921 0.938 0.131 0.948 0.922
100 0.999 0.988 0.991 0.11 0.997 0.988
200 1 1 1 0.116 1 1
300 1 1 1 0.122 1 1
400 1 1 1 0.122 1 1
500 1 1 1 0.114 1 1
Correlated 0.9 Uniform(0,1) ± 0.1Beta(0.4,6),ρ¼Betað2;5Þ
n KS Inverse chi Inverse norm Tippett Wilcoxon Logit
20 0.147 0.349 0.245 0.332 0.181 0.288
50 0.263 0.59 0.422 0.529 0.298 0.481
100 0.396 0.804 0.627 0.648 0.447 0.687
200 0.675 0.963 0.831 0.804 0.662 0.89
300 0.809 0.99 0.927 0.836 0.808 0.951
400 0.899 0.998 0.966 0.907 0.865 0.979
500 0.958 0.999 0.98 0.928 0.912 0.99
Correlated 0.6 Uniform(0,1) ± 0.4Beta(0.4,6),ρ¼Betað2;5Þ
n KS Inverse chi Inverse norm Tippett Wilcoxon Logit
20 0.827 0.974 0.921 0.789 0.808 0.941
50 0.994 1 0.999 0.945 0.977 0.999
100 1 1 1 0.983 1 1
200 1 1 1 0.997 1 1
300 1 1 1 1 1 1
400 1 1 1 1 1 1
500 1 1 1 0.999 1 1
Correlated 0.9 Uniform(0,1) ± 0.1Beta(0.5,4.5),ρ¼Betað2;5Þ
n KS Inverse chi Inverse norm Tippett Wilcoxon Logit
20 0.141 0.269 0.205 0.229 0.162 0.231
50 0.235 0.444 0.33 0.321 0.257 0.367
100 0.359 0.661 0.526 0.408 0.423 0.562
200 0.543 0.879 0.709 0.516 0.577 0.747
300 0.726 0.95 0.849 0.562 0.731 0.878
400 0.81 0.977 0.902 0.632 0.81 0.928
500 0.914 0.993 0.959 0.683 0.895 0.967
Correlated 0.6 Uniform (0,1) ± 0.4Beta (0.5,4.5),ρ¼Betað2;5Þ
n KS Inverse chi Inverse norm Tippett Wilcoxon Logit
20 0.138 0.26 0.199 0.238 0.169 0.212
50 0.241 0.469 0.356 0.335 0.288 0.385
100 0.347 0.662 0.506 0.402 0.408 0.55
200 0.547 0.885 0.703 0.519 0.585 0.761
300 0.694 0.949 0.852 0.592 0.727 0.88
400 0.802 0.987 0.914 0.627 0.804 0.935
500 0.882 0.991 0.948 0.641 0.871 0.959
Table 6 Power of six global tests of correlated P-values (The correlation coefficient for Beta random variables is
ρUniform distributions have random correlation matrices)(Continued)
Correlated 0.9 Uniform(0,1) ± 0.1Beta(1,5),ρ¼Betað2;5Þ
n KS Inverse chi Inverse norm Tippett Wilcoxon Logit
20 0.121 0.118 0.133 0.071 0.132 0.129
50 0.194 0.21 0.214 0.064 0.217 0.211
100 0.277 0.311 0.305 0.071 0.306 0.299
200 0.449 0.502 0.486 0.068 0.485 0.477
300 0.585 0.643 0.612 0.058 0.623 0.599
400 0.66 0.72 0.697 0.075 0.696 0.682
500 0.767 0.8 0.775 0.059 0.759 0.759
Correlated 0.6 Uniform(0,1) ± 0.4Beta(1,5),ρ¼Betað2;5Þ
n KS Inverse chi Inverse norm Tippett Wilcoxon Logit
20 0.594 0.591 0.632 0.124 0.637 0.616
50 0.913 0.9 0.921 0.139 0.922 0.914
100 0.996 0.992 0.992 0.111 0.995 0.99
200 1 1 1 0.102 1 1
300 1 1 1 0.115 1 1
400 1 1 1 0.116 1 1
500 1 1 1 0.095 1 1
Correlated 0.9 Uniform(0,1) ± 0.1Beta(0.4,6),ρ¼Uniformð0:1;0:9Þ
n KS Inverse chi Inverse norm Tippett Wilcoxon Logit
20 0.183 0.397 0.292 0.363 0.217 0.324
50 0.291 0.639 0.459 0.545 0.34 0.508
100 0.418 0.821 0.625 0.653 0.463 0.694
200 0.669 0.958 0.855 0.78 0.68 0.881
300 0.818 0.993 0.924 0.861 0.782 0.947
400 0.919 0.997 0.97 0.908 0.89 0.985
500 0.974 1 0.988 0.926 0.932 0.994
Correlated 0.6 Uniform(0,1) ± 0.4Beta(0.4,6),ρ¼Uniformð0:1;0:9Þ
n KS Inverse chi Inverse norm Tippett Wilcoxon Logit
20 0.815 0.964 0.928 0.825 0.836 0.945
50 0.99 1 0.997 0.92 0.988 0.997
100 1 1 1 0.971 1 1
200 1 1 1 0.993 1 1
300 1 1 1 0.997 1 1
400 1 1 1 0.998 1 1
500 1 1 1 1 1 1
Correlated 0.9 Uniform(0,1) ± 0.1Beta(0.5,4.5),ρ¼Uniformð0:1;0:9Þ
n KS Inverse chi Inverse norm Tippett Wilcoxon Logit
20 0.154 0.283 0.216 0.228 0.171 0.24
50 0.272 0.465 0.352 0.331 0.296 0.391
100 0.358 0.675 0.512 0.421 0.414 0.561
200 0.528 0.871 0.706 0.526 0.578 0.749
300 0.749 0.958 0.857 0.578 0.752 0.89
400 0.857 0.986 0.924 0.632 0.841 0.938
We will defer interested readers to the corresponding cita-tions for computing issues in high-throughput MDR ana-lysis. These computational limitations make our strategy appropriate in large scale candidate gene studies, but may be limited in application to genome-wide association stud-ies until further improvements in computing speed are rea-lized or very large-scale computing resources are available.
MDR permutation computing time is largely dependent on the dimension of data sets. In other words, the comput-ing time increases as the number of SNPs and/or the num-ber of subjects increases. Interestingly, the dimension of data does little impact on the computing time of global tests. The computing time for global tests of 1000 p-values is very close to tests of 10 p-values. Several filtration approaches have been proposed and some (ReliefF, SURF and TuRF etc.) have been implemented in the MDR soft-ware (http://www.epistasis.org). In this work, we utilize ReliefF for filtration. There have been other filtration
techniques proposed in literature. For instance, [34] intro-duced entropy-based information gain to search and evalu-ate interactions among risk factors. The current MDR software [8] provides ReliefF, entropy, chi-square test, etc. about 10 filtration methods. The global tests could be inte-grated in the workflow with other filtration techniques, al-though the comparison and evaluation of all filtration technique requires more research attention.
Appendix 1
Simulation of correlated p-values
We generate correlated Beta variables using the method proposed by [30]. According to Bayesian theory, random variables from a Beta prior and a Beta-Binomial conjugate function will yield correlated random deviates whose mar-ginal distribution is also Beta. Firstly, randomly generate a variableKfrom KeBetaBinomial v;ð α;βÞ whereαand βare the shape parameters. Conditioning onK¼k, gener-ate Pdeviates from Betaðαþk;vþβ1Þ. By integrating onK, theP deviates have unconditional marginal distribu-tion as Betaðα;βÞ and the correlation coefficient amongP deviates is ρ¼v=ðvþαþβÞ. In this paper, we simulated different correlation coefficient with constant ρ¼0:2;08 or ρ as a random variable from ρeBetað2;5Þ and ρeUniformð0:1;0:9Þrespectively.
In the above method,ρ¼v=ðvþαþβÞ can be written as v¼ðαþβÞρ=ð1ρÞ but algorithm to generate Beta-Binomial with non-integer vis not widely available. As a result, we use an alternative method to generate correlated uniform distributions . In essence, correlated uniform vari-ables,U, with a random correlation matrixΣcan be gener-ated by transforming multivariate normal variablesXusing formula U¼F Xð Þ where Fis the CDF of the standard normal distribution. First, we generated a positive definite covariance matrix,Σ0with randomly selected eigenvalues and randomly generated orthogonal matrix as eigenvectors (R clusterGeneration package). Letσijbe the component in Σ0. We can convert the covariance matrix, Σ0 to correl-ation matrixΣwith componentsrij¼pffiffiffiffiffiffiffiσiiσjjσij . To ensure the
correlation is invariant to transformation, we need to ad-just correlation matrix Σ into Padj¼2 sinðπP=6Þ.
Per-form Choleski factorization to generate C¼ Padj
1
2
.
Generate a vector of i.i.d. standard normal variables, X0. LetX ¼X0∗CandU¼F Xð Þ. As a result, the variablesU are correlated uniform variables with correlation matrixΣ.
Competing interests
There are no competing interests to this work.
Authors’contributions
HD and MB conceived of the study. AMR aided in study design and MDR method. HD and AMR performed the simulations and data analysis. MB, RG, and SL performed the clinical data collection, genotyping and interpretation
Table 6 Power of six global tests of correlated P-values (The correlation coefficient for Beta random variables is
ρUniform distributions have random correlation matrices)(Continued)
Correlated 0.6 Uniform(0,1) ± 0.4Beta(0.5,4.5),ρ¼Uniformð0:1;0:9Þ
n KS Inverse chi Inverse norm Tippett Wilcoxon Logit
20 0.137 0.282 0.2 0.228 0.159 0.234
50 0.237 0.484 0.359 0.306 0.293 0.392
100 0.345 0.679 0.503 0.411 0.416 0.544
200 0.577 0.858 0.719 0.512 0.6 0.757
300 0.725 0.946 0.848 0.584 0.743 0.873
400 0.868 0.981 0.92 0.621 0.85 0.931
500 0.9 0.989 0.947 0.676 0.869 0.959
Correlated 0.9 Uniform(0,1) ± 0.1Beta(1,5),ρ¼Uniformð0:1;0:9Þ
n KS Inverse chi Inverse norm Tippett Wilcoxon Logit
20 0.141 0.166 0.16 0.078 0.155 0.155
50 0.213 0.224 0.235 0.054 0.251 0.232
100 0.318 0.362 0.364 0.073 0.365 0.362
200 0.477 0.525 0.498 0.047 0.503 0.485
300 0.621 0.651 0.637 0.071 0.622 0.621
400 0.718 0.747 0.721 0.071 0.708 0.707
500 0.804 0.818 0.794 0.075 0.785 0.78
Correlated 0.6 Uniform(0,1) ± 0.4Beta(1,5),ρ¼Uniformð0:1;0:9Þ
n KS Inverse chi Inverse norm Tippett Wilcoxon Logit
20 0.694 0.656 0.705 0.109 0.721 0.685
50 0.938 0.901 0.929 0.125 0.94 0.915
100 0.994 0.989 0.991 0.114 0.995 0.99
200 1 1 1 0.143 1 1
300 1 0.999 1 0.113 1 1
400 1 1 1 0.122 1 1
500 1 1 1 0.119 1 1