www.nat-hazards-earth-syst-sci.net/9/303/2009/ © Author(s) 2009. This work is distributed under the Creative Commons Attribution 3.0 License.
and Earth
System Sciences
Towards operational near real-time flood detection using
a split-based automatic thresholding procedure on high resolution
TerraSAR-X data
S. Martinis, A. Twele, and S. Voigt
German Aerospace Center (DLR), Oberpfaffenhofen, Germany
Received: 4 December 2008 – Revised: 19 February 2009 – Accepted: 26 February 2009 – Published: 11 March 2009
Abstract. In this paper, an automatic near-real time (NRT) flood detection approach is presented, which combines his-togram thresholding and segmentation based classification, specifically oriented to the analysis of single-polarized very high resolution Synthetic Aperture Radar (SAR) satellite data. The challenge of SAR-based flood detection is ad-dressed in a completely unsupervised way, which assumes no training data and therefore no prior information about the class statistics to be available concerning the area of inves-tigation. This is usually the case in NRT-disaster manage-ment, where the collection of ground truth information is not feasible due to time-constraints. A simple thresholding al-gorithm can be used in the most of the cases to distinguish between “flood” and “non-flood” pixels in a high resolution SAR image to detect the largest part of an inundation area. Due to the fact that local gray-level changes may not be dis-tinguished by global thresholding techniques in large satellite scenes the thresholding algorithm is integrated into a split-based approach for the derivation of a global threshold by the analysis and combination of the split inherent information. The derived global threshold is then integrated into a multi-scale segmentation step combining the advantages of small-, medium- and large-scale per parcel segmentation. Experi-mental investigations performed on a TerraSAR-X Stripmap scene from southwest England during large scale flooding in the summer 2007 show high classification accuracies of the proposed split-based approach in combination with im-age segmentation and optional integration of digital elevation models.
Correspondence to: S. Martinis ([email protected])
1 Introduction
The demand for near real-time (NRT) information on nat-ural disasters has increased considerably during recent years worldwide. Flooding is considered as the world’s most costly type of natural disaster in terms of both property damage and human causalities. Because of their nearly all-weather day-night capabilities, ensuring data-gathering on every over-pass, satellite Synthetic Aperture Radar (SAR) sensors are optimally suited for providing reliable information on ex-tensive floods, which usually occur during long lasting pre-cipitation and cloud cover periods. Flood information is needed as quickly and detailed as possible to provide an overview of the situation to improve crisis management and response activities. For that purpose an unsupervised flood detection approach particularly oriented to the analysis of single-polarized very high resolution SAR satellite data is presented.
results are satisfactory for calm water surfaces, which can be regarded as specular reflectors with low backscatter values. In contrast, the surrounding terrain usually exhibits higher signal return due to increased surface roughness. Elevated surface roughness of water bodies due to the influence of waves, precipitation as well as diffuse and double bounce re-flection at vegetation reduces the class-separability and also complicates the determination of an appropriate threshold.
Since a flood separating threshold value depends on many factors such as environmental and, satellite system parame-ters, it can be highly variable and has to be determined in-dividually for each satellite scene. In most cases threshold-ing based derivation of inundation areas from remote sens-ing data is generated by visual inspection of the image his-togram and subsequent fine tuning of the threshold. How-ever, such manual trial-and-error operations typically turn out to be relatively time consuming; additionally, the qual-ity of their results highly depends on the visual interpreta-tion and hence subjective impression of the operator. There-fore, such interactive threshold determination lacks objectiv-ity and traceabilobjectiv-ity. Automatic thresholding procedures can overcome these problems. In the context of automatic im-age thresholding, e.g. Sahoo et al. (1988), Pal and Pal (1993) and Bazi et al. (2007) provide extensive methodological re-views. Thresholding algorithms are either based on global information (e.g. gray-level histogram of the whole data set) or on local information (e.g. co-occurrence matrix) of an im-age. Independently of the used algorithm, the use of a sin-gle threshold for every image element in an entire data set is called global thresholding (Pal and Pal, 1993). On the other hand the partitioning of a data set into subregions and the derivation of a threshold value for each of these subimages is termed local thresholding (Sahoo et al., 1988).
Most parametric thresholding algorithms determine auto-matically the desired gray value which best separates two se-mantic classes under the assumption that the a priori proba-bilities of the class-conditional densities in a histogram are sufficient to properly model the class-distributions. The spa-tial flood extent, in combination with the spaspa-tial resolution and the coverage of the used satellite sensor determine the percentage of the inundated area within a satellite scene. Therefore the classes “flood” and “non-flood” may show quite different a priori probabilities when looking at the en-tire dataset compared to looking at a subset of it. This may reduce the capability of any global thresholding algorithm to detect an adequate threshold in the histogram, built from the large SAR scenes, because local gray-level changes may not be distinguished.
Due to these limitations a split-based approach (SBA) for unsupervised flood detection in SAR data is applied which originally has been proposed by Bovolo and Bruzzone (2007) for the identification of tsunami induced changes in mul-titemporal imagery. This approach comprises a tiling of the satellite imagery into smaller subscenes of user-defined size and a successive local thresholding analysis of a
lim-ited amount of splits with a high probability to contain large quantities of image elements of the classes “flood” and “non-flood”. Three thresholding approaches, all based on the KI minimum error thresholding algorithm (Kittler and Illing-worth, 1986) are tested. Different combination techniques are applied to extract one global threshold from the analysis of the selected image splits. The global threshold is then in-tegrated into a multi-scale segmentation process, which con-nects the advantages of small-, medium- and large-scale per parcel segmentation and hence should lead to a more accu-rate classification of the SAR data. Additionally, a high reso-lution digital elevation model (DEM) is used to improve the classification accuracy.
The effectiveness of the SBA in combination with sub-sequent classification refinement steps by multi-scale seg-mentation and DEM integration is analyzed using a large TerraSAR-X Stripmap scene from southwest England during a flood situation in July 2007.
The outline of the paper is as follows: in Sect. 2 the gen-eral SBA adapted to flood detection in SAR data is descibed. The application of the SBA to a TerraSAR-X scene of the River Severn (UK) and the subsequent classification refine-ment process is presented in Sect. 3. In Sect. 4, the results of the SBA by the use of three different automatic thresholding approaches as well as quality assessments of different refine-ment steps are reported. Finally, conclusions are drawn in Sect. 5.
2 A split-based automatic thresholding approach for unsupervised NRT-flood detection
2.1 Image tiling and split selection
The image-tiling technique divides a SAR sceneX with di-mensionsR,CintoN quadratic non-overlapping subimages
Xn of user-defined sizes*s. The selection ofs and
there-foreN depends on the extent of the two classes “flood” and “non-flood” within X, and on the spatial resolution of the SAR scene. Due to the fact that the thresholding algorithms only extract proper thresholds values if the histogram is not unimodal, the selection process has to ascertain that the sub-scenes contain a distinct number of pixels from both classes. A minimum amount of 10% of each class seems to be suffi-cient for accurate threshold detection up to reasonable over-lapped class mixtures according to empirical assumptions of Bazi et al. (2007) in automatic change detection. Appropri-ate splits are selected, combining the statistical properties of
Xand its subscenes. The coefficient of variation CVXn
(ra-tio between the meanµXnand standard deviationσXnof the
gray values ofXn) is used as an appropriate statistical
Erroneous selections may occur if a subset comprises both agricultural crop land and high reflecting urban areas. Thus, similar values of CVXnlike for subsets containing the classes
“flood” and “non-flood” are reached. A second measureRXn
is added which selects the image splits in dependence of the ratio between theµXn to the global intensity meanµX of
X. This step prohibits the mis-selection of subsets compris-ing both agricultural crop land and urban areas characterized by similar values of CVXn as splits covering large parts of
the classes “flood” and “non-flood”. Finally, the following data ranges have been derived by the investigation of several SAR data sets exhibiting flood situations for optimal split se-lection:
Xn0=XnCVXn≥0.7∧RXn0.4≤. . .≤0.9, n=1, . . . , N . (1)
Optionally, ancillary data like vector layers containing the position of the land-water boundary at normal hydrologi-cal conditions may optionally be integrated into the split-selection process. This information is in most cases already readily available (e.g. SRTM water mask) or can be gen-erated from pre-flood satellite archive scenes. The split-selection process may be restricted to these subimages in-tersecting the vector file. This reduces the probability of se-lecting split-elements not containing any water surfaces.
Out of the total set N0 of subimages Xn0 which fulfils Eq. (1) a limited numberN00of subimagesXn00is finally se-lected for the threshold computation. The value ofN00can be manually set by the user before starting the algorithm. This selection is made to constrain and equalize processing times independently fromN0. This final selection is carried out by the computation of the Euclidean distance1CVRXn0 within a 2-D feature space determined by CVXn0 andRXn0between the points of the respective subset and the meanµCVRXn0 of the cluster ofXn0. TheN00 elements with the lowest Eu-clidean distance are selected:
Xn00=X1, X20, . . . , Xn01CVRX10 ≤1CVRX20 ≤ . . .≤1CVRXn0, n≤N
00o
. (2)
If the case occurs that no splits are selected according to the predefined criterion, simultaneously the range of CVXnis
de-creased andRXnis increased stepwise by 0.05 until a
mini-mum set ofN00splits is reached.
2.2 Automatic threshold selection procedure
The principal concept of using global thresholding algo-rithms for delineating flood zones in SAR intensity data is to assign all elements with a scattering cross-section lower or greater than a thresholdτ to the class “flood” or “non-flood”, respectively. This means that aR*Cdimensioned gray-scale imageX={xrc:r=0,1, . . ., R−1, c=0,1, . . ., C−1}with
Gpossible gray-levels (xrc=g,g∈{0,1, . . ., G−1}) will be
transformed according toτ∈{0,1, . . ., G−1}into a binary
formY={yrc : r=0,1, . . ., R−1, c=0,1, . . ., C−1}with
following values:
yrc =
(
1xrc ≤τ
0xrc > τ
)
, (3)
where 1=flood, 0=non-flood .
Difficulties may arise within the global thresholding pro-cedure if the illumination varies across the image due to in-cidence angle linked backscatter variances or atmospheric conditions. However, within TerraSAR-X data, especially Spotlight and Stripmap products, the system induced effect is marginally existent due to only small variations of the in-cidence angle from near- to far-range (3.562◦maximum at a ground swath width of 31.638 km). Therefore these system-related backscatter variations can be neglected. Despite the fact that the all-weather imaging capabilities of SAR sensors are often emphasized in the literature, heavy precipitation in combination with the relatively short wavelength of the ac-tively emitted X-band microwaves may cause artefacts which appear as dark patches due to the attenuation of the transmit-ted signal as well as bright objects due to partial backscat-tering at rain-cells. However, these effects are very rare and appear just locally. Likewise, these exceptions can be disre-garded.
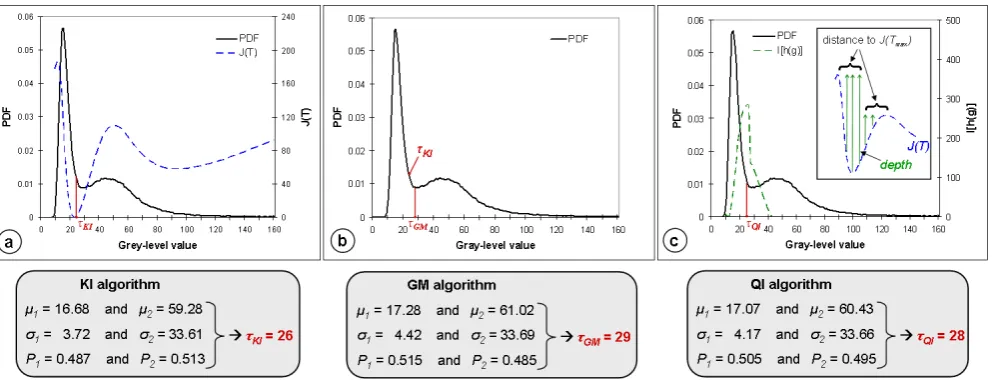
In this study three bi-level thresholding techniques are tested for the distinction between floodwater surfaces and non-flood areas. The first is the original KI algorithm itself. The second one computes the most prominent (global) min-imum (GM) of the image histogram starting at the derived minimum error cutting point. The third approach uses an index function, combining the separability of the two distri-butions and the most dramatic change in the KI’s criterion function, to obtain the optimal threshold by the use of a qual-ity index (QI).
2.2.1 Kittler and Illingworth’s algorithm
param-eters meanµi, standard deviationσi and a priori probability
Pi, so that
p(g)= 2 X
i=1
Pip(g|i ) (4)
where
p (g|i )= 1 2π σi
e−(g−µi)2/2σi2. (5)
Due to the fact that these parameters are usually not known in advance they have to be estimated at some arbitrary threshold levelT which separates the two pixel populations with the following properties (Kittler and Illingworth, 1986):
Pi(T )= b
X
g=a
h(g) (6)
µi(T )=
Pb
g=ag∗h(g)
Pi(T )
(7)
σi(T )=
Pb
g=a(g−µi(T ))2∗h(g)
Pi(T )
(8) wherea=1 ifi=flood,a=T+1 ifi=non-flood,b=T ifi=flood andb=Gifi=non-flood.
The selection of an appropriate thresholdτ is based on the optimization of a given predefined criterion functionJ (T )
that averages the cost functionc(g, T )over the histogram:
J (T )=
G−1 X
g=0
h(g)c(g, T ) (9)
The cost function measures the cost of classifying pixels by comparing their gray-levels with the thresholdT. Accord-ing to the number of brightness levels of an image up toG
different threshold values can be tested in succession. For each brightness value, the fitting criterionJ (T )is calculated, which is defined by
J (T )=1+2
P1(T )logσ1(T )+P2(T )logσ2(T )− 2
P1(T )logP1(T )+P2(T )logP2(T ).
(10) As long as thresholdT is varied, the models of the Gaussian distributions change. The better the model fits the data, the lower is the criterion of this cost function. Therefore, the brightness valueT, which reduces the criterion function, is considered to be the optimal thresholdτKIsince at this po-sition, the classification error is minimized according to the Bayes classification rule, i.e., the number of mis-segmented pixels is smallest:
τKI=arg min
T J (T ) (11)
One has to note thatτKIcorresponds to the intersection point of the two Gaussian populations. If an overlap between the classes exists, as it is usually occurs in remote sensing data, the tails of these underlying distributions are truncated by the thresholding procedure and therefore the modelsh(g|i) will be biased estimates of the true mixture components.
2.2.2 Global minimum thresholding
The second strategy used for automatic object-background separation is a bottom of the valley approach which locates, if existent, the most pronounced global minimum (GM) in a subhistogram. This belongs to the position between adja-cent peaks of a bimodal histogram which often is chosen as a starting threshold in manual trial-and-error approaches by visual inspection of the image histogram. Based on the posi-tion of the threshold valueτKIwhich is located between the two global maxima of a bimodal histogram the most pro-nounced valley between the two distributions “flood” and “non-flood” can be derived, primarily computing the direc-tion in which the subhistogram declines in the surrounding of the start valueτKI and moving step wise to this location τGMwhere the global minimum occurs.
2.2.3 Quality-index thresholding
The third method proposed for automatic partitioning of bi-modal histograms derives the threshold according to a quality measure. For that purpose we use an index functionI[h(g)], introduced by Miasnikov et al. (2004) as a measure for the usefulness of bi-partitioning a 1-D projection of a dataset at the position of a computed threshold.I[h(g)]is a composite measure containing a term sep describing the separability be-tween the peaks of two distributions in relation to their means
µi and variancesσi2as well the term depth which accounts
for the largest variation in KI’s criterion functionJ (T ):
I[h (g)]=sep∗depth (12)
where
sep= (µ1−µ2) 2
σ12+σ22 . (13)
The depth ofJ (T )is originally given by the difference be-tween the value ofJ (T ) calculated at the minimum error thresholdτKIand the closest local maximumJ (Tmax)of the KI function. In this studyI[h(g)]is used for the search of the thresholdτQIwhich best separates the class distributions “flood” and “non-flood”. This is identical to the position whereI[h(g)]is maximized:
τQI=arg maxI[h (g) , T] (14)
The calculation of the closest local maximum is accom-plished for each of the two class peaks ofJ (T )separated by the calculated global minimum atτGM.
2.2.4 Split combination techniques
To derive a spatially coherent binary flood mask without any discontinuance at the boarders of adaptively thresholded splits one global reliable threshold is used for classification.
mathematical combination techniques of (sub)histogram de-rived thresholds and a (sub)histogram-merging strategy with subsequent thresholding.
The principal concept of the first method is to compute for every (sub)histogram of the selected splitsXn00a local thresh-oldτlocby any of the proposed KI, GM or QI thresholding al-gorithms. To obtain a global thresholdτglobwhich is used for the classification ofXsimple mathematical operations can be applied; e.g. the computation of the median or the arithmetic mean. Due to the fact that all values of the variables are in-tegrated with the same weight within the computations, the arithmetic mean contains more information than the median. However, it is more sensitive to outliers appearing just at one side of the range of values, especially in the presence of just a few samples. This may produce improper final threshold values due to the limited numberN00of selected splitsXn00, even if a robust split-selection procedure is applied.
The second method avoids the use of mathematical combi-nation techniques by computingτglobdirectly from a merged histogram which is a combination of the distributions of the individual splitsXn00. However, the accuracy of the thresh-old selection may be reduced by differences in the statistical properties of the class-distributions in the respective splits.
3 Application for high resolution TerraSAR-X data at the River Severn, UK
In this section the unsupervised flood detection approach is applied exemplarily to a TerraSAR-X data set acquired dur-ing heavy floods in southwest England at the River Severn in 2007. The proposed workflow (Fig. 1) contains the SBA for automatic threshold computation of the pre-processed SAR scene as well as a classification refinement process including a multi-scale segmentation and an optional DEM integration step.
3.1 Data set
A period of heavy precipitations over the Gloucestershire Re-gion in Southwest England during the summer season 2007 caused severe flooding at the River Severn. The record flood level at Tewkesbury was measured at 5.43 m on 22 July 2007 which was 0.13 m above the previously highest record from the year 1947. The proposed SBA is applied on a TerraSAR-X Stripmap scene (Fig. 2a) with 3.25 m pixel spacing in range and azimuth direction showing the flood sit-uation along a section of about 69 km length of the River Sev-ern on 25 July 2007 (06:34:08 UTC) including the confluence of River Avon coming from northeast. The data are HH po-larized, which is the favoured polarization in flood mapping, because it provides the most obvious discrimination between open water and non-flood areas since it is less sensitive to small scale roughness of waves on the water surface than VV like-polarisation or cross-polarisations (Henry et al., 2006).
At the time of the satellite overpass there was no precipi-tation and low wind speed (16.5 km/h). Additionally, two ancillary data sets are available for this study: orthorectified aerial photographs with a spatial resolution of 0.2 m recorded about half a day prior to the TerraSAR-X overpass (24 July 2007 between 13:10:00 and 15:40:00 UTC) by a Rollei Mod-ular AIC as well as a LiDAR-DEM with a horizontal resolu-tion of 2 m and a vertical accuracy of 0.1 m.
3.2 Pre-processing
A preliminary despeckling was performed by adaptive filter-ing to reduce salt-and-pepper structures within the data. The speckle appearing on SAR imagery is a natural phenomenon generated by the coherent processing of radar echoes (Lee, 1986). Its presence not only reduces the interpreter’s abil-ity to resolve fine details, but also makes automatic segmen-tation of such noisy images difficult. For this purpose the Gamma-MAP filter (Lopes et al., 1990) was chosen because it comprises a good trade-off between the quality of the fil-tering result and the computation time. The filfil-tering was ac-complished by a mask-size of 3×3 pixels, which seems to be a sufficient size for this data set.
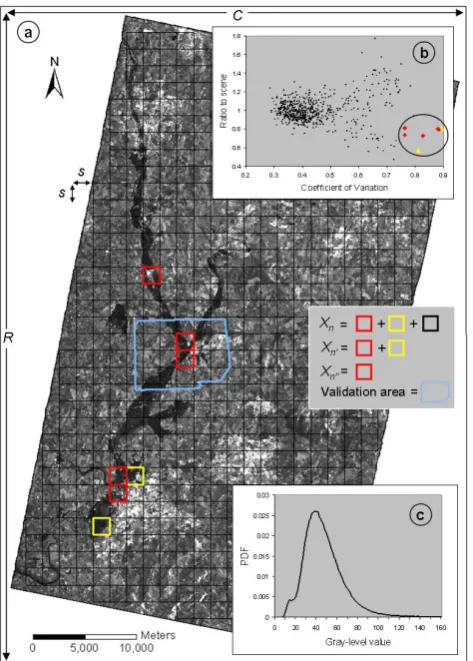
For validation purposes of the results of the proposed SBA and refinement process a reference map was created for a small subset (approx. 5.4*106pixels) of the TerraSAR-X scene by visual interpretation and manual digitisation of the orthophotos, which is covered by 23.8% of the class “flood” and 76.2% of the class “non-flood”. The subset of the refer-ence scene (see Figs. 2a and 5a) was chosen based on the overlap between the SAR data, the aerial images and the DEM. It comprises the heavily flooded Tewkesbury region. 3.3 Split-based approach
The SBA is applied to a TerraSAR-X sceneX with dimen-sions of R=14 461, C=20 153 pixels. According to a split size ofs=500, X is tiled into 1187 subimages, whereof a quantityNof 637 subimages contains no pixels with no-data values. An amount ofN0=7 splits (Fig. 2a and b) were se-lected out ofN according to the criterion defined in Eq. (1). These remaining subscenes are considered as suitable for ef-fective threshold detection. This assumption can be con-firmed by the fact that selected subimages intersect the vi-sually detectable land-water boundary (see Fig. 2a). Out of
N0a fixed number ofN00=5 splits are sorted out according to Eq. (2) to perform the final threshold selection (Fig. 2a and b). The three proposed thresholding algorithms (KI, GM and QI) are applied to the five splits and different combination techniques for the derivation of one global threshold are exe-cuted. The performing of the thresholding algorithms as well as the results is presented in Fig. 3 exemplarily by splitX400. For this split the KI algorithm computes a threshold value
Fig. 1. Block scheme of the proposed workflow for automatic flood detecting within large SAR satellite data.
Fig. 2. (a) TerraSAR-X data of the River Severn (25 July 2007) with splitsXn0,Xn00 and outline of the validation area, (b) Location of Xn, Xn0 andXn00within the feature space (CVXn0/RXn0), (c) PDF
ofX.
criterion function derived by the KI as well asτGMare used to calculate the threshold positionτQI=28 where the index function reaches its maximum.
3.4 Classification refinement process for unsupervised flood detection
The classification refinement process has the purpose to im-prove the accuracy of the classification result derived by global thresholding. It consists of two main parts: a multi-scale segmentation and an optional DEM integration step. 3.4.1 Multi-scale segmentation
Pixel-based and segmentation-based classification tech-niques can be considered as main concepts for the identifica-tion of flooded areas in radar imagery. Convenidentifica-tional classi-fication approaches use pixels as smallest geometrical com-ponents of raster data. However, the parameters which can be employed for the classification are limited. Additionally, pixel-based classifiers do not make use of spatial informa-tion of the image and are thus not suited in cases where land cover units are composed of spectrally heterogeneous ele-ments. By the use of segmentation techniques, some dis-advantages of pixel-based image thresholding can be solved. Image segmentation partitions an image into uniform regions based on similarity criteria of gray values or textural proper-ties (Meinel and Neubert, 2004). The created homogeneous, non-overlapping segments have a strong correlation with real objects or areas of the earth’s surface. Due to the increasing spatial resolution of earth observation imagery per-parcel ap-proaches gain in importance in the field of remote sensing image analysis. Especially for data of the new generation of SAR sensors with up to one meter pixel spacing (TerraSAR-X, COSMO-SkyMed) the use of segmentation-based meth-ods appears promising. These images can exhibit very high spectral variances within a given thematic class due to both the reduced mixed pixel phenomenon and the SAR intrinsic speckle effect. In addition to spectral related characteristics of the image objects further parameters such as contextual information, texture and object geometry can be used for im-proving classification accuracy.
Gener-Fig. 3. Histogram of splitX400and derived threshold values by the use of the (a) criterion function of the KI algorithm, (b) GM algorithm, c)
Index function of the QI algorithm.
ally, high homogeneity segmentation parameters cause small segments, which, similar to pixel-based classifiers, produce noisy classification results but are able to detect small ob-jects, whereas low values of the homogeneity criterion gen-erate large segments at the expense of fine detail. Therefore, segmentation algorithms connecting the advantages of multi-scale segmentation and per-parcel classification by automatic thresholding seem promising for improved flood mapping.
Image objects were created using the Fractal Net Evolu-tion concept of the Definiens Developer software (Baatz and Sch¨ape, 1999; Definiens AG, 2008). An iterative bottom-up segmentation algorithm based on a pair wise region merging technique is employed to segment the image according to the maximum allowable heterogeneity of the image objects, de-fined by an initially set scale parameter. This scale parameter is a homogeneity criterionhcombining spectralhcand shape
homogeneityhs, withhs being composed of the smoothness
hcompact and compactnesshsmooth. The fusion of the objects within the segmentation process follows the local mutual best fitting algorithm. This leads to the lowest increase of object heterogeneity by merging two adjacent objects which exhibit the lowest distance in a feature space determined by mean spectral values or texture features. For classification refine-ment we developed an approach containing a threefold pro-cessing step which alternates multi-scale segmentation and classification by the SBA-derived global thresholdτglob:
1. Large-scale segmentation step and thresholding by
τglob.
2. Medium-scale segmentation of objects of class “non-flood” and thresholding byτglob.
3. Small-scale segmentation of objects of class “non-flood” and thresholding byτglob.
Step 1 partitions the input data X into an initial set of large image objects containing some variations in the spec-tral properties of the merged pixels. Subsequently, the cre-ated objects are thresholded byτglob. Most of the inunda-tion area is classified by this step, however fine tuning is reached by the following two steps, progressively enforc-ing the spectral homogeneity constraints of non-flood ob-jects in a defined neighbourhood around flood obob-jects and thresholding by τglob. A scale parameter of h=75 (unit-less) was selected for the initial segmentation ofXin step 1 based on visual interpretation of the image segmentation re-sults with different scale parameters. This value was consid-ered appropriate as reaching the best compromise between maximal possible heterogeneity and minimal homogeneity within the resultant object primitives, leading to an aver-age object size of 2995 pixels. Steps 2 and 3 were per-formed by a reduced scale parameter ofh=40 (average ob-ject size: 908 pixels) andh=5 (average object size: 16 pix-els) respectively to detect fine detailed flood objects. The composition of homogeneity was controlled by both spectral and shape properties. Spectral homogeneity was set to an overall spectral factor ofhc=80%. Shape-homogeneity
cri-teria included an overall shape factor ofhs=20% which was
subdivided into smoothness (hsmooth=10%) and compactness (hcompact=10%). Medium- and small-scale segmentation was accomplished within a distance of max. 5 objects and 1 ob-ject respectively to the class “flood”. This restriction pro-hibits the flood mapping of medium- and small-scale image elements with too large distance from the flood objects and additionally reduces the computational requirements of the segmentation. The settings for the scale parameterh, hc/ hs
3.4.2 DEM integration
We observe that thresholding is capable of detecting the ma-jority of flooded surfaces in X, but there are multiple ar-eas of relatively high backscatter surrounded by flood ob-jects, which are flooded with high probability but interpreted as non-flooded. These areas correspond predominantly to flooded surfaces which are broken by emergent vegetation. With X-band SAR flooded and non-flooded vegetation with a closed canopy can hardly be differentiated, due to very simi-lar radar cross-sections. Additionally, some wrongly labelled flood regions exist with a small surface roughness and there-fore low backscatter characteristics similar to calm water like streets, smooth agricultural crop land or radar shadow. For a hydrological plausible improvement of the classification re-sult the topographic information of a high resolution DEM is added into the classification process as it can be used to extract flooding under dense vegetation and forest cover (e.g. Wang et al., 2002; Mason et al., 2007) and within residen-tial areas. The proposed approach is appropriate for floods primarily caused by over-bank flow; predominantly affecting areas connected to the main river channel and also can be applied if no river gauge readings are available for hydraulic floodplain modelling. A prerequisite for this method is that major parts of the flood surface are already detected by the automatic thresholding step, thus a spatially coherent flood surface can be derived. The classification procedure using the DEM can be separated into two parts: an inclusion and an exclusion step. During the inclusion step, topography in-formation can be used in combination with contextual infor-mation to classify potentially flooded objects with backscat-ter intensities higher than the originally defined threshold, e.g. protruding vegetation or urban areas into the flood class. First, all classified flood objects without any conjunction to the core flood area and exceeding a predefined elevationH
are temporarily excluded from the classification result:
H=
Sf
X
sf=1 Sh
,
Sf
+1.5∗σSh (15)
whereSf is the number of flood objects,Shthe elevation of
each single flood object andσshthe standard deviation ofSh.
After that, an iterative classification process is performed considering local neighbourhood relations: If an object of the main flood area is found next to a non-flood object the height distance between the non-flood objects and the surrounding flood objects is calculated. In the case that the mean altitude of the non-flood object is lower or equal than the elevation of the contiguous flood objects, the non-flood object is recoded as flooded area. This processing step is repeated until no fur-ther non-flood object fits to this criterion. In case microto-pographic features exist (e.g. embankments, walls) that may prevent flooding of areas at lower elevations, the integration of objects stops if these obstructions with higher elevations are detected as non-flood objects. If the segmentation fails
to delineate such objects or the resolution of the DEM is too coarse classification errors may occur in this processing step. At the exclusion step, wrongly masked objects in regions with higher elevation than the main flood area can be elimi-nated. However, due to the fact that most parts of the flood-plain are connected to the main river channel which is a body of flowing water, the altitude of the land-water boundary de-creases downstream. Therefore using a global threshold for the exclusion step is not effective and a value which is repre-sentative for each position along the river is required instead. Accordingly, the altitude of every single flood object without connection to the main expanse of the flood area is compared to the altitude of the nearest object of the core flood area and removed from the mapping result if it exceeds a height differ-ence of 1.0 m. This value was chosen to account for slightly higher objects which should be retained due to local varia-tions in water height caused by the dynamic nature of floods.
4 Results
In this section, the performance of the proposed automatic approach of unsupervised threshold selection as well as the subsequent classification refinement process containing threefold image segmentation and an optional DEM integra-tion are assessed.
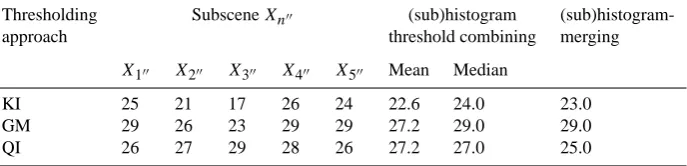
The results of the threshold computations by the use of the KI, GM and QI algorithm are presented in Table 1. It was possible to model the histogram of each selected split by a mixture of two Gaussian distributions. Thus, by any of the applied algorithms a threshold value could be derived. In comparison, no decision threshold could automatically be identified from the histogram ofX (Fig. 2c) because of the small a priori ratio at the visual detectable global mini-mum between the class “flood” (P1=0.023) and “non-flood” (P2=0.977), and the nearly unimodal distribution of the data set.
The local threshold positions of the selected subscenes computed by the KI, QI and GM algorithms exhibit slightly different values. This results from the varying class-statistical properties in the respective splits. The results de-rived by the QI algorithm are characterized by the lowest range of threshold values (26.0 to 29.0) which indicates less sensitivity to class statistics. A total amount of nine global threshold values (Table 1) have been derived by combining the three thresholding algorithms (KI, GM, QI) with three different split combination techniques (cf. Sect. 2.2.4), lead-ing to seven different values ofτglob in the range of 22.6 to 29.0. According to this a subset ofX(see Fig. 2a), for which the real flood extent is known, has been classified by these seven thresholds with different segmentation adjustments:
Table 1. Local thresholds computed by the KI, GM and QI algorithm for splitsXn00and global thresholds derived by the use of different
split combination techniques.
Thresholding SubsceneXn00 (sub)histogram
(sub)histogram-approach threshold combining merging
X100 X200 X300 X400 X500 Mean Median
KI 25 21 17 26 24 22.6 24.0 23.0
GM 29 26 23 29 29 27.2 29.0 29.0
QI 26 27 29 28 26 27.2 27.0 25.0
– L, M, S: uni-scale segmentation at large-, medium- or small-scale;
– L-M: bi-scale segmentation at large- and medium-scale;
– L-M-S: tri-scale segmentation at large-, medium- and small-scale;
– L-M-S-DEM: tri-scale segmentation with subsequent DEM integration.
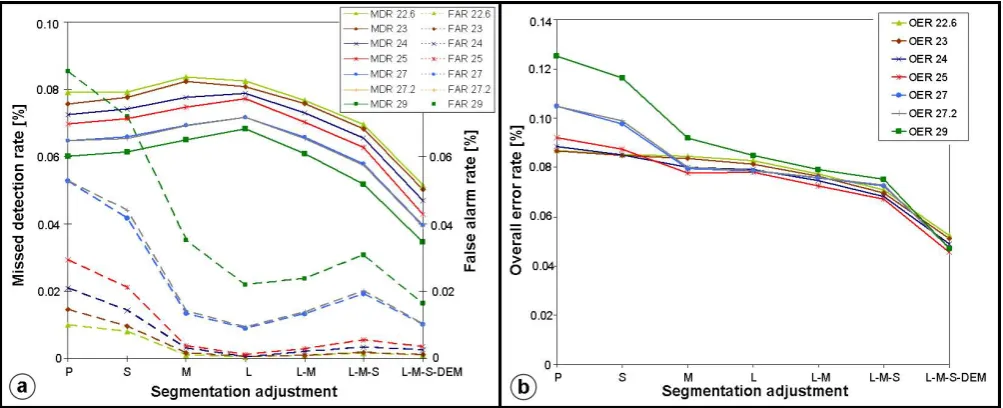
In Fig. 4 the accuracy assessment of the SBA and the clas-sification refinement steps for each threshold value is illus-trated by the missed alarm rate (MDR; i.e. the percentage of flood reference pixels erroneously detected as non-flooded), false alarm rate (FAR; i.e. the percentage of non-flood refer-ence pixels erroneously detected as flood) and overall error rate (OER; i.e. the percentage of erroneously labelled refer-ence pixels). Generally, a trend can be stated that a rise of the threshold value simultaneously is related to an increase of the FAR and a decrease of the MDR. Thus, reduction of false and missed alarms become two partially conflicting ob-jectives. Regarding the classification accuracy of every sin-gle threshold derived by the SBA, pixel-based thresholding in all cases produces higher OERs than segmentation-based classification. This observation can be explained by the huge amount of false alarms which cannot by compensated by a low quantity of missed alarms in relation to uni-scale and bi-scale segmentation forτglob=22.6 to 27.2. Large-scale seg-mentation (L) yields much better results than small- (S) and medium-scale (M) image decomposition due to the highly re-duced number of false alarms which exceed the rise in missed alarms. These missed alarms of L further are strongly re-duced by L-M and more considerably by L-M-S, due to the fact that finer details on medium- and small-scale level are identified as flooding in a defined neighbourhood of large-scale flood objects.
L-M-S leads to lowest OERs by classification without an-cillary data due to the fact that it combines the advantages of small-scale (low number of missed alarms) and large-scale (low number of false alarms) segmentation.
The integration of topographic information within the classification process of the tri-scale segmentation addition-ally reduces the percentage of the MDR. This results in the
best classification accuracy of L-M-S-DEM out of all seg-mentation adjustments for all determined threshold values.
When comparing the scale-dependent classification results of the individual threshold values, the minimum pixel-based OER (8.68%) appears at τglob=23.0, which corresponds to the threshold position derived by the KI algorithm applied to the mixed pixel population of the merged (sub)histograms ofXn00. In contrast values ofτglob<and>23.0 (τglob=22.6) show higher pixel-based OERs.
Fig. 4. (a) MDR and FAR for class flood and (b) OER calculated for the resultant global threshold values by the use of different segmentation scales.
Fig. 5. (a) Classification result by thresholding withτglob=25 derived from the merged histogram ofXn00 with L-M-S-DEM by the QI
algorithm (b) global density function of the reference subset as well as class-conditional density functions of “flood” and “non-flood” of the reference data and of thresholding results P (global density function separated by the vertical black curve), L-M-S and L-M-S-DEM.
The final flood map for the subset of X obtained by L-M-S-DEM with a threshold ofτglob=25.0 is shown in Fig. 5a. The producer’s accuracy reaches 82.01%, the user’s accu-racy 98.65% and the overall accuaccu-racy is 95.44%. This is a good result with overall accuracies considerably higher than commonly reported on the literature, which rarely reaches 90%. The result shows a coherent flood surface without salt-and-pepper effects and a good representation of the land-water boundary due to multi-level segmentation. Addition-ally, compared to pure per-pixel classification, less image
to-pography information such as short vegetation, which cause overestimations of the real ground surface elevation. False alarms just appear at the boarder of the extracted flood ex-tent. These are related to crop fields with short vegetation which show a similar spectral characteristic as water areas. Due to the fact that the DEM exclusion step only removes objects at higher elevations without connection to the main flood area, these regions initially labelled as main flood could not be deleted.
Generally, the algorithm performs very well in rural areas. In the partly flooded Tewkesbury town, however, only some larger regions could be detected as flooded. These are areas which are not brightened by double bounce effects as well as contributions from side-lobes of strong reflectors and there-fore can be detected due to their intensity value below the derived threshold. Supervised methods with a considerable amount of user interaction are necessary to perform a more accurate classification in urban areas using SAR data (Mason et al., 2008).
It is assumed that the obtained classification accuracy could be slightly increased if the flood extent extracted from the SAR data and from the aerial photos would be fit to one another. An estimation of the flood extent at the satel-lite overpass time was done by Mason et al. (2008) for the same SAR scene by linearly interpolating between the aerial photo flood extent on 24 July and the flood extent of 27 July derived from aerial photos acquired on a second flight cam-paign. Due to the fact that the aerial photos of the 27th were not at our disposal during our investigations, no such correc-tion could be accomplished.
The advantage of segmentation-based thresholding is also apparent if the class distributions derived from pixel- and object-based flood detection are compared (Fig. 5b): the class distributions derived by pixel-based thresholding ac-cording toτglob=25.0 show a rigorous truncation of the right tail of the class flood and of the left tail of the class “non-flood” whereas the populations derived by thresholding of the segmented image with L-M-S and especially L-M-S-DEM come closer to the shape of the reference classes’ distributions. This is due to the fact that the segmentation process also integrates image elements above the selected threshold into a homogeneous image object in dependence of the chosen homogeneity criterion. Thus, besides pure spectral information derived by histogram thresholding, also topological information is made available for classification.
5 Conclusions
A split based automatic thresholding and classification re-finement process has been applied as a test case to a TerraSAR-X Stripmap scene of the River Severn, UK, for unsupervised flood detection in large high resolution single-polarized SAR data sets. This approach already has success-fully been applied in operational rapid mapping activities.
The proposed method tiles a SAR image into a set of seg-ments and automatically selects a fixed number of splits ac-cording to their probability to comprise adequate portions of both classes “flood” and “non-flood”. To derive one global threshold by the analysis of the split inherent information mathematical combination techniques of (sub)histogram de-rived thresholds as well as (sub)histogram-merging strategies with subsequent thresholding have been analyzed. All three thresholding strategies (KI, GM, and QI) were able to deter-mine a threshold value by the analysis of the histogram of ev-ery single selected split and of the merged class-populations of the individual splits, respectively.
The following results could be derived by thresholding a reference subscene decomposed by different segmenta-tion adjustments: object-based context-sensitive threshold-ing has proven superior to pixel-based context-insensitive procedures due to the addition of spatial information to the pure spectral information derived from histogram threshold-ing. Lowest OERs could be obtained by a threefold seg-mentation step which consists of an alternating multi-scale image decomposition and thresholding approach that com-bines the advantages of small-, medium- and large-scale ob-ject generation. By the use of image segmentation, the vari-ation in OER for the classificvari-ation results derived by differ-ent threshold values can be fairly reduced in comparison to pixel-based thresholding approaches. Thus, the classification results of decomposed images are less sensitive to the used threshold algorithm as well as the applied split combination technique. Lowest OERs could be achieved by combining the KI algorithm with the (sub)histogram merging strategy whereas for the image segmentation adjustments M, L, L-M, L-M-S, L-M-S-DEM greatest classification accuracies could be achieved by a higher threshold value derived by the QI algorithm in combination with the (sub)histogram merging strategy.
High resolution topographic information has been suc-cessfully combined with multi-scale segmentation to en-hance the mapping performance in areas that partly consist of flooded vegetation and anthropogenic objects as well as to remove non-water look-alike areas.
boundaries of the histogram meaningless thresholds can be avoided by a constraint of the loop. The computational ef-fort of the SBA (less than 10 s for the entire scene on an a Intel Xeon 5160 CPU with 3.0 GHz and 3 GB of RAM) is much lower than the refinement process by image segmenta-tion, whose processing time rises according to the number of used segmentation-scales (160 s at L-M-S-DEM for the se-lected validation area). Therefore, the interpreter has to find a compromise between computational effort and classifica-tion quality.
The presented thresholding algorithm works successful in most of the cases, due to the fact that there is usually a suf-ficient contrast between the land and water surface. Future work will be related to extract the flood extent from rough-ened water surfaces.
Acknowledgements. Most part of this work is funded by the
German Ministry of Education, Science, Research and Technology (BMBF) in the context of the Research Programme “Risk Manage-ment of Extreme Flood Events” (RIMAX), project SAR-HQ (grant reference number: 0330719). The authors thank the Environment Agency of England and Wales for providing the LiDAR DEM and aerial photography of the Tewkesbury region. They are also grateful to Guy Schumann and an anonymous reviewer for their helpful comments.
Edited by: B. Merz
Reviewed by: G. Schumann and another anonymous referee
References
Baatz, M. and Sch¨ape, A.: Object-oriented and multi-scale image analysis in semantic networks, in: Proceedings of the 2nd Inter-national Symposium on Operationalization of Remote Sensing, Enschede, Netherlands, 16–20 August 1999.
Bazi, Y., Bruzzone, L., and Melgani, F.: An unsupervised approach based on the generalized Gaussian model to automatic change detection in multitemporal SAR images, IEEE T. Geosci. Re-mote, 43, 874–887, 2005.
Bazi, Y., Bruzzone, L., and Melgani, F.: Image thresholding based on the EM alg-orithm and the generalized Gaussian distribution, Pattern Recogn., 40, 619–634, 2007.
Bovolo, F. and Bruzzone, L.: A split-based approach to unsuper-vised change detection in large-size multitemporal images: Ap-plication to tsunami-damage assessment, IEEE T. Geosci. Re-mote, 45, 1658–1669, 2007.
Brivio, P. A., Colombo, R., Maggi, M., and Tomasoni, R.: Inte-gration of remote sensing data and GIS for accurate mapping of flooded areas, Int. J. Remote Sens., 23, 429–441, 2002. Chen, P., Liew, S. C., and Lim, H.: Flood detection using
multi-temporal Radarsat and ERS SAR data, in: Proceedings of the 20th Asian Conference of Remote Sensing, Hong Kong, China, 1185–1189, 22–25 November 1999.
Definiens AG: Defniens Developer 7 User Guide, Document Ver-sion 7.0.5.968, Munich, Germany, 2008.
Henry, J. B., Chastanet, P., Fellah, K., and Desnos, Y. L.: ENVISAT multi-polarised ASAR data for flood mapping, Int. J. Remote Sens., 27, 1921–1929, 2006.
Kittler, J. and Illingworth, J.: Minimum error thresholding, Pattern Recogn., 19, 41–47, 1986.
Lee, J. S.: Speckle suppression and analysis for SAR images, Opt. Eng., 25, 636–643, 1986.
Lopes, A., Nezry, E., Touzi, R., and Laur, H.: Maximum A Poste-riori speckle filtering and first order texture models in SAR im-ages, International Geoscience and Remote Sensing Symposium (IGARSS), Maryland, USA, 2409–2412, 24–28 May 1990. Mason, M. S., Horritt, J. T., Dall’Amico, Scott, T. R., and Bates, P.
D.: Improving river flood extent delineation from synthetic aper-ture radar using airborne laser altimetry, IEEE T. Geosci. Re-mote, 45, 3932–3943, 2007.
Mason, M. S., Speck, R., Schumann, G., Neal, J., and Bates, P. D.: Using TerraSAR-X data for improved urban flood model valida-tion, in: Proceedings of the 3rd TerraSAR-X Science Team Meet-ing, DLR Oberpfaffenhofen, Germany, 25–26 November 2008. Matgen, P., Schumann, G., Henry, J. B., Hoffmann, L., and
Pfis-ter, L.: Integration of SAR derived river inundation areas, high-precision topographic data and a river flow model toward near real-time flood management, Int. J. Appl. Earth Obs., 9(3), 247– 263, 2007.
Meinel, G. and Neubert, M.: A comparison of segmentation pro-grams for high resolution remote sensing data, in: Proceedings of the ISRPS Annual Conference, Istanbul, Turkey, 19-23 July 2004.
Miasnikov, A. D., Rome, V., and Haralick, R. M.: A hierarchi-cal projection pursuit clustering algorithm, in: Proceedings of the 17th International Conference on Pattern Recognition, Cam-bridge, England, 268–271, 23–26 August 2004.
Melgani, F., Moser, G., and Serpico, S. B.: Unsupervised change-detection methods for remote-sensing images, Opt. Eng., 41, 3288–3297, 2002.
Moser, G. and Serpico, S. B.: Generalized minimum-error thresh-olding for unsupervised change detection from SAR amplitude imagery, IEEE T. Geosci. Remote, 44, 2972–2982, 2006. Nico, G., Pappalepore, M., Pasquariello, G., Refice, S., and
Samarelli, S.: Comparison of SAR amplitude vs. coherence flood detection methods – a GIS application, Int. J. Remote Sens., 21, 1619–1631, 2000.
Pal, N. R. and Pal, S. K.: A review on image segmentation tech-niques, Pattern Recogn., 26, 1277–1294, 1993.
Sahoo, P. K., Soltani, S., Wong, A. K. C., and Chen, Y. C.: A sur-vey of thresholding techniques, Comput. Vision Graph., 41, 233– 260, 1988.
Townsend, P. A.: Estimating forest structure in wetlands using mul-titemporal SAR, Remote Sens. Environ., 79, 288–304, 2002. Wang, Y., Colby, J. D., and Mulcahy, K. A.: An efficient method for