ScholarlyCommons
Publicly Accessible Penn Dissertations
1-1-2014
Three Essays on Social Learning
Jae Young Lee
University of Pennsylvania, [email protected]
Follow this and additional works at:http://repository.upenn.edu/edissertations
Part of theAdvertising and Promotion Management Commons, and theMarketing Commons
This paper is posted at ScholarlyCommons.http://repository.upenn.edu/edissertations/1340
Recommended Citation
Abstract
Social learning broadly refers to learning through the acquisition of information from social sources. In the three essays of my dissertation, I investigate the various underlying drivers of social learning and how such learning can impact purchase decisions.
In Essay 1, I investigate the link between social learning and
sales of experiential products. In particular, I focus on how social capital (i.e., the propensity for people to trust and communicate with each other) moderates the level of social learning for experiential products and thus impacts aggregate sales.
In Essay 2, I study how social learning operates differently across the various stages of physician prescription -trial and repeat of a new prescription drug. Given that the mechanisms of social influence varies across -trial and repeat stages, the second essay further assesses who is most influential and who is most influenceable across stages.
In Essay 3, I examine how consumers make purchases of experiential products and link it to their active search for information from interdependent social sources. Essay 3 assesses the impact of the pattern of similarity of preferences in individual-level social networks (homophily, i.e., the tendency of individuals to associate with similar others, and structural balance, i.e., the congruency of preference in a social network) on consumer search, learning, and purchase.
Degree Type Dissertation
Degree Name
Doctor of Philosophy (PhD)
Graduate Group Marketing
First Advisor Raghuram Iyengar
Keywords
balance, bayesian learning, homophily, social capital, social learning, trial and repeat
Subject Categories
THREE ESSAYS ON SOCIAL LEARNING Jae Young Lee
A DISSERTATION in
Marketing
For the Graduate Group in Managerial Science and Applied Economics Presented to the Faculties of the University of Pennsylvania
in
Partial Fulfillment of the Requirements for the Degree of Doctor of Philosophy
2014
Supervisor of Dissertation
_____________________
Raghuram Iyengar, Associate Professor of Marketing
Graduate Group Chairperson
_____________________
Eric Bradlow, K.P. Chao Professor of Marketing, Statistics, and Education
Dissertation Committee
David Bell, Xinmei Zhang and Yongge Dai Professor of Marketing
Eric Bradlow, K.P. Chao Professor of Marketing, Statistics, and Education Rom Y. Schrift, Assistant Professor of Marketing
THREE ESSAYS ON SOCIAL LEARNING
COPYRIGHT
2014
ABSTRACT
THREE ESSAYS ON SOCIAL LEARNING
Jae Young Lee
Raghuram Iyengar
Social learning broadly refers to learning through the acquisition of information from
social sources. In the three essays of my dissertation, I investigate the various underlying
drivers of social learning and how such learning can impact purchase decisions.
In Essay 1, I investigate the link between social learning and sales of experiential
products. In particular, I focus on how social capital (i.e., the propensity for people to
trust and communicate with each other) moderates the level of social learning for
experiential products and thus impacts aggregate sales.
In Essay 2, I study how social learning operates differently across the various stages
of physician prescription – trial and repeat of a new prescription drug. Given that the
mechanisms of social influence varies across trial and repeat stages, the second essay
further assesses who is most influential and who is most influenceable across stages.
In Essay 3, I examine how consumers make purchases of experiential products and
link it to their active search for information from interdependent social sources. Essay 3
assesses the impact of the pattern of similarity of preferences in individual-level social
and structural balance, i.e., the congruency of preference in a social network) on
TABLE OF CONTENTS
ABSTRACT...III
LISTOFTABLES...VII
LISTOFFIGURES...VIII
INTRODUCTION...1
References ... 6
ESSAY1:NEIGHBORHOODSOCIALCAPITALANDSOCIALLEARNINGFOR EXPERIENCEATTRIBUTESOFPRODUCTS...7
1.1. Introduction ... 7
1.2. Background and Prior Research ... 11
1.3. Research Setting, Data, and Measures ... 17
1.4. Model ... 24
1.5. Empirical Findings ... 32
1.6. Summary ... 42
1.7. References ... 46
1.8. Appendix ... 51
ESSAY2:SOCIALCONTAGIONINNEWPRODUCTTRIALANDREPEAT...55
2.1. Introduction ... 55
2.2. Research Questions ... 59
2.3. Strengthening Internal Validity in Contagion Studies ... 66
2.4. Research Setting ... 69
2.5. Data ... 71
2.7. Results ... 87
2.8. Threats to Internal Validity ... 95
2.9. Discussion ... 101
2.10. References ... 105
2.11. Appendix ... 113
ESSAY3.THEIMPACTOFHOMOPHILYANDBALANCEINCONSUMERSEARCH FROMSOCIALCONTACTS...123
3.1. Introduction ... 123
3.2. Theoretical Framework and Hypothesis ... 129
3.3. Research Setting and Experimental Design ... 133
3.4. Model ... 143
3.5. Empirical Specification of the Learning Model– SMBL vs. EMBL ... 152
3.6. Estimation ... 156
3.7. Results ... 159
3.8. Conclusions ... 166
3.9. References ... 171
3.10. Appendix ... 176
CONCLUSION...186
LIST OF TABLES
1.1 Dimensions of Social Capital and Effects on Local Social Learning 1.2 Descriptive Statistics for Model Variables
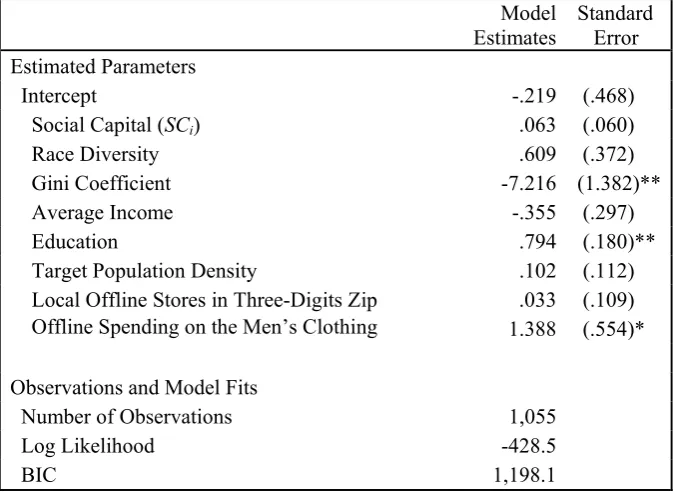
1.3 Social Learning and Local Social Capital: Estimates from Bonobos.com 1.4 Probit Estimates - The probability of at least one customer in a zip code
2.1. Fraction of all Colleague-Dyads that Involve a Discussion or Referral Tie 2.2. Fraction of all Discussion and Referral Ties that Involve Colleagues 2.3. Descriptive Statistics and Correlations among Covariates
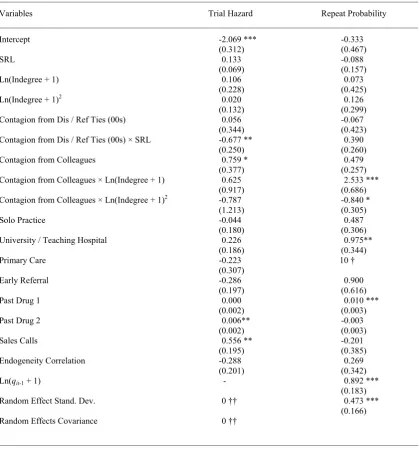
2.4. Model Estimates
2.5. Model Estimates Allowing for Cross-temporal Changes in Contagion
2.6. Model Estimates, after Centering Ln(Indegree+1) such that It Is Uncorrelated with its Square
3.1. Summary Statistics of Search and Purchase Decisions 3.2. SMBL vs. EMBL Specification
3.3. Model Comparisons
3.4. Model Estimates for SMBL and EMBL models 3.5. Drivers for Search Decisions
LIST OF FIGURES
1.1 The Number of New Trials in High Versus Low Social Capital Zip Codes 1.2 The Estimated Significance of Social Learning
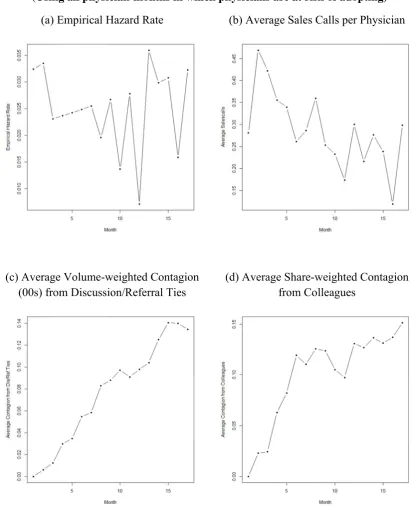
2.1. Descriptive Plots for Trial 2.2. Descriptive Plots for Repeat
2.3. Social Contagion in Adoption and Repeat Incidence
2.4. Social Contagion in Adoption and Repeat Incidence, after Centering Ln(Indegree+1) such that It Is Uncorrelated with its Squared Value
3.1. The Similarity of Preference in a Social Triad 3.2. Decision Framework
3.3. Screenshot of Survey Interface
3.4. Comparative Statics of Search /Purchase Decisions: Similar vs. Dissimilar 3.5. Comparative Statics of Search and Purchase Decisions: Balance vs. Imbalance
INTRODUCTION
Social learning broadly refers to learning through the acquisition of information from
social contacts such as friends, neighbors, colleagues, etc. Researchers have long
recognized the theoretical importance of social learning, and documented that social
learning is a significant driver of consumer decisions. In an influential study, Roberts and
Urban (1988) formally modeled consumers’ decision to choose a brand based on, among
other factors, word-of-mouth from their friends, and showed that the social learning is a
significant driver of consumers’ decision. Duflo and Saez (2003) analyzed a randomized
experiment and showed the role of social learning in employees' decisions to enroll in a
Tax Deferred Account (TDA) retirement plan within a large university. Conley and Udry
(2010) investigated the role of social learning in the diffusion of a new agricultural
technology in Ghana.
Beyond the significant effect of social learning in consumer decisions, recent studies
have investigated different drivers of social learning and provided insights on the factors
which make social learning more efficient. For instance, Iyengar, Van den Bulte, and
Valente (2011) consider the adoption of a new drug and find that physicians’
self-reported opinion leadership moderate the weight they put on others prescription behavior.
Godes and Mayzlin (2009) show that, for products with low awareness (a brewery chain
in their study), word-of-mouth information from less loyal customers is more effective
My dissertation adds to this stream of literature by investigating different moderators
of social learning. In Essay 1, I investigate how the neighborhood social capital, i.e., the
aggregate propensity for neighbors to trust and communicate with each other, moderates
social learning and the evolution of new trials at the aggregate level. Essay 2 focuses on
social learning at an individual level, and broadens the scope of interest by including not
only the new product trial but also repeat stage, and examines how social learning
operates differently across the different stages. In Essay 3, I extend Essay 1 by focusing
on a characteristic of an individual’s immediate social network which can potentially
drive aggregate-level social capital. To be more specific, I examine how the pattern of the
similarity of preferences in an individual’s immediate social networks affects consumer
search, learning from social contacts, and purchase behavior. As the similarity of
preferences is often confounded with other network characteristics (Aral and Walker
2012), I assess the role of the similarity of preferences in an experimental setting.
In each essay, I further provide managerially actionable insights on how practitioners
can effectively leverage social learning based on their understanding about the drivers of
social learning.
Essay 1 investigates the link between social learning and aggregate sales of products
with experience attributes, i.e., attributes of products that cannot be fully verified prior to
the first purchase. Experience attributes are prevalent and salient when consumers shop
through catalogs, home shopping networks, and over the Internet. Using data from
Bonobos.com, a leading US online fashion retailer, I find that local social learning not
only facilitates customer trial, but also that the effect is economically important as about
Capital Community Benchmark Survey, I find that “neighborhood social capital” (See
Putnam 1995 for details), enhances the social learning process, and makes it more
efficient. Social capital does not operate on trials directly; rather, it improves the learning
process and therefore indirectly drives sales when what is communicated is favorable.
These findings suggest that online retailers may want to use geographic targeting based on
the embeddedness of social relationships, and I propose a proxy of neighborhood social
capital that practitioners could act on.
Essay 2 proposes that social influence may affect not only trial but also repeat
behavior, though the process and source of influence are likely to differ between trial and
repeat. The analysis of the acceptance of a risky prescription drug by individual
physicians suggests that social learning drives social influence at the adoption stage, but
social conformity drives social influence at the repeat stage. Given that the mechanisms
of social influence vary across trial and repeat stages, who is most influential varies
across stages. Physicians with high centrality in the discussion and referral network and
with high prescription volume are influential in trial but not repeat. In contrast,
immediate colleagues—few of whom are nominated as a discussion or referral partner—
are influential in both trial and repeat. Furthermore, who is most influenceable also varies
across stages. For trial, it is physicians who do not consider themselves to be opinion
leaders, whereas for repeat, it is those located towards the middle of the status
distribution as measured by network centrality. The pattern of results is consistent with
informational social influence reducing risk in trial and normative social influence
increasing conformity in repeat. The findings suggest that practitioners should consider
conformity receive different weights when trying to get prospects to adopt versus trying
to get adopters to repeat.
In essay 3, I examine how the similarity of preference in individual social network
impacts information search, learning, and purchase of products. To rule out potential
confounds with the similarity of preferences, I conduct an incentive compatible stated choice
experiment where each participant searches for information about a product from their
contacts, learns about the product, and makes a purchase or not. I build a formal model for
search and purchase decisions, that flexibly accommodates the behavioral aspects of the
similarity of preference. There are two key insights. First, the reason consumers prefer to
gather information from similar others (i.e., homophily) is the greater informational benefit
rather than the greater convenience of collecting information from them. Second, structural
balance, which captures the consistency in the pattern of the similarity of preference among
individuals’ immediate social networks, is another key driver of consumer search and
learning from social contacts. Analogous to Heider (1946), we term a social system as
balanced if the valence of preferences (i.e., positive for similar preferences, and negative for
dissimilar preferences) in the system multiples out to be positive. While people understand
that informational benefits are greater under an imbalanced relationship, their cost of
information seeking is also higher. As a result, consumers search less under an imbalanced
than a balanced system, yet the lower amount of search still leads to a higher rate of purchase.
The findings have implications for companies that facilitate social search for products. For
instance, companies that facilitate social search may be able to increase their search traffic
by making consumers perceive that the search results are from others whose preferences are
experiential products to increase the purchase rate may be able to increase their purchase rate
by making consumers perceive that the search results are from those who have similar
References
Aral, S. and D. Walker. 2012. Identifying influential are susceptible members of social metworks. Science. 337 337-341.
Conley, T., C. Udry. 2010. Learning about a new technology: Pineapple in Ghana.
American Economic Review. 100(1) 35-69.
Duflo, E., E. Saez. 2003. The role of information and social interactions in retirement plan decisions: Evidence from a randomized experiment. Quarterly Journal of Economics. 118(3) 815-842.
Godes, D. and D. Mayzlin. 2009. Firm-created word-of-mouth communication: Evidence from a field test. Marketing Science. 28(4) 721-739.
Heider, F. 1946. Attitudes and cognitive organization. Journal of Psychology. 21(1) 107–
112.
Iyengar, R., C. Van den Bulte, and T. Valente. 2011. Opinion leadership and social contagion in new product diffusion. Marketing Science. 30(2) 195-212.
Putnam, R. 1995. Bowling alone: America’s declining Social capital. Journal of Democracy. 6(1) 65-78.
ESSAY 1: NEIGHBORHOOD SOCIAL CAPITAL AND SOCIAL
LEARNING FOR EXPERIENCE ATTRIBUTES OF PRODUCTS
1.1. Introduction
Information about new products passed from existing to potential customers is an
influential and widely studied driver of sales (e.g., Iyengar, Van den Bulte, and Valente
2011; Manchanda, Xie, and Youn 2008). Information regarding experience attributes, i.e.,
attributes which cannot be fully observable and verifiable pre-purchase, plays a key role
in reducing the uncertainty faced by potential customers in their first-time purchases. The
“experience attribute problem” is a general one; it is, however, particularly acute for
consumers who buy products through catalogs, home shopping networks, and over the
Internet.1 Firms selling through these channels face a ubiquitous issue: How to help
consumers overcome initial apprehension about buying what they sell.
By any measure, online retailing is by far the fastest growing retail sector around the
world. According to Forrester research, the United States will see growth from $231b in
2013 to $370b in 2017 (CAGR of 10%); projected rates are almost identical in Europe
where the total market should reach $247b by 2017.2 This phenomenon is not confined to
developed markets; in China, year-on-year growth through March 2012 exceeded 50%
and The Economist predicts that China will quickly become largest market by value.3
1 Complementary terms have been introduced to the literature for use in particular contexts, e.g., Degeratu, Rangaswamy, and Wu (2000) refer to “searchable sensory attributes” for goods sold online, whereas Lal and Sarvary (1999) use the term “non-digital attributes” to describe product attributes which cannot be fully conveyed when items are sold over the Internet.
2 http://techcrunch.com/2013/03/13/forrester-2012-2017-ecommerce-forecast/.
Thus, the global consumer economy is one in which information about experience
attributes plays an increasingly larger and more important role in buying decisions.
In this dissertation essay, we document how social learning reduces consumer
uncertainty for experience attributes in this context; more specifically, we explain why
and how neighborhood social capital (defined shortly) makes the social learning process
more efficient. Critically, it is not simply the case that social capital stimulates trial and
adoption of new products per se—it does not—rather, it works through a specific
mechanism to improve the quality of information transmitted in the social learning
process.
The institutional setting for our empirical work is best understood by example.
Premier and rapid-growth US Internet retailers like Bonobos.com, Trunkclub.com and
WarbyParker.com employ methods that include “totally free” return policies, “home-try
on”, and “pop-up stores” in large part to combat consumer uncertainty about the
experience attributes of the products they sell. In September 2012, leading industry
observer GigaOm.com reported on a $40m fundraising round by WarbyParker.com and
noted: “That (home try-on) has helped Warby Parker overcome one of the biggest hurdles
(italics added) for online fashion brands, getting people to feel comfortable about their
online purchase.”4
Naturally, these firm-initiated methods can be costly. We document a complementary
customer-initiated process for the resolution of pre-trial uncertainty that occurs naturally
offline: Social learning and information transmission between existing and potential
customers. Neighborhood social learning is observed in numerous settings including
diffusion of information about agricultural, healthcare, and retirement practices (e.g.,
Conley and Udry 2010; Sorensen 2006; Duflo and Saez 2003); we add to this body of
literature by demonstrating why social learning is so important for the growing consumer
Internet sector. Furthermore, we show why social capital, i.e., “the information, trust, and
norms of reciprocity inhering in one’s social networks” (Woolcock 1998, p. 153)
moderates local social learning, and makes the learning process about experience
attributes more efficient.
We model social learning and the proposed moderating effect of social capital using
data from Bonobos.com, a leading pure-play US fashion retailer, and neighborhood social
capital data from the Social Capital Community Benchmark Survey (SCCBS).5
Identification of social influence from secondary data is challenging (Manski 2000) and
the identification of a specific mechanism of social influence requires additional model
assumptions that are based on the institutional setting.
In this study, we identify the social learning process under the widely-employed
Bayesian Learning approach for modeling learning through direct experience (Erdem and
Keane 1996) or from advertisements (Narayanan, Manchanda, and Chintagunta 2005).
The Bayesian Learning assumption behind social learning is justified conceptually in
Section 1.4.1 and validated empirically in Section 1.5.2. Specifically, we develop a model
of individual learning and from there derive a neighborhood level (zip-level) model of
new trials arising in each time period.
Our model identifies social learning process as a process that is distinct from
alternative forms of social influence such as awareness dispersion (Van den Bulte and
Lilien 2001), social conformity (Amaldoss and Jain 2005), and network externality
(Manchanda, Xie, and Youn 2008). Moreover, we control for possible confounding
effects from correlated unobservables (Section 1.4.2), and capture the efficiency of social
learning in a single parameter.
We make three new substantive contributions. First, we show that social learning
about experience attributes is a key phenomenon in the rapidly growing consumer Internet
sector. In our empirical application, more than fifty percent of all trials in the first three
and a half years of operations at Bonobos.com are partially attributable to social learning.
Second, we explain and document a novel and critical role of local social capital in this
process. Again, it is important to note that local social capital does not per se stimulate
trial and diffusion; rather, it operates only on the learning process itself. It reduces
inefficiency in information transmission; in our empirical application the moderating
effect impacts about 8% of all trials. This effect is roughly constant throughout the data
period, suggesting that a fixed increment in social capital results in a fixed improvement
in information transmission, independent of the total number of customers at any time
period, or when they arrive.
Third, we highlight an important theme from recent related work; namely, that “real
world” factors influence consumer decisions to buy online (see, for example, Anderson et
Goldfarb 2009) and that insights from geographic variation in online buying are
actionable. SCCBS data are not available commercially so we identify and justify a
readily accessible measure, the “number local bars and liquor stores per capita per zip
code” as a proxy for neighborhood social capital in the target group. We show that this
variable moderates learning (of course it is not significant in a model that also contains the
“true” measure of social capital).
The remainder of the paper is organized as follows. Section 1.2 summarizes relevant
prior research and develops the conjectures for social learning and social capital. Section
1.3 describes the research setting, data, and measures. The empirical model is developed
in Section 1.4. Section 1.5 reports the findings and Section 1.6 concludes the paper.
1.2. Background and Prior Research
1.2.1. Consumer Uncertainty about Experience Attributes of Products Sold Online
Prior to their first purchase, consumers buying via catalogs, home shopping networks,
and the Internet lack complete knowledge about experience attributes of products (e.g.,
“fit, feel, touch, and taste”); for example, “ … fit is not fully observed by the customer
prior to purchase … [in] retail settings where customers select from a catalog or Internet
site without being able to fully inspect the product.” (Anderson, Hansen, and Simester
2009, p. 408).
For a consumer who is considering buying a pair of pants in a store, the texture of the
pants is a search attribute, i.e., an attribute that is directly verifiable pre-purchase. As
implied by Anderson et al. (2009), when the consumer considers buying the same item
experience attribute, i.e., not fully observable and verifiable pre-purchase. The
consequences are well known. Uncertainty about experience attributes decreases
purchase frequency (Cox and Rich 1964) and dollars spent (Jasper and Ouelette 1994) for
catalog and home shopping purchases.6
In some instances, offline distribution that allows customers physical access to
products is imperative, at least for some segments, as: “There are still people who want to
touch and feel (italics added) clothing before they purchase.” (Andy Dunn, CEO of
Bonobos.com).7 Moreover, when a product is available online and offline, consumers
might visit the offline store to inspect it and then order it online, perhaps from a
competing retailer.8 Thus, in general, the experience attribute issue is particularly acute
for consumers when they consider buying from vertically integrated brands without
offline distribution. Consequently, Bonobos.com (fashion apparel) has “insanely easy
returns”, Zappos.com (shoes) offers “totally free” returns and WarbyParker.com
(eyewear) has a “home try-on” option where potential customers are shipped five frames
(without lenses) to try for free.
6 According to the National Mail Order Association, the first cataloger in the United States is believed to be Richard Sears in late 1880s (http://www.ehow.com/facts_4925839_history-mail-order-shopping.html). TV home shopping emerged in 1977 and Amazon.com first opened an online bookstore in 1994. About 7-8% of all US retail sales are now online.
7 See http://www.forbes.com/sites/kellyclay/2012/04/12/nordstrom-invests-16-4-million-in-bonobos-now-available-in-stores/ for details.
8 This phenomenon of “show-rooming” (see
http://moneyland.time.com/2012/01/24/target-doesnt-want-to-be-a-showroom-for-the-stuff-you-buy-for-less-at-amazon/) where consumers scout out and examine products at giant offline retailers such as Best Buy or Target, and then purchase (at a lower price) at online alternatives like Amazon.com is problematic for offline stores. “Show-rooming” is a major reason why Circuit City went bankrupt (see
These efforts are costly, and absent an understanding of how information about
experience attributes spreads naturally and organically for free, e.g., through social
learning, firms may be relying too much on efforts that undermine margins.
1.2.2. Local Social Learning in Local Neighborhoods and Internet Retailing
Consumers often learn from their peers before making purchase decisions, i.e., through
social learning. When consumers shop online, we expect, ex ante,that social learning is a
plausible source of information about experience attributes for new customers and
thereby helps trial at Bonobos.com (our empirical application) and at other online
retailers as well.
Conceptually, this social learning process operates as follows. A potential consumer
updates her belief via signals on experience attributes that are received from previous
purchasers. Signals relate to the typical quality, “texture”, and “style” of products sold on
the website. There are various kinds of signals—including those from observations of use,
direct conversations, and online reviews—all of which can drive social learning for a
focal customer. We focus on local social learning; that is, learning that operates through
signals from physically close others who have made a prior purchase, all else held
constant.
Social scientists have a longstanding interest in how physically proximate neighbors
influence each other, i.e., so-called “neighborhood effect” and how it drives consumption,
investment and purchase decisions. In addition, recent studies pinpoint social learning as
a key mechanism underlying the observed neighborhood effects in categories where
agents face risk or uncertainty (Conley and Udry 2010; Duflo and Saez 2003; Sorensen
In the substantive domain of online retailing, contagion phenomena have been
documented (e.g., Bell and Song 2007; Choi, Hui, and Bell 2010) but the underlying
mechanisms largely unexplored. Local social learning is interactive (information senders
and recipients know each other) and visceral (McShane, Bradlow, and Berger 2012), so it
is potentially more powerful than learning via other sources such as online reviews and
Internet-mediated interaction (Choi, Bell, and Lodish 2012). Thus, a more detailed
elaboration of social learning as it relates to this important domain is needed.
1.2.3. Local Social Capital as a Moderator of Local Social Learning
In general terms, social capital is the ability of focal actors to secure collective, economic,
or informational benefits by virtue of social networks, trust, and other norms in a
community (Adler and Kwon 2002; Putnam 1995). In a review article, Nahapiet and
Ghoshal (1998) provide a conceptual summary and describe relational and structural
dimensions of social capital.9 In this study, we operationalize the relational dimension as
social trust and the structural dimension as frequency of interaction and provide
illustrative examples in Table 1.1. In Section 1.3, we develop our operational measure of
local social capital from the SCCBS and note its consistency with extant approaches in
the literature.
Prior work implies that a higher level of social capital leads to more efficient
information transfer (Reagans and McEvily 2003; Uzzi 1997). In our context, we
9 In an influential paper Adler and Kwon (2002) note that, for substantive and ideological reasons,
there is no “commonly agreed upon” definition of social capital that will suit all contexts. Thus, particular operational definitions may vary by discipline and level of investigation (Robison, Schmid, and Siles 2002). Our study therefore focuses on the relational and structural dimensions of social capital (Nahapiet and Ghoshal 1998) as they are a good conceptual fit to the mechanism, have operational variables available in the SCCBS, and as explained in Section 1.3, have
conjecture that local social capital enhances local social learning by affecting the
proportion of signals arising from previous purchases and the noise associated with
these signals. Specifically, we test whether higher levels of social capital reduce
inefficiencies in the social learning process. The theoretical prediction is very specific—
social capital operates on the information transformation process and there is no reason
to expect that it will have a direct effect on the rate of diffusion. Our empirical
specification mirrors this as we model the moderating effect on social learning while at
the same time controlling for a potential direct effect on diffusion (and we find it to be
insignificant).
There are three interesting aspects to this empirical test. First, as discussed in the
Introduction, geographic variation in the propensity of consumers to buy online is
explained by geographic variation in various neighborhood characteristics, e.g., offline tax
rates, presence of stores, and so on. We examine whether variation in this propensity is
related to the quality of interaction among members of a local community as well. Note
too, that the effect of neighborhood social capital is qualitatively different from these
other factors as it arises from the “multiplier” produced by previous purchases.
Second, previous studies relate social learning and individual characteristics such as
opinion leadership (Iyengar, Van den Bulte, and Valente 2011; Nair, Manchanda, and
Bhatia 2010). In contrast, we connect the efficiency of social learning to relational
characteristics between individuals. Third, most studies focus on benefits from social
capital accruing to community members; we show that Internet retailers (who are outside
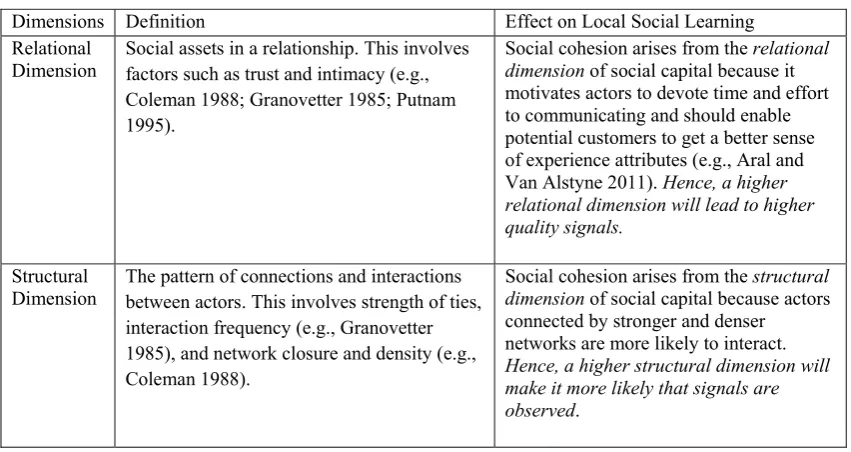
Table 1.1. Dimensions of Social Capital and Effects on Local Social Learning
Dimensions Definition Effect on Local Social Learning Relational
Dimension
Social assets in a relationship. This involves factors such as trust and intimacy (e.g., Coleman 1988; Granovetter 1985; Putnam 1995).
Social cohesion arises from the relational dimension of social capital because it motivates actors to devote time and effort to communicating and should enable potential customers to get a better sense of experience attributes (e.g., Aral and Van Alstyne 2011). Hence, a higher relational dimension will lead to higher quality signals.
Structural Dimension
The pattern of connections and interactions between actors. This involves strength of ties, interaction frequency (e.g., Granovetter 1985), and network closure and density (e.g., Coleman 1988).
Social cohesion arises from the structural dimension of social capital because actors connected by stronger and denser networks are more likely to interact. Hence, a higher structural dimension will make it more likely that signals are observed.
1.2.4. Summary and Testable Conjectures
We examine two new conjectures. First, that incomplete consumer knowledge about
experience attributes prior to trial is partially resolved through local social learning from
past local purchases made by others. Second, that local social capital reduces
inefficiencies in the local social learning process by improving the likelihood that signals
are: (1) observed by potential customers, and (2) less noisy. Finally, as noted previously,
it is important to recall that social capital does not, per se, make purchases more likely.
Rather, it improves the efficiency of the learning process itself. In instances where the
social learning process results in favorable updating, i.e., potential customers come to
learn that the product is better than they might have initially imagined, sales will be
1.3. Research Setting, Data, and Measures
1.3.1. General Condition and Research Setting
Our data for the empirical application need to satisfy two conditions. First, the products
need to have experience attributes, and second, consumers should have incomplete
consumer knowledge about experience attributes exante. Our data from Bonobos.com,
an iconic Internet-based fashion retailer, satisfies these conditions. (More details about
Bonobos’ origins are provided shortly.)
In the apparel category fit, feel, and style are very important to consumers (Kwon,
Paek, and Arzeni 1991) and these attributes are by definition experience attributes and
non-verifiable pre-purchase when consumers buy online for the first time (Park and Stoel
2002). Since Bonobos.com targets trendy and fashion-forward males, the importance of
these attributes is amplified. (Industry observer TechCrunch.com refers to the target
customer as a “hip, semi-athletic, 25-to-40 year old guy.”—See
http://techcrunch.com/2010/12/16/bonobos-raises-18-5-million-metrosexuals-unite/ for
details.)
By way of additional background, Bonobos.com has manufactured and sold
fashionable men’s apparel under their own brand online since October 2007. Unique
pants are their signature product—even several years after launch—the site leads with
“Pantsformation—Fit changes everything” (see http://www.bonobos.com/welcome/n). As
Bonobos grew, they established offline “guide shop” stores in Boston, Chicago,
Georgetown and San Francisco and in April 2012 Bonobos also partnered with
Nordstrom. Nordstrom contributed $16m in capital and agreed to carry Bonobos products;
consumers but also provide consumers with an opportunity to “touch and feel” the
products before purchase.10 (As noted below, our data precede these moves into offline
retail.)
1.3.2. Data
The data come from three sources: (1) monthly observations on the number of purchases
at Bonobos.com from October 2007 (when the site opened) to March 2011, (2) social
capital data from SCCBS, and (3) zip-level demographic information and information on
spending at offline retailers from the 2010 ESRI Business Database. Summary statistics
for the key variables (all described subsequently) are given in Table 1.2.
Purchase data at Bonobos.com. Our dependent variable is the number of new trials in a zip code for each period since the site opened, i.e., an aggregate count of individual
customer trials from inception of the site. As such, the data do not suffer from
“left-censoring”. We focus on trials, because pre-trial customers have no direct experience, i.e.,
we deliberately model decisions of consumers who have incomplete knowledge about
experience attributes ex ante. (The data we use pre-date the period where Bonobos
products were made available at either “guide shops” or local Nordstrom stores, so there
is no alternative channel where consumers can “touch and feel” the products prior to
purchase; see also, Section 1.3.2). Specifically, we analyze data for 42 months from
launch (October 2007 through March 2011), during which time more than 40,000
customers tried Bonobos.com.
The lagged number of total transactions in a zip code (the sum of trial and repeat
transactions) is a key independent variable that serves two control roles. First, it is the
source of local signals on experience attributes in the local social learning process (see
Section 1.4.1). Second, it controls the potential confounding effects of temporal, spatial,
and time-varying spatial influences on the social learning process as well as social
influence through mechanisms other than social learning (see Section 1.4.2).
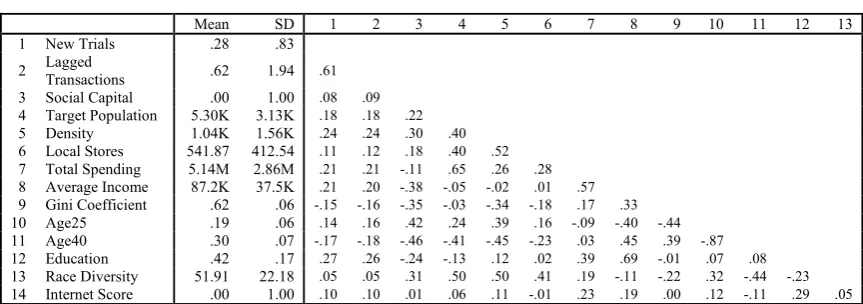
Table 1.2.Descriptive Statistics for Model Variables
Mean SD 1 2 3 4 5 6 7 8 9 10 11 12 13 1 New Trials .28 .83
2 Lagged Transactions .62 1.94 .61
3 Social Capital .00 1.00 .08 .09
4 Target Population 5.30K 3.13K .18 .18 .22
5 Density 1.04K 1.56K .24 .24 .30 .40
6 Local Stores 541.87 412.54 .11 .12 .18 .40 .52
7 Total Spending 5.14M 2.86M .21 .21 -.11 .65 .26 .28
8 Average Income 87.2K 37.5K .21 .20 -.38 -.05 -.02 .01 .57
9 Gini Coefficient .62 .06 -.15 -.16 -.35 -.03 -.34 -.18 .17 .33
10 Age25 .19 .06 .14 .16 .42 .24 .39 .16 -.09 -.40 -.44
11 Age40 .30 .07 -.17 -.18 -.46 -.41 -.45 -.23 .03 .45 .39 -.87
12 Education .42 .17 .27 .26 -.24 -.13 .12 .02 .39 .69 -.01 .07 .08
13 Race Diversity 51.91 22.18 .05 .05 .31 .50 .50 .41 .19 -.11 -.22 .32 -.44 -.23
14 Internet Score .00 1.00 .10 .10 .01 .06 .11 -.01 .23 .19 .00 .12 -.11 .29 .05
Note: In the analysis we standardize all non-dummy variables aside from Lagged Transactions.
Social capital data from the SCCBS. The SCCBS was undertaken by the John F. Kennedy School of Government, Harvard University between July 2000 and February
2001 and the data are widely used by social science researchers. Published articles report
effects of local social capital on local behaviors such as home ownership (Hilber 2010),
labor force choices (Aguilera 2002), social vulnerability (Cutter, Boruff, and Shirley
2003), and public health (Harpham, Grant, and Thomas 2002). Documentation for the
SCCBS describes it as the “first attempt at systematic and widespread measurement of
Our key zip-level social capital measures for the main model and falsification tests
were extracted from the SCCBS. Specifically, we utilized questions relating to the two
dimensions of social capital described in Table 1.1: (1) trust among local neighbors
(relational dimension), and (2) the frequency of interaction between neighbors (structural
dimension).The local trust and interaction scores are simple averages of the relevant
survey questions (e.g., “How much do you trust neighbors?”) in the SCCBS. Section
1.8.1 (Appendix) provides the details. The neighborhood social capital measure is, in turn,
a simple average of trust and interaction frequency, consistent with the standard concepts
in the literature (Burt 1992; Marsden and Campbell 1984) and with empirical studies that
utilize the SCCBS (e.g., Hilber 2010).
Data on neighborhood characteristics. Zip code characteristics and the aggregated individual demographics of zip residents serve as controls in the empirical analysis
(Brynjolfsson, Hu, and Rahman 2009; Forman, Ghose, and Goldfarb 2009). Our control
variables are constructed from data purchased from ESRI in Redlands, CA and are
available through the 2010 ESRI Demographics and Business Database (see
http://www.esri.com/data/esri_data/demographic-overview for details). Specific variables
describing zip code characteristics are: Target Population (total number of 25-45
year-old males in the zip code), Population Density (target density per square mile), Local
Stores (number of offline clothing stores in the 3-digit zip code area). Non-metro Area,
Near-suburb Area, and Far-suburb Area dummies control for the geographic proximity
of the focal zip to city centers.
Variables aggregated from individual demographics of zip residents are: Total
c p t t h I F 1 W s 1 o I
code as estim
population)
than 25), Ag
target demo
have a gradu
Internet Sco
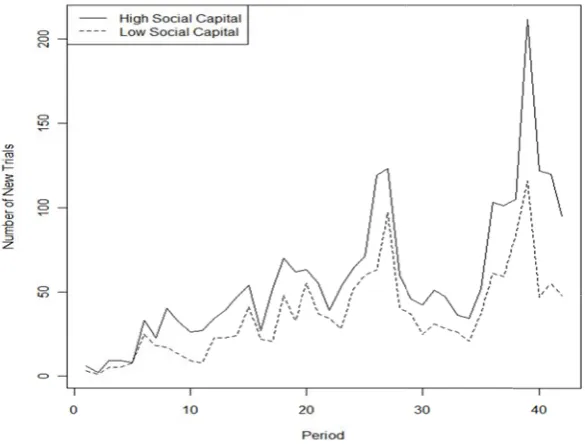
Figure 1.1.
Note:
1.3.3. Comb
We study ho
so we focus
11 See http://w on Race Diver Internet usage
mated by E
, Gini Coeff
ge40 (propo
ographic), E
uate degree
ore (a proxy
The Numb
: The peaks a
bined Data
ow a previo
s on 495 zip
www.esri.com/ rsity. Internet e and the zip-le
SRI), Avera
fficient (inco
ortion of mal
Education (p
), Race Div
y for Interne
ber of New
at month 27 a
a for Analys
ous trial influ
codes wher
/library/whitep Score is opera evel average p
age Income
ome inequali
les over the
roportion of
ersity (the d
et use and re
Trials in H
and 39 are D
sis and Des
uences pote
re the SCCB
papers/pdfs/div ationalized as participation in
(average an
ity), Age25
e age of 40, i
f people wh
diversity me
eliance on on
High Versus
ecember of 2
criptive Pa
ential subseq
BS is condu
versity-index-the average of n online discus
nnual incom
(proportion
i.e., those so
ho are “high
easure defin
nline inform
s Low Socia
2009 and 201
atterns
quent trials b
ucted and at
-methodology. f the zip-level ssions as recor
me among the
n of males ag
omewhat ou
ly educated
ed by ESRI
mation).11
al Capital Z
10, respective
by local nei
least one cu
.pdf for the inf average frequ rded in the SC
within the 42-month period after the site was launched. Thus, the data consist of 20,790
zip-month observations on the number of new customers. The SCCBS covers 1,104 zip
codes so it is possible that the 609 (1,104 – 495) zip codes with no trials at all are
somehow different from the 495 zip codes used in estimation, with respect to social
capital status. To check that this is not the case we estimate a binary choice model of
having at least one trial, using data from all 1,104 zips (see Section 1.8.2). There is no
effect of neighborhood social capital in this model, confirming that there is no “selection”
of zips with buyers versus no buyers, on the basis of neighborhood social capital. We also
fitted a model with the entire 1,104 zip codes in Section 1.8.3 (Appendix).
These data are not geographically condensed as the 495 zip codes span 23 different
states and 201 different cities. By virtue of where the SCCBS was conducted, the data
exclude New York City and Los Angeles—two locations where Bonobo.com has high
sales. This strengthens our study because it means that the findings will not be skewed by
particularly “high growth” locations where sales are potentially driven by other
mechanisms (such as the fashion orientation of the community and so on). Furthermore,
it removes Manhattan zip codes and makes it extremely unlikely that potential customers
in our sample are visiting Bonobos.com headquarters on 25th Street and evaluating
products in person.12
Figure 1.1 is a model-free view of trial evolution based on the final dataset. It
compares the number of new trials in each time period in zips that are in the top one-third
based on their social capital scores (165 zips) with the number in the bottom one-third
(165 zips). In both groups, the number of new trials increases over time (p < .001).
Furthermore, in every period, the number of new trials in zips with higher social capital
tends to be greater than the number of new trials in zips with lower social capital (p
< .001). Absent a formal model (see Sections 1.4 and 1.5) this is not conclusive evidence
of our proposed effects, but it is nevertheless interesting to observe such a clear pattern in
the raw data.
1.3.4. Steps Taken to Mitigate Threats to Validity
Our research setting and data provide us with an opportunity to identify social learning
while at the same time offering protection from the four standard threats to validity in
social contagion studies. First, we avoid truncation bias (see Van den Bulte and Iyengar
2011) by estimating the trial model on all potential consumers in the risk set of 495 zip
codes, not just those who ultimately made a purchase in the 42-month data window.
Second, we avoid simultaneity bias by using the lagged rather than contemporaneous
number of total transactions in a neighborhood. Third, endogenous group formation is not
a credible threat to validity because individuals do not decide on where to live based on a
neighbor’s trial of a specific website. Of course, we also control for observed and
unobserved factors that vary by location. Fourth, by using the lagged number of total
transactions in a neighborhood as a control on correlated unobservables between
neighbors, we mitigate potential bias arising from the Bayesian learning mechanism (see
1.4. Model
Individual consumers make a binary decision every period—to try Bonobos.com or not—
on the basis of the expected utility from trial. The overall utility that consumer j in zip
code i obtains by trying Bonobos.com at period t is
Uijt UijtE U ijt
D
ijt, where
ijt~ IID Standard Gumbel Distribution. (1.1)
UijtE denotes random utility under incomplete knowledge about experience attributes.
This utility component evolves through social learning and information acquisition on
experience attributes. denotes deterministic utility and is unrelated to the social
learning process. As explained shortly, deterministic utility serves as a control to help
identify social learning and establish its significance. Finally,
represents the
individual- and time-specific random errors that are not observed
1.4.1. Experience Attributes and the Social Learning Process
Random utility on experience attributes. We assume that there is general agreement about the objective quality of Bonobos.com products (in texture, style, color, etc.) among
consumers who have tried them. We denote this by Q. For potential consumers,
knowledge of Q (how good the texture is, how fashionable the color is, etc.) is a key
input to the trial decision. However, when shopping online, potential consumers are not
fully informed of Q because they cannot physically verify experience attributes. Thus,
they form beliefs aboutQ.
Let Qijtdenote the belief about experience attributes for consumer j in zip code i at
period t who has yet to try Bonobos.com. Beliefs relate to products only not
D ijt
U
ijt
Bonobos.com “service”. This is reasonable because in the period 2007-2011 in the United
States there should be no uncertainly about the legitimacy of the site, e.g., Bonobos.com
is not going to take orders and then not fill them. In addition, the “Fast and free shipping.
Insanely easy returns”13 promise eliminates uncertainty about service-dependent
experience attributes.
Random utility on experience attributes for consumer j in zip i at time t is14:
UijtE Q
ijt. (1.2)
Social learning as Bayesian learning. Uncertain beliefs about experience attributes
( ) are represented by a distribution:
, (1.3)
where Q0 is the mean of initial belief distribution before trial. Initial uncertainty is set to
1 for identification. The prior belief comes from local signals emanating from previous
purchases by local neighbors. Of course social learning alone cannot fully resolve
uncertainty, which is resolved only when the product is tried on.
Because they are based on actual purchases, local signals convey information about
average objective quality of experience attributes, but these observed signals do not
13 See http://www.bonobos.com/welcome/n (top left) and especially
http://www.bonobos.com/about/ where it states: “Free both ways. Always.” under “Free Shipping” and “Return anything, any time, any reason.” under “Painless Returns”.
14 We can also define
UijtE as a quadratic function of the uncertain belief rather than a linear
function to allow for a flexible specification with respect to risk (Erdem and Kean 1996;
Narayanan, Manchanda, and Chintagunta 2005). Here, the risk aversion parameter is theoretically estimable, but with a single category data it is hard to know how meaningful this is. We estimated the quadratic model and found that the risk aversion parameter was not significant (p = .45), and that the substantive findings were unchanged. Details are available from the authors upon request.
Qijt
perfectly represent Q. This is because: (1) previous buyers who are sources of signals
might differ in their assessments of the average quality of Bonobos.com products
depending on their experience, and (2) some information could be “lost in translation” in
the sense that a prior buyer may not be able to fully express their assessments of the
products to recipients. Given this, the kth local signal in zip code i at time t, , is:
ikt ikt ikt
S Q u v , where and . (1.4)
ikt
u allows assessments of quality in zip code i at time t to vary by different purchases (k);
similarly, vikt allows for individual-level variability in signal transmission. Spatial
variation in the random components of signals is captured by 2
ui
and 2
vi
which vary over
zip codes. Assuming independence between the two errors, we write Equation (1.4) as:
. (1.5)
As analysts, we cannot observe signals directly, so we assume that the number of signals
sent in a location is proportional to the number of transactions there in the previous
period.15
Now, let Nit1 denote the lagged number of local transactions in zip code i at period
t-1. Our assumption implies that the number of observed signals is iNit1 where i
denotes the proportion of signals arising from the lagged local purchases (Nit1). Spatial
variation in the observability of signals, (perhaps stemming from spatial variation in local
relationships), is captured by which varies over zip codes. Potential consumers update
15 Narayanan, Manchanda, and Chintagunta (2005) assume that the number of signals that a physician observes on the quality of a prescription drug is proportional to the dollars spent on marketing efforts.
ikt
S
uikt ~N(0,
ui2) ~ (0, )2ikt vi
v N
2 2
~ ( , )
ikt ui vi
S N Q
i
their prior beliefs in a Bayesian fashion so that the uncertain belief about Q in zip code i
at time t (Qijt) is:
, (1.6)
where the variance ( ) and the mean ( ) of the posterior belief are as follows:
, , and .
We write the posterior mean and variance in terms of because , , and are not
separately identified, but identified only up to . (The over-parameterized model, while
not directly estimable, is helpful for exposition.) Most straightforwardly,
represents
the “inefficiency of social learning” because as it increases, potential consumers place
less weight on local information. Thus, the smaller the value of the more quickly Qijt
converges to the true Q, or, alternatively, the more efficient the social learning process.
The over-parameterized model also helps in showing that the effect of local social
capital on information transfer is unambiguous. Specifically, in Section 1.2 we
conjectured that social capital boosts the “observability” of signals and reduces noise in
information transmission, i.e., that it increases and decreases , respectively. (The
nature of social relationships has no effect on variation in the assessment of Q, i.e., no
effect on ). Thus, by increasing i and decreasing , an increase in social capital
must lead to a smaller value of as
2 2
2 ui vi
i i
. We test this empirically by specifying:
Qijt ~N(Qijt,
ijt2)2
ijt
Q
ijt1 1 2 2 1 1 1 t ijt i i N
1 1 2 2 2 1 11 Nit
ijt
ijt ijt kit
k ijt i
Q
Q S
2 22 ui vi
i i 2 i
2 ui
2 vi
i
0 1
log( )i SCi, where SCi is social capital in zip code i. (1.7)
Zip-level variables are mean-centered so log(i) =0 when zip i has an average amount
of social capital, i.e., SCi= 0. Since social capital reduces inefficiency in social learning,
we expect that 1 < 0.
1.4.2. Deterministic Utility and Means of Identifying Social Learning
Deterministic utility (Equation 1.1) is unrelated to social learning. While not of central
interest, it nevertheless serves to control for confounds that might affect our ability to
measure the social learning process, and the moderating role of social capital as well.
To control for correlated unobservables, we specify temporal, spatial and
time-varying spatial effects that are separate from the effects of social learning, and the
moderating role of social capital on social learning. It could be the case, for example, that
consumers in cities with more opportunities for socializing prefer Bonobos.com. If this
were true, an observed correlation between the propensity to try and the number of
previous trials in the local community could simply reflect local preferences and not a
causal effect of prior trials on current behavior. Since we focus on social learning as a
specific mechanism of social influence we need to control for awareness dispersion,
social conformity, network externality, as they are competing mechanisms. Thus, we
specify:
UijtE
0tXi12SCi
01SCi
Nit1it. (1.8)is the period-specific intercept and controls global period effects unrelated to social
learning, e.g., an increase in customer trials from (locally untargeted) marketing activities
0t
such as press coverage, via a flexible semi-parametric approach. is a vector of
observed zip-level characteristics (see Table 1.2) as well as two-digit zip fixed effects16
and 1 are the corresponding parameters. SCi is zip-level neighborhood social capital,
and its direct impact on the utility is captured by 2 and our theory of the mechanism
predicts 2 = 0.
Lagged local transactions ( ) control for types of social influence other than
social influence through social learning (e.g. awareness diffusion, social conformity,
network externality, etc.), and their effects are captured by . We allow them to
vary with social capital to prevent the effect of social capital on social learning ( ) from
being confounded by its potential moderating effect on the other social contagion
mechanisms ( ).
Finally, represents unobserved spatial and time-varying spatial effects. Here too
we use to control because time-varying spatial effects are typically
auto-regressive trends so factors affecting will also be correlated with lagged local
transactions. For instance, suppose a zip code is revitalizing and over time residents have
come to desire more fashionable apparel. This would increase over time, so is a
reasonable control for ; hence, Equation 1.8 becomes:
0 1 2 ( 0 1 ) 1 ( 0 1 ) 1
D
ijt t i i i it i it
U
X
SC
SC N
SC N , (1.9)
16 Ideally, we could include five digit zip code-period specific fixed effects to control for potential correlated unobservables (Narayanan and Nair 2012); however, given the non-linearity of our model this will yield an inconsistent estimator with unconditional estimation methods (Arellano and Honore 2001).
X
i1
it
N
0 1SCi
1
1
it
1
it
N it
it
it
Nit1
it
0t Xi 1 SCi 2 0 0 1 1 SC Ni it 1
,
0t Xi 1 2SCi 3Nit 1 4SC Ni it1
.
In Equation 1.9, 0 and 0 (1 and 1) are not separately identified, but identified
only up to
3 and . The equation clearly shows how lagged local transactions help withcorrelated unobservables and time-varying spatial trends in error term, .17
1.4.3. Expected Utility Function and Aggregate Model of Trial
Since Uijt is a random variable from a consumer’s prospective, the consumer makes
trial decisions so as to maximize expected utility,E
Uijt , where:E
Uijt E
UijtE U ijtD
ijt E
Qit Uijt Dijt (1.10)
Qit
0tXi
1 2SCi
3Nit1
4SC Ni it1
ijt.From Equation 1.1, the probability that consumer j in zip i tries Bonobos.com at period t
is:
.
(1.11)
Our dependent variable is Yit, the number of trials in a neighborhood (zip code) and is
the aggregate of individual trial behavior. It follows a Poisson distribution as an approximation of a Binomial distribution. This is because given a large population size
and a small event probability a Binomial distribution with parameters (n p, ) can be
17 As with Equation 1.8, the interaction effect of social capital on the time-varying spatial pattern is included to prevent the effect of social capital on social learning ( ) from being confounded by any potential interaction effect between and social capital on i.e., via .
4it
0 1 2 3 1 4 1
0 1 2 3 1 4 1
exp( )
Pr
1 exp( )
it t i i it i it
ijt
it t i i it i it
Q X SC N SC N
Q X SC N SC N
1 1 it
expressed as a Poisson distribution with the parameter np.18 The likelihood of observing
it
y is:
, where ij MitPrit. (1.12)
where Mit denotes the observed number of non-triers in zip code i at time t.
To estimate the model we simulate 50 draws for signals, and compute the entire belief
vector on the quality of experience attributes for these draws. Next, we compute the
conditional likelihood of observing for all observations under different combinations
between 50 different strings of . The unconditional zip-level likelihood of observing
is obtained by sequentially integrating conditional over
conditional over signal samples through Monte Carlo simulation. We estimate the
parameters by maximizing the integrated likelihood.
1.4.4. Identification of Parameters
Observations with no local signals (i.e., before the first trial in the zip), identify .
Similarly, Q is identified with the observations under steady state, i.e., when there are
sufficiently large numbers of signals such that there is little updating; in our data the
cumulative number of signals reaches 525 so we can assume that steady state is
achieved.19 (Equation 1.7), the average inefficiency in information transferred is
identified from the pattern of increase in trials. (Equation 1.7), the effect of social
18 These two conditions are met in our data: The range of the observed number of subjects at risk, i.e., target customers, in a zip code is [451, 19321] and the range of the empirical hazard rate is [0,0.009].
19 Figure 1.3a is additional evidence that the steady state is achieved in our data set. It shows that there is little change in utility when cumulative number of signals reaches around 100.
exp( ) Pr( ) ! it y it it it it it Y y y it y
Q
it 1 2 [ ... ]i i i iT
y y y y yit
capital on the inefficiency of information transferred, is identified from the differences in
the cross-sectional variability of the pattern of increase in trials under different levels of
social capital.
In the deterministic utility component, the average effect of lagged local transactions
( ), is separately identified from the social learning process from the observations in the
steady state. The interaction effect between social capital and lagged local transactions
( ) is identified from the differences in sales evolution patterns by social capital under
steady state.
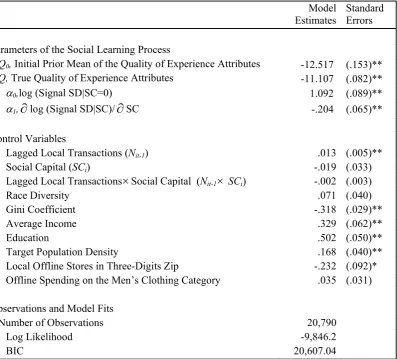
1.5. Empirical Findings
Table 1.3 shows the parameter estimates. They suggest that: (1) local social learning is at
work, and (2) neighborhood social capital moderates the social learning process by
reducing inefficiency in information transfer. The effects are statistically and
economically significant and in Sections 1.5.2 and 1.5.3, we report falsification tests and
robustness checks, respectively.
Statistical significance of the social learning process is established when the model
indicates that consumers enjoy significantly better expected utility from trial as a result of
social learning, and it is based on the interplay of several parameters (Q , 0 Q, 0, and
1
). This is identical to saying that the local social learning process is statistically
significant when an additional local transaction significantly increases pre-trial expected
utility; thus, we use a Bootstrap method to quantify the marginal utility increase from an
additional local transaction. In Figure 1.2a the solid line is the marginal utility increase
from an additional local transaction under the average level of social capital (mean-
3