© 2018 IJSRST | Volume 4 | Issue 2 | Print ISSN: 2395-6011 | Online ISSN: 2395-602X Themed Section: Science and Technology
Effects of Specific Training on Selected Physical and
Physiological Variables among College Level Men Players
Dr. Koushik Bhowmik
Lecturer, Michael Madhusudan Dutta College, Tripura(s), India
ABSTRACT
The purpose of the study was to determine the effect of specific training on selected physical and Physiological variables among college level men players. To achieve the purpose thirty men players were randomly selected from the Maruthi College of Physical Education and Ramakrishna Mission Vivekananda University, Periyanaickenpalayam, Coimbatore. The age of the subject ranged from 18 to 24 years. The selected subjects were divided into two groups such as group-A experimental group and group-B control group, each group consisting of 15 subject. The experimental group underwent specific training. The following criterion variables were selected for the physical variables namely, speed, agility and leg explosive power and for the physiological variables such as breath holding time and resting heart rate. The training period was for eight weeks except on Saturdays and Sundays in every week. Data were collected from each subject before and after the eight weeks of specific training. The collected data were statistically analyzed by using „t‟ ratio. It was found that there is significant improvement in speed, agility and leg explosive power due to the treatment of specific training. It was also found that there is significant improvement in breath holding time and resting heart rate due to the treatment of specific training.
Keywords: Specific training, Physical variables and physiological variables.
I.
INTRODUCTION
A sport is an organized, competitive, entertaining and skillful physical activity requiring commitment, strategy and fair play in which a winner can be defined by objective means. It is governed by a set of rules or customs. In sports the key factors are the physical capabilities and skills of the competitor when determining the outcome (winning or losing). Sports are most often played just for fun or for the simple fact that people need exercise to stay in good physical condition. However, professional sport is a major source of entertainment. While practices may vary sports participants are expected to display good sportsmanship and observe standards of conduct such as being respectful of opponents and officials and
congratulating the winner when losing (Douglas Harper, 2008).
TRAINING
Training is an educational process. People can learn new information, re-learn and reinforce existing knowledge and skills, and most importantly have time to think and consider what new options can help them improve their effectiveness at work. Effective trainings convey relevant and useful information that inform participants and develop skills and behaviors that can be transferred back to the workplace.
extends to a number of days and even months and years. The term 'Training' is widely used in sports. There is, however, some disagreement among sports coaches and also among sports scientists regarding the exact meaning of this word. Some experts, especially belonging to sports medicine, understand sports training as basically doing physical exercises.
SPORTS TRAINING
Sports' training is done for improving sports performance. The sports performance, as any other type of human performance, is not the product of on single system or aspect of human personality. On the contrary, it is the product of the total personality of the sports person. The personality of a person has several dimensions e.g., physical, physiological, social and psychic. In order to improve sports performance the social and psychic capacities of the sports person also have to be improved in addition to the physical and physiological ones. In other words the total personality of a sportsman has to be improved in order to improve his performance. Sports' training, therefore, directly and indirectly aims at improving the personality of the sportsman. No wonder, therefore, sports training is an educational (i.e., pedagogical) process.
"Sports training is a planned and controlled process in which, for achieving a goal, changes in complex sports motor performance, ability to act and behavior are made through measures of content, methods and organization". [Martin, 1979]
SPECIFIC TRAINING
Specificity is the principle of training that states that sports training should be relevant and appropriate to the sport for which the individual is training in order to produce a training effect.
The Specificity Principle simply states that training must go from highly general training to highly specific training. The principle of Specificity also
implies that to become better at a particular exercise or skill, you must perform that exercise or skill. To be a good cyclist, you must cycle. The point to take away is that a runner should train by running and a swimmer should train by swimming.
PHYSICAL FITNESS
Today, there is a growing emphasis on looking good, feeling good and living longer. Increasingly, scientific evidence tells us that one of the keys to achieving these ideals is fitness and exercises. Getting moving is a challenge because today physical activity is less a part of our daily life. There are fewer jobs that require physical exertion. We have become a mechanically mobile society, relying on mechanics rather than muscle to get around. In addition, we have become a nation of observers with more people spending their leisure time pursuing just that-leisure. Consequently, statistics show that obesity and overweight, the problems that come with high blood pressure, diabetes, cardiac arrest, etc. are on the rise. But statics also show that preventive medicine pays off, so one should not wait until his/ her doctor give an ultimatum. Everyone must take the initiative to get active now.
The decision to carry out a physical fitness program cannot be taken lightly. It requires a lifelong commitment of time and effort. Exercise must become one of those things that you do without question, like bathing and brushing your teeth. Unless you are convinced of the benefits of fitness and the risk of unfitness, you will not succeed. It has been realized that fitness adds not only years to one‟s life, but life to one‟s years.
SPEED
AGILITY
The ability to perform a series of explosive power movements in rapid succession in opposing directions (zig zag running or cutting movements).
LEG EXPLOSIVE POWER
“Explosive power combination of strength and speed abilities. It can be defined as the ability to overcome resistance with high speed” (Hardayal Singh, 1995).
II.
PHYSIOLOGY
Physiology is the study of the functions of the normal human body. Physiology is one of the bio-medical science, it deals with the functions of the living organism, its systems, organs, individual cell and cell structures, as well as with the mechanism regulating the functions and interaction of the organism with the external environment. The goal of physiology is to gain in right in to the machinery of the human organism.
BREATH HOLDING TIME
Breathing is the most “taken for granted” function of the body. Even in our present age of physical fitness, breathing is hardly ever discussed. Instead, emphasis is placed on the circulatory and muscular systems since they are considered more important. The respiratory muscles, however, should be exercised separately in the same manner as players develop other muscles of the body.
RESTING HEART RATE
In general, higher the resting heart rate is indicating the less physically fit and lower the heart rate, the more physically fit is ensured. (Some athletes have resting heart rates in the 40s). If the training workouts are effective the resting heart rate will slowly decrease or at least remain constant. Resting heart rates can also be affected by ensuing illness and overtraining. When the resting heart rate has
increased, the players must decrease the workout frequency or intensity.
HYPOTHESIS
1) It was hypothesized that there will be a significant difference on the effect of specific training on selected physical variable Speed ,Agility, Leg Explosive power among college men players.
2) It was hypothesized that there will be significant difference on the effect of game specific training on selected physiological variables Breath Holding Time, Resting Heart Rate, among college men players.
III.
METHODOLOGY
The purpose of the study was to determine the effect of specific training on selected physical and Physiological variables among college level men players. To achieve the purpose thirty men players were randomly selected from the Maruthi College of Physical Education and Ramakrishna Mission Vivekananda University, Periyanaickenpalayam, Coimbatore. The age of the subject ranged from 18 to 24 years. The selected subjects were divided into two groups such as group-A experimental group and group-B control group, each group consisting of 15 subject. The experimental group underwent specific training. The following criterion variables were selected for the physical variables namely, speed, agility and leg explosive power and for the physiological variables such as breath holding time and resting heart rate. The training period was for eight weeks except on Saturdays and Sundays in every week.
SELECTION OF VARIABLES Independent variable
1) Speed 2) Agility
3) Leg Explosive power
Physiological Variables 1) Breath Holding Time 2) Resting Heart Rate
EXPERIMENTAL DESIGN
For this study, thirty men players were randomly selected from the Maruthi College of Physical Education and Ramakrishna Mission Vivekananda University, Periyanaickenpalayam, Coimbatore. The selected subjects were divided into two groups such as
group-A experimental group and group-B control group, each group consisting of 15 subject. The experimental group underwent specific training. The following criterion variables were selected for the physical variables namely, speed, agility and leg explosive power and for the physiological variables such as breath holding time and resting heart rate. The training period was for eight weeks except on Saturdays and Sundays in every week.
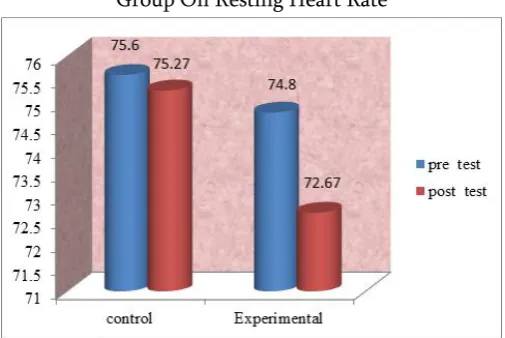
The investigator selected the following test items as criterion measures. Table 1 depict the process.
Table 1. Tools And Technique
Sl.No. Variables Tests Measuring units
Physical Variables
1. Speed 50m dash Seconds 2. Agility T-test Seconds 3. Leg explosive power Standing broad jump In meters
Physiological Variables
4. Breath Holding Time Stop Watch In sec
5. Resting heart Rate Manual Count
TRAINING SCHEDULE
The investigator selected a training that is specific training for common players which improved certain selected physical and physiological variables namely speed, agility, leg explosive power, breath holding time, resting heart rate. As the result of specific training the physical and physiological level of the college men players would improve. Keeping the above things in mind the investigator following schedule of training is designed. The specific training package was specifically designed to improve the men common playing ability and fitness level of the men players. The specific training packages designed by the investigator of the study was administered For a period of eight weeks, five days a week, one session
each day, each session lasted for 90minutes to the experimental group.
STATISTICAL TECHNIQUE
The following statistical procedure was employed to estimate the effect of specific training on selected physical and Physiological variables among college level men players. „t‟ ratio was calculated to find out the significant of the difference between the mean of pre and post-test of the groups.
IV.
RESULTS AND DISCUSSION
Table 2. Table Showing The Mean Difference, Standard Deviation And „T‟ Value Of Control Group And Experimental Group On Speed
Variables Group Name Mean Sd Sd
Error „t‟ ratio
Table Value Pre Post Pre Post
Speed Control 6.85 6.86 0.14 0.17 0.04 0.98 2.15 Experimental 6.83 6.42 0.13 0.19 0.04 9.02*
*Significance at .05 level of confidence
The table 2 shows that the mean values of pre-test and post-test of control group in speed were 6.85 and 6.86 respectively. The obtained „t‟ ratio was 0.98 since the obtained „t‟ ratio was less than the required table 2.15 for the significant at 0.05 level with 14 degrees of freedom. It was found to be statistically insignificant. The mean values of pre-test and post-test of experimental groups in speed were 6.83 and 6.42 respectively. The obtained „t‟ ratio was 9.02 since the obtained „t‟ ratio was greater than the required table value of 2.15 for significance at 0.05 level With 14 degrees of freedom it was found to be statistically significant . The result of the study showed that there was a significant difference between control group and experimental group in speed. It may be concluded from the result of the study that experimental group improved in speed due to eight weeks of specific training.
Pre- test and post -test mean values of control and experimental groups on speed stand presented in figure 1
Figure 1. Cylinder Diagram Showing The Pre And Post Mean Value Of Experimental Group And Control Group On Speed
The data obtained on agility as a result of specific training were analyzed using the „t‟ ratio and are presented in table 3.
Table 3. table showing the mean difference, standard deviation and „t‟ value of control group and experimental group on agility
Variables Group Name
Mean
Sd
Sd
Error
‘t’
ratio
Table
Values
Pre
Post Pre
Post
Agility
Control
7.81
7.80 0.16 0 .15
0.04
0.42
2.15
Experimental 7.78
7.29 0.24 0 .31
0.08
5.87*
*Significance at .05 level of confidence
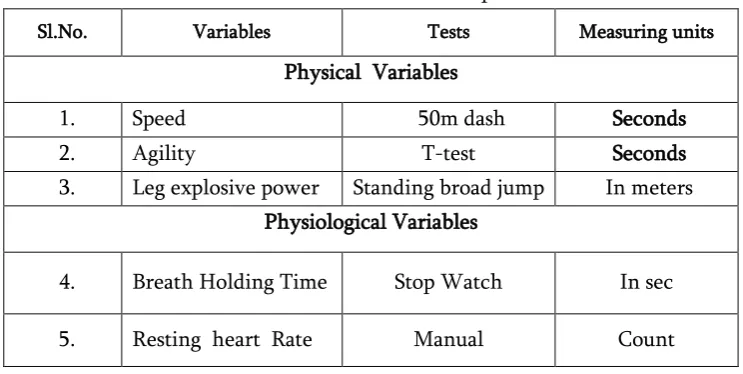
The Table 3 shows that the mean values of pre-test and post-test of control group in Agility were 7.81 and 7.80 respectively. The obtained „t‟ ratio was 0.42 since the obtained „t‟ ratio was less than the required
7.29 respectively. The obtained „t‟ ratio was 5.86 since the obtained „t‟ ratio was greater than the required table value of 2.15 for significance at 0.05 level with 14 degrees of freedom it was found to be statistically significant .The result of the study showed that there was a significant difference between control group and experimental group in agility. It may be concluded from the result of the study that experimental group improved in agility due to eight weeks of specific training.
Pre- test and post -test mean values of control and experimental groups on agility stand presented in figure 2
Figure 2. Cylinder Diagram Showing The Pre And Post Mean Value Of Experimental Group And Control
Group On Agility
The data obtained on leg explosive power as a
result of specific training were analyzed using the ‘t’
ratio and are presented in table -IV.
Table 4.
Table Showing The Mean Difference, Standard Deviation And ‘T’ Value Of Control Group And
Experimental Group On Leg Explosive Power
Variables Group Name Mean Sd Sd Error
„t‟ ratio
T Values Pre Post Pre Post
Leg Explosive Power
Control 2.41 2.51 0.15 0.22 0.04 0.73
2. 15 Experimental 2.38 2.69 0.10 0.17 0.03 3.06*
*Significance at .05 level of confidence
The table IV shows that the mean values of pre-test
and post-test of control group in Leg Explosive
power were 2.41 and 2.51 respectively. The
obtained ‘t’ ratio was 0.73 since the obtained ‘t’
ratio was less than the required table 2.15 for the
significant at 0.05 level with 14 degrees of freedom.
It was found to be statistically insignificant. The
mean values of pre-test and post-test of
experimental groups in Leg Explosive power were
2.38 and 2.69 respectively. The obtained ‘t’ ratio
was 2.10 since the obtained ‘t’ ratio was greater
than the required table value of 2.15 for
significance at 0.05 level With 14 degrees of
freedom it was found to be statistically significant .
The result of the study showed that there was a
significant difference between control group and
Figure 3. Cylinder Diagram Showing The Pre And Post Mean Value Of Experimental Group And
Control Group On Leg Explosive Power
The data obtained on breath holding time as a result
of specific training were analyzed using the ‘t’ ratio
and are presented in table -V.
Table 5. Table Showing The Mean Difference, Standard Deviation And „T‟ Value Of Control Group And Experimental Group On Breath Holding Time
Variables Group Name Mean Sd Sd Error
„t‟ ratio
Table Values Pre Post Pre Post
Breath holding Time
Control 45.37 45.38 3.05 3.05 0.79 0.07
2. 15 Experimental 45.45 48.12 3.35 2.99 0.77 2.49*
*Significance at .05 level of confidence
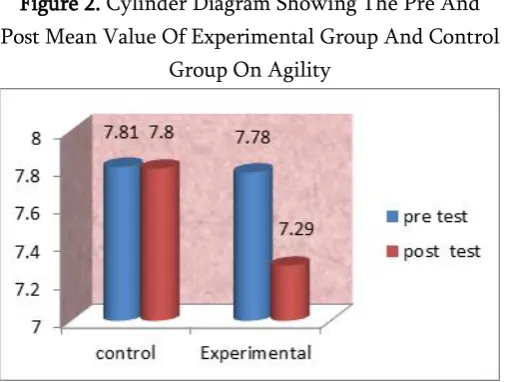
The table V shows that the mean values of pre-test and post-test of control group in Breath holding Time were 45.37 and 45.38 respectively. The obtained „t‟ ratio was 0.07 since the obtained „t‟ ratio was less than the required table 2.15 for the significant at 0.05 level with 14 degrees of freedom. It was found to be statistically insignificant.. The mean values of pre-test and post-test of experimental groups in Breath holding Time were45.45 and 48.12 respectively. The obtained „t‟ ratio was 2.49 since the obtained „t‟ ratio was greater than the required table value of 2.15 for significance at 0.05 level With 14 degrees of freedom it was found to be statistically significant . The result of the study showed that there was a significant difference between control group and experimental group in breath holding time . It may be concluded from the result of the study that
experimental group improved in Breath holding Time due to eight weeks of specific training.
Pre- test and post -test mean values of control and experimental groups on breath holding time stand presented in figure 4
Figure 4. Cylinder Diagram Showing The Pre And Post Mean Value Of Experimental Group And Control
The data obtained on resting heart rate as a result of specific training were analyzed using the „t‟ ratio and
are presented in table 6.
Table 6. Table Showing The Mean Difference, Standard Deviation And „T‟ Value Of Control Group And Experimental Group On Resting Heart Rate
Variables Group Name Mean Sd Sd Error
„t‟ ratio
Table Values Pre Post Pre Post
Resting heart rate
Control 75.60 75.27 2.87 2. 81 0.73 0.81
2. 15 Experimental 74.80 72.67 2.46 2.44 0.63 2.96*
Significance at .05 level of confidence
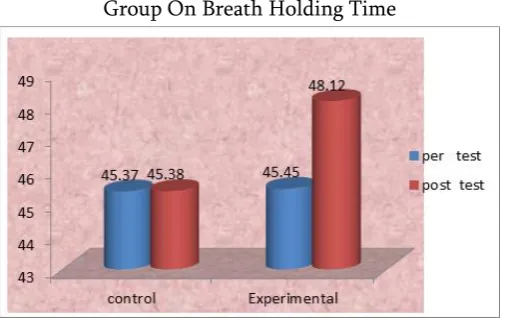
The table VI shows that the mean values of pre-test and post-test of control group in Resting heart rate were 75.60 and 75.27 respectively. The obtained „t‟ ratio was 0.81 since the obtained „t‟ ratio was less than the required table 2.15 for the significant at 0.05 level with 14 degrees of freedom. It was found to be statistically insignificant.. The mean values of pre-test and post-test of experimental groups in Resting heart rate were 74.80 and 72.67 respectively. The obtained „t‟ ratio was 2.96 since the obtained „t‟ ratio was greater than the required table value of 2.15 for significance at 0.05 level With 14 degrees of freedom it was found to be statistically significant .. The result of the study showed that there was a significant difference between control group and experimental group in resting heart rate in. It may be concluded from the result of the study that experimental group improved in resting heart rate due to eight weeks of specific training.
Pre- test and post -test mean values of control and experimental groups on resting heart rate stand presented in figure 5
Figure 5. Cylinder Diagram Showing The Pre And Post Mean Value Of Experimental Group And Control
Group On Resting Heart Rate
DISCUSSIONS ON FINDINGS
The result of the study indicates that the experimental group namely Specific training group had significantly improved the selected Physical & Physiological Variables, when compared to the control group. It is also found that the improvement caused due to Specific training when compared to the control group.
DISCUSSIONS ON HYPOTHESIS
The result of the study shows that there was a significant improvement from pre to post test on speed, agility, leg explosive power, Hench the investigator‟s first hypothesis was accepted.
resting heart rate. Hench the investigator‟s second hypothesis also was accepted.
V.
CONCLUSIONS
Within the limitations of study the following conclusions were made.
1. The results of the study showed that there were significant improvements in physical variables on speed, agility, and leg explosive power after eight weeks of specific training among college men players.
2. The results of the study showed that there were significant improvements in physiological variables on breath holding time, and resting heart rate after eight weeks of specific training among college men players.
VI.
REFERENCES
[1]. Alletab L., Armandc S. K. Aminiand, Z. Patakye, A. Golaye, R.A. de Bief, E.D. and de Bruing, (2010), “An exercise intervention to improve diabetic patients gait in a real-life environment”, Gait Posture, 32 (2), pp.185-190. [2]. Ariel Diaz, Martial G. Bourassa, Marie-Claude
Guertin, Jean-Claude Tardif. (2005). Long-term prognostic value of resting heart rate in patients with suspected or proven coronary artery disease.
[3]. Binnie MJ, Peeling P, Pinnington H, Landers G, Dawson B. (2013). Effect of surface-specific training on 20 m sprint performance on sand and grass surfaces.
[4]. Bosquet L, Berryman N, Dupuy O, Mekary S, Arvisais D, Bherer L, Mujika I.(2013). Effect of training cessation on muscular performance. [5]. Hentsch U, Ulmer HV. ( 1984). Trainability of
underwater breath-holding time. 5(6):343-7. [6]. Kenney WL. (1985). Parasympathetic control of
resting heart rate: relationship to aerobic power. 17(4):451-455
[7]. Klocke FJ, Rahn H. (1959). Breath holding after breathing of oxygen.
[8]. Sharma and Tyagi.(2011). Investigated the effect of specific training programme on physiological and fitness components of Table tennis players. [9]. Arvind Bahadur Singh. (2012). Sports training.
Prerna Prakashan, Delhi: Rohini, pp.1-2.
[10]. Gopala, Krishnan. (2012). Physical fitness, exercise and health. Sports publication, Darya Ganj. New Delhi: pp-2.
[11]. Hardayal, Singh.( 1991). Science of sports training. D.V.S. publications. Girinagar. Kaikaji, New Delhi.