University of Pennsylvania
ScholarlyCommons
Publicly Accessible Penn Dissertations
1-1-2013
Distributed Activity Patterns for Objects and Their
Features: Decoding Perceptual and Conceptual
Object Processing in Information Networks of the
Human Brain
Marc N. Coutanche
University of Pennsylvania, [email protected]
Follow this and additional works at:
http://repository.upenn.edu/edissertations
Part of the
Cognitive Psychology Commons, and the
Neuroscience and Neurobiology Commons
Recommended Citation
Coutanche, Marc N., "Distributed Activity Patterns for Objects and Their Features: Decoding Perceptual and Conceptual Object Processing in Information Networks of the Human Brain" (2013).Publicly Accessible Penn Dissertations. 847.
Distributed Activity Patterns for Objects and Their Features: Decoding
Perceptual and Conceptual Object Processing in Information Networks of
the Human Brain
Abstract
How are object features and knowledge-fragments represented and bound together in the human brain?
Distributed patterns of activity within brain regions can encode distinctions between perceptual and cognitive
phenomena with impressive specificity. The research reported here investigated how the information within
regions' multi-voxel patterns is combined in object-concept networks. Chapter 2 investigated how
memory-driven activity patterns for an object's specific shape, color, and identity become active at different stages of
the visual hierarchy. Brain activity patterns were recorded with functional magnetic resonance imaging
(fMRI) as participants searched for specific fruits or vegetables within visual noise. During time-points in
which participants were searching for an object, but viewing pure noise, the targeted object's identity could be
decoded in the left anterior temporal lobe (ATL). In contrast, top-down generated patterns for the object's
specific shape and color were decoded in early visual regions. The emergence of object-identity information in
the left ATL was predicted by concurrent shape and color information in their respective featural regions.
These findings are consistent with theories proposing that feature-fragments in sensory cortices converge to
higher-level identity representations in convergence zones. Chapter 3 investigated whether brain regions share
fluctuations in multi-voxel information across time. A new analysis method was first developed, to measure
dynamic changes in distributed pattern information. This method, termed "informational connectivity" (IC),
was then applied to data collected as participants viewed different types of man-made objects. IC identified
connectivity between object-processing regions that was not apparent from existing functional connectivity
measures, which track fluctuating univariate signals. Collectively, this work suggests that networks of regions
support perceptual and conceptual object processing through the convergence and synchrony of distributed
pattern information.
Degree Type
Dissertation
Degree Name
Doctor of Philosophy (PhD)
Graduate Group
Psychology
First Advisor
Sharon L. Thompson-Schill
Keywords
Subject Categories
DISTRIBUTED ACTIVITY PATTERNS FOR OBJECTS AND THEIR FEATURES:
DECODING PERCEPTUAL AND CONCEPTUAL OBJECT PROCESSING IN INFORMATION
NETWORKS OF THE HUMAN BRAIN
Marc N. Coutanche
A DISSERTATION
in
Psychology
Presented to the Faculties of the University of Pennsylvania
in
Partial Fulfillment of the Requirements for the
Degree of Doctor of Philosophy
2013
Supervisor of Dissertation
__________________________________________
Sharon L. Thompson-Schill, Professor of Psychology
Graduate Group Chairperson
__________________________________________
John C. Trueswell, Professor of Psychology
Dissertation Committee
Russell A. Epstein, Associate Professor of Psychology
DISTRIBUTED ACTIVITY PATTERNS FOR OBJECTS AND THEIR FEATURES: DECODING
PERCEPTUAL AND CONCEPTUAL OBJECT PROCESSING IN INFORMATION NETWORKS
OF THE HUMAN BRAIN
COPYRIGHT
2013
ACKNOWLEDGMENTS
I would like to express my profound thanks and appreciation to my advisor, Sharon
Thompson-Schill. Sharon’s intellectual insights, support, professional guidance, sense of humor
and fantastic taste in restaurants are just some of the many qualities I have benefited from over
the last five years. Sharon’s perfect balance of providing intellectual guidance, with intellectual
freedom, has helped fuel the excitement I feel about my research. Anyone who has ever raised
an eyebrow when I casually mentioned that being a Ph.D. student for the rest of my life sounds
like fun can blame Sharon.
I wish to thank my committee for their valuable ideas, guidance and continued
professional support. I am very grateful to the Howard Hughes Medical Institute for kindly
awarding me an International Student Research Fellowship, and to the National Institutes of
Health, National Science Foundation (for grants awarded to ST-S) and the American
Psychological Foundation for research funding. I also want to thank the many members of the
Penn Psychology community that I have interacted with during my graduate studies. Supportive
faculty members, psychology graduate students, lab members, and the undergraduates I
co-advised all have my heartfelt thanks.
Finally, I wish to thank my family for their continual love and support, and my wife,
Lauren, for her emotional support, intellectual insights and so much more.
The findings from Chapter 2 are currently under review. The findings from Chapter 3
have been published as: Coutanche, M. N., & Thompson-Schill, S. L. (2013). Informational
Connectivity: Identifying synchronized discriminability of multi-voxel patterns across the brain.
ABSTRACT
DISTRIBUTED ACTIVITY PATTERNS FOR OBJECTS AND THEIR FEATURES:
DECODING PERCEPTUAL AND CONCEPTUAL OBJECT PROCESSING IN INFORMATION
NETWORKS OF THE HUMAN BRAIN
Marc N. Coutanche
Sharon L. Thompson-Schill
How are object features and knowledge-fragments represented and bound together in the human
brain? Distributed patterns of activity within brain regions can encode distinctions between
perceptual and cognitive phenomena with impressive specificity. The research reported here
investigated how the information within regions’ multi-voxel patterns is combined in
object-concept networks. Chapter 2 investigated how memory-driven activity patterns for an object’s
specific shape, color, and identity become active at different stages of the visual hierarchy. Brain
activity patterns were recorded with functional magnetic resonance imaging (fMRI) as participants
searched for specific fruits or vegetables within visual noise. During time-points in which
participants were searching for an object, but viewing pure noise, the targeted object’s identity
could be decoded in the left anterior temporal lobe (ATL). In contrast, top-down generated
patterns for the object’s specific shape and color were decoded in early visual regions. The
emergence of object-identity information in the left ATL was predicted by concurrent shape and
color information in their respective featural regions. These findings are consistent with theories
proposing that feature-fragments in sensory cortices converge to higher-level identity
representations in convergence zones. Chapter 3 investigated whether brain regions share
fluctuations in multi-voxel information across time. A new analysis method was first developed, to
measure dynamic changes in distributed pattern information. This method, termed “informational
man-made objects. IC identified connectivity between object-processing regions that was not
apparent from existing functional connectivity measures, which track fluctuating univariate
signals. Collectively, this work suggests that networks of regions support perceptual and
conceptual object processing through the convergence and synchrony of distributed pattern
TABLE OF CONTENTS
ACKNOWLEDGMENTS ... III
ABSTRACT ... IV
TABLE OF CONTENTS ... VI
LIST OF TABLES ... VII
LIST OF ILLUSTRATIONS ... VIII
CHAPTER 1: GENERAL INTRODUCTION ... 1
CHAPTER 2: CREATING CONCEPTS FROM CONVERGING FEATURES IN HUMAN
CORTEX ... 6
Abstract ... 6
Introduction ... 7
Method ... 9
Results ... 17
Discussion ... 27
CHAPTER 3: INFORMATIONAL CONNECTIVITY: IDENTIFYING SYNCHRONIZED
DISCRIMINABILITY OF MULTI-VOXEL PATTERNS ACROSS THE BRAIN ... 30
Abstract ... 30
Introduction ... 31
Method ... 36
Results ... 44
Discussion ... 55
CHAPTER 4: GENERAL DISCUSSION ... 60
LIST OF TABLES
Table 2.1. Coordinates for feature ROIs ………... 16
LIST OF ILLUSTRATIONS
Figure 2.1. Experimental design ….………...11
Figure 2.2. Location for searchlights with above-chance decoding of object identity .…………... 18
Figure 2.3. Generalizing from top-down activity to visual perception .……….. 20
Figure 2.4. Feature-based generalization ….……… 21
Figure 2.5. Classification results from the shape and color decoding analyses ………. 22
Figure 2.6. The properties of blocks with successful ATL object-identity decoding ………... 24
Figure 2.7. Across-subject differences in noise-to-visual generalization ………. 26
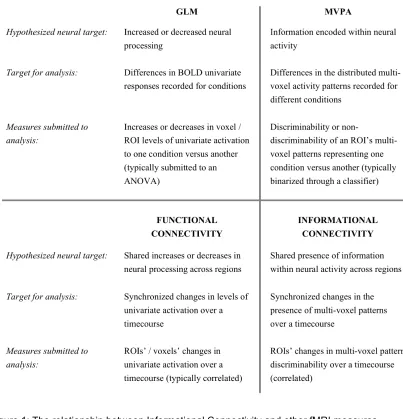
Figure 3.1. The relationship between informational connectivity and other fMRI measures ... 33
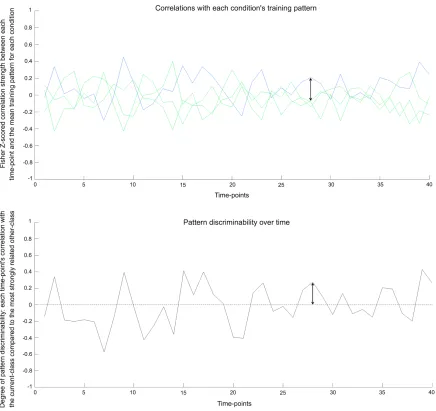
Figure 3.2. Pattern discriminability over time in real data ………... 41
Figure 3.3. Significantly connected regions in IC and FC analyses for three of the seeds ……... 49
Figure 3.4. Connectivity strengths before cluster-based thresholding for three of the seeds ... 50
Figure 3.5. Venn diagrams of voxels significantly connected to each seed ……… 51
Figure 3.6. Connectivity strengths of all searchlights with a seed in the left fusiform gyrus ……. 52
CHAPTER 1: GENERAL INTRODUCTION
“When a collection of musical instruments is played in a coordinated manner, the aggregate function is the symphony that flows and has a recognizable structure and coherence … the aggregate is much richer than a particular element.”
– McIntosh (2000, p. 863)
When you see or think about a lime, you can recognize or imagine its round shape and
green color. You can anticipate how to hold it, and expect a zingy and sour taste from eating
one. Each of these individual features is shared with many other objects, but their unique
combination defines our concept of a lime. How does the human brain represent and integrate
perceptual and knowledge fragments of objects? This dissertation investigates how distributed
patterns of brain activity encode different components of object-related information, and how
brain regions carrying these distributed codes interact during object perception and conception.
A widespread array of brain regions becomes active as we perceive an object or retrieve
object knowledge from semantic memory (Binder & Desai, 2011). Some theories propose that
our object knowledge is supported by the same neural systems that underlie perception and
action; supported by findings that sensorimotor cortex becomes active when object knowledge is
retrieved (Binder & Desai, 2011; Martin & Chao, 2001; Martin, 2007). Alternatively, one or more
integration areas might bind together an object’s properties, to form its identity elsewhere in
cortex (Binder & Desai, 2011; Damasio, 1989; Lambon Ralph, Sage, Jones, & Mayberry, 2010).
Such integration theories differ in the hypothesized location, and number, of integration zones
(Binder & Desai, 2011; Simmons & Barsalou, 2003). Some theories propose that different object
features are brought together in distinct convergence zones, which in turn feed into higher-level
convergence zones (Binder & Desai, 2011; Damasio, 1989; Meyer & Damasio, 2009), while
others propose that one central “hub” encodes object-concepts in an amodal format (Patterson,
Nestor, & Rogers, 2007). A recent version of this theory, the “hub-and-spoke” model, retains a
role for sensorimotor regions (the spokes) in supporting featural knowledge, while hypothesizing
details, they all propose the existence of at least one integration site for moving beyond
single-feature processing.
The neural systems underlying object processing and semantic memory can be
investigated in healthy humans using functional magnetic resonance imaging (fMRI). The
blood-oxygenation level dependent (BOLD) signal recorded during an fMRI scan reflects the activity of
large populations of neurons, providing a valuable window into a brain region’s neural processing.
Most commonly, the average BOLD response in a voxel or larger region is compared between
conditions (commonly using the General Linear Model; Friston et al., 1994), where a greater
average BOLD response is interpreted as reflecting increased neural processing. This overall
response, however, is only one way in which information can be contained in a region’s activity,
and as will be discussed, an alternative form is more closely linked to the fine-grained distinctions
in features and objects.
In addition to a region’s overall response, information is now known to exist in the
patterns of responses that are distributed across multiple voxels (Haxby et al., 2001; Norman,
Polyn, Detre, & Haxby, 2006). Distinct percepts and cognitive states can be encoded within
these unique combinations of voxel responses (“multi-voxel patterns”), allowing a large number of
potential discriminable patterns within a voxel population, even when the region’s mean response
is similar (Coutanche, 2013). Multi-voxel patterns are particularly important to the neural
underpinnings of object knowledge. Because distributed patterns are multi-dimensional (i.e.,
each voxel is one dimension), multi-voxel patterns can encode distinctions that are not as easily
represented by differences in a mean response. For example, although a greater regional mean
response to viewing shapes, compared to colors, could reflect shape-related processing, it is less
straightforward to predict how distinctions between shapes, such as a cube, sphere and pyramid,
would map onto a univariate mean response. This level of specificity is, however, central to
object knowledge. It is not enough to know that limes have a shape and a color: our knowledge
that multi-voxel patterns encode finer distinctions between objects, while univariate responses
represent broader categorical differences (Brants, Baeck, Wagemans, & Op de Beeck, 2011).
Multi-voxel patterns in ventral temporal (VT) cortex contain information about a visually
presented object’s category (e.g., Coutanche, Thompson-Schill, & Schultz, 2011; Coutanche &
Thompson-Schill, 2012; Haxby et al., 2001; O’Toole, Jiang, Abdi, & Haxby, 2005; Spiridon &
Kanwisher, 2002) and identity (e.g., Eger, Ashburner, Haynes, Dolan, & Rees, 2008). Imagery for
items has also been decoded from this area of cortex, although the imagined items typically differ
greatly in visual appearance (Lee, Kravitz, & Baker, 2012) and/or semantic category (e.g., people
versus cars: Peelen & Kastner, 2011). Multi-voxel patterns for perceptual features have been
decoded in early visual cortex, including for shape (Stokes, Thompson, Cusack, & Duncan,
2009), orientation (Kamitani & Tong, 2005) and motion-direction (Kamitani & Tong, 2006). A
particularly powerful test of whether a hypothesized principle or dimension (e.g., shape) underlies
a region’s neural processing is to evaluate whether a model trained to distinguish items with a
hypothesized distinction can successfully decode new items that vary in other dimensions (e.g.,
color). This type of strict “generalization test” (Tong & Pratte, 2012) is applied in Chapter 2 of this
dissertation.
As discussed above, many regions of human cortex have been implicated in storing and
retrieving object knowledge (Martin & Chao, 2001; Martin, 2007; Thompson-Schill, 2003).
Multi-voxel patterns are almost exclusively investigated in isolated regions-of-interest (ROIs) to
determine the information that is present within their activity patterns. While studies of multi-voxel
patterns have examined more than one region (e.g., Kriegeskorte, Goebel, & Bandettini, 2006),
each voxel population is typically analyzed separately to compare their relative discriminability
(e.g., Walther, Caddigan, Fei-Fei, & Beck, 2009). However, brain regions operate within
coordinated networks (Fox et al., 2005; McIntosh, 2000), and understanding a region’s role within
a network may be crucial to fully understanding its function and neural operations. For example,
a recent review of investigations of the angular gyrus (AG) noted that “the exact role of the AG
implies that the role of the AG cannot comprehensibly be identified in isolation but ideally needs
to be understood in parallel with the influence from other regions” (Seghier, 2013, p. 48).
Considering the importance of inter-regional networks, and the increasingly apparent role of
multi-voxel information in many perceptual and cognitive functions (Tong & Pratte, 2012),
understanding how multi-voxel information is operationalized and integrated at the network-level
has great potential for advancing our understanding of how the brain integrates information
across systems.
The work in this dissertation addresses how the multi-voxel patterns that underlie
features and objects are brought together at the network level. To address this issue, the work
here raises the novel question of how feature and object patterns emerge synchronously across
regions that operate in networks. Whereas investigations employing MVPA have predominantly
ignored region-to-region relationships, the studies described here examine synchronous decoding
through new approaches, which allow questions to be raised that could not otherwise be
addressed, including: 1) Does the decoding of higher-level objects depend on the synchronous
decoding of lower-level features? 2) Is the level of an object’s multi-voxel information correlated
between regions across time? Such questions cannot be answered with typical MVPA
approaches, but the approaches in this work allow these ideas, and others, to be tested.
Chapter 2 reports an investigation of distributed activity patterns underlying our
knowledge of objects, including their features and identity. The question of how knowledge of an
object’s features and identity is instantiated in the human brain remains a key question of modern
cognitive neuroscience (Meyer & Damasio, 2009). This study examines object knowledge at
multiple levels of the visual hierarchy, and investigates links between these levels using a novel
analysis of dependencies between multi-voxel codes. Chapter 3 further investigates how object
processing engages multi-voxel information across the cortex, by identifying networks with similar
across-time profiles of multi-voxel information. Functional networks are frequently investigated
using univariate activation, where synchronous fluctuations in univariate responses are identified
1995). In contrast, there has been little characterization of networks of synchronized multi-voxel
information. Chapter 3 first describes the development of a novel analysis method that allows
this type of investigation. By using a metric of multi-voxel information that is deployed across a
timeseries, this method – “informational connectivity” (IC) – can identify relationships between
regions based on the ebb and flow of multi-voxel information. The chapter goes on to apply this
method to brain activity recorded as individuals viewed different types of man-made objects. The
method identified object-processing networks on the basis of their synchronized multi-voxel
information. Regions are identified that have been hypothesized to play key roles in object
processing, and the results contribute to current theoretical debates.
Multi-voxel patterns encode information at a level of specificity that is centrally relevant to
the convergence of features into objects, and to distinctions between objects, during perceptual
and conceptual processing. Crucial to understanding these cognitive systems is discovering how
brain regions operate within connected information networks. Together, the chapters here seek
to address how the neural signatures of these fine-grained perceptual and conceptual items are
CHAPTER 2: CREATING CONCEPTS FROM CONVERGING FEATURES IN HUMAN
CORTEX
Abstract
To make sense of the world around us, our brain must remember the overlapping features of
millions of objects. Crucially, it must also represent the unique feature-convergence that defines
every object. We know very little about how the brain binds feature knowledge fragments into
identity. Here we describe a functional magnetic resonance imaging study of neural information
for features and identity in humans searching for fruits and vegetables within random visual noise.
A pattern-classification algorithm could decode a (unseen but anticipated) target’s identity within
the anterior temporal lobe, and its specific shape and color within early visual regions. A novel
analysis revealed that converging shape and color codes predict emerging identity information.
People with stronger dependencies between featural-convergence and identity had
memory-generated activity that more closely resembled visually memory-generated codes. These results support
theories proposing that convergence zones bind feature knowledge fragments together to form an
Introduction
We encounter millions of objects during our lifetime that we recognize effortlessly. We
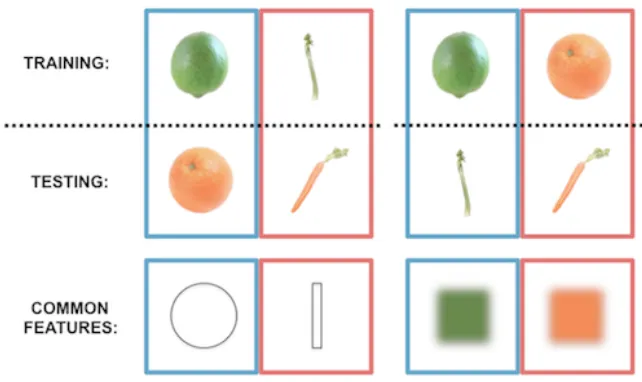
know that a lime is green, round and tart, whereas a carrot is orange, elongated and sweet,
helping us to never confuse the wedge on our margarita glass with our rabbit’s favorite treat. One
property (or ‘feature’) alone is typically insufficient for identification: celery can also be green and
tangerines are also orange. Instead, we draw-on the unique convergence of features that defines
an object. How does our brain bind together the many possible sensorimotor features to form a
unique memory representation?
Several theories have been proposed to address this challenge. One theory proposes
that knowledge of objects resides in the very sensorimotor cortices that process their features
during perception or use (Kiefer & Pulvermüller, 2012; Martin, 2007). An alternative set of
theories suggest that objects become represented in one or more central cortical hubs or
integration areas (Lambon Ralph, Sage, Jones, & Mayberry, 2010; Patterson, Nestor, & Rogers,
2007; Pobric, Jefferies, & Lambon Ralph, 2010; Simmons & Barsalou, 2003). The anterior
temporal lobe (ATL) – an area well connected to temporal, parietal and frontal cortices – has
been proposed as a candidate hub, supported by evidence of conceptual impairments that can
accompany ATL atrophy during semantic dementia (Hodges, Patterson, Oxbury, & Funnell, 1992;
Rogers, Patterson, & Graham, 2007). Hub-based theories have proposed that a hub enables
concepts to be re-representation in a high-dimensional semantic space, enabling concepts that
have very different features (such as a lime and carrot) to be semantically close and vice versa
(Lambon Ralph & Patterson, 2008).
Damasio’s first proposal for the existence of an integration zone suggested that
convergence zones hold a binding code, or combinatorial record, for “feature fragments” (coded
in sensory cortex) that form our knowledge of objects when successfully combined (Damasio,
1989; Meyer & Damasio, 2009; Simmons & Barsalou, 2003). Little direct evidence exists for the
convergence zone hypothesis (Simmons & Barsalou, 2003), not least because a crucial
feature fragments – has yet to be found in the human brain. A putative convergence zone should
show certain characteristics that are testable using novel fMRI analysis techniques. Specifically,
the convergence account leads to these three key predictions: i) Thinking about an object should
evoke a pattern of brain activity coding its identity in a purported convergence zone (the result of
convergence). ii) Early visual regions that specialize in processing the features of a retrieved
object should activate specific feature fragments (the substrates for convergence). A given
feature’s code will be shared among objects that share this feature. Notably, we currently do not
know the degree to which a convergence zone would reactivate features (Simmons & Barsalou,
2003), which could range from general shape processing for all objects, to the specific neural
activity specifying a sphere rather than a cube. The strictest form of “feature fragment” would
predict the latter. iii) Successful convergence (marked by successful identity decoding) should be
linked to the simultaneous presence of the convergence substrates. One of the first theoretical
proposals of a convergence zone set the specific requirement that activation of “convergence
zones would produce synchronous activity in separate cortical sites presumed to contain
feature-fragments related to the convergence zone” (Damasio, 1989, p. 56). In contrast, a rival theory, in
which object knowledge is contained solely within sensorimotor regions, does not predict this link.
We developed a novel analysis to test the relationships present between different types of
distributed information, allowing us, for the first time, to detect a relationship between specific
feature fragments and the result of their convergence to object identity, in the human brain.
In the present study we examined top-down generated activity patterns for fruits and
vegetables that varied orthogonally by color, shape and identity. Top-down processes can
influence neural activity in cortical regions that respond to visual stimulation (Corbetta, Miezin,
Dobmeyer, Shulman, & Petersen, 1990; Maunsell & Treue, 2006). We employ a task that
engages top-down influences with no visual information on-screen, allowing us to investigate
Method
Subjects
Data from eleven participants (3 females, 18-35 years old) are analyzed (a twelfth
participant’s fMRI data were not analyzed due to abnormal behavioral responses during the task).
All participants were right-handed with normal or corrected-to-normal vision and reported no
history of neurological problems. Participants provided written informed consent and received
monetary compensation for their participation. The human subjects review board at the
University of Pennsylvania approved all experimental procedures.
Magnetic resonance imaging acquisition
Subjects were scanned with a 3-T Siemens Trio system equipped with an eight-channel
head coil and foam padding for stabilizing the head. T1-weighted anatomical images were
acquired at the beginning of each session (TR = 1,620 ms, TE = 3 ms, TI = 950 ms, voxel size =
0.977 mm × 0.977 mm × 1.000 mm). T2*-weighted scans recorded blood oxygenation level–
dependent (BOLD) response using interleaved gradient-echo EPI (TR = 3,000 ms, TE = 30 ms,
field of view = 19.2 cm × 19.2 cm, voxel size = 3.0 mm × 3.0 mm × 3.0 mm, 42 slices).
Experimental procedure
Prior to fMRI scanning, participants completed a behavioral staircasing procedure to
determine the level of visual noise that was later applied to images during the fMRI scan. This
ensured the in-scan detection task would be challenging enough to engage each subject. On
each trial of this staircasing behavioral task, subjects indicated with a button-press when they
could identify a fruit (bananas and tomatoes, two fruits not used for the primary task) displayed in
a field of Gaussian visual noise. After each behavioral response, the variance of the noise added
to the next image was increased or decreased, bringing the subject’s final detection level to 75%
accuracy by the end of the procedure. The particular noise variance producing this
Participants’ detection accuracies during the scanning session (M = 73%, s.d. = 11%) were very
similar to the 75% staircasing target, suggesting the procedure was successful.
At the beginning of the scanning session, participants passively viewed images of
exemplars of the four types of fruit and vegetables (carrots, celery, limes and tangerines) that
would later act as targets, centrally placed on a white background. Six images of each type of
fruit and vegetable were presented in a random order in each 18 sec block, with each image
shown for 3 secs. Blocks were separated by 12 secs of fixation. In total, twelve exemplars of
each type of fruit and vegetable (later hidden in the detection task) were presented, split across
two blocks.
During the next four scanning runs, participants were instructed to respond with a
button-press when they detected a cued fruit or vegetable within visual noise. Word cues were
presented to indicate a type of fruit or vegetable that should be detected (e.g., ‘carrot’). A
variable number of images then followed, each with Gaussian white noise based on a mean of
zero and variance-level determined by the subject’s prior staircasing (see Figure 1). In every run,
each of the four fruit and vegetable cues was cumulatively followed by the same total amount of
visual noise. Each fruit and vegetable cue (e.g., ‘carrot’) occurred three times in a run (giving 12
blocks for each fruit and vegetable across the experiment). Blocks were presented in a
pseudo-randomized order so that the same cue did not immediately repeat. Within the blocks, pure-noise
images were each shown for 3 secs. Following a variable length of time (between 12 and 24
secs after the initial cue), a fruit or vegetable was presented, hidden within Gaussian noise. The
block automatically ended after this trial. This design afforded us the high signal sensitivity found
with block designs, combined with unpredictability to keep participants cognitively engaged. Two
of the fruit-in-noise images ending the noise blocks contained a fruit or vegetable that did not
match the preceding cue (i.e., 2 out of 12 were foils), to focus participants on detecting the
specific target. The two foils for each kind of cue were other fruits / vegetables with the same
color but different shape, or same shape but different color (e.g., for carrot: tangerine and celery),
to search for the cued target from the very start of every block, the beginning of each run (during
the four beginning time-points routinely removed in preprocessing) included a short block in which
a cued fruit or vegetable appeared after only 3 or 6 secs, followed by 12 s of fixation. The hidden
fruits and vegetables that ended each short block were not repeated in the main blocks and their
BOLD signal did not contribute to any analyses.
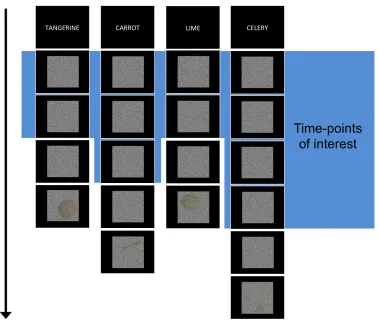
Figure 1: Experimental design. Participants were presented with cues of items to detect, followed
by blocks of visual noise. Each block ended with an actual image embedded in noise at a
threshold determined for each participant prior to their scan (shown here at a low threshold for
visualization purposes). Blocks contained an unpredictable amount of pure noise and
occasionally ended with an incorrect (non-cued) fruit or vegetable to keep participants on-task.
corner in the actual experiment. Every block ended with a unique instance of that kind of fruit or
vegetable (e.g., no particular tangerine appeared more than once). Data from the last noise
time-point was discarded to ensure the signal-ascent from viewing the image-in-noise did not influence
the analyzed data.
The 12 images of each hidden fruit / vegetable (10 cued, 2 foils) ending the blocks were
photographic examples in various orientations on a white background. The objects were all
adjusted to have the same height. The hidden items appeared in four possible locations: top-left,
top-right, bottom-left and bottom-right (see Figure 1 for an example). The objects appeared in
each location 3 times across the experiment, in a randomized order. The objects appearing in
each location were preceded by the same cumulative amount of Gaussian noise across the
experiment (i.e., there was no contingency between the amount of noise and final stimulus
location).
Magnetic resonance imaging preprocessing
Imaging data were preprocessed using the Analysis of Functional NeuroImages (AFNI)
software package (Cox, 1996). The first four volumes of each functional run were removed to
allow the signal to reach steady-state magnetization. All functional images were slice time
corrected and a motion correction algorithm registered all volumes to a mean functional volume.
Low frequency trends were removed from all runs using a high-pass filter threshold of 0.01 Hz.
Voxel activation was scaled to have a mean of 100, with a maximum limit of 200. The data were
not smoothed.
Decoding analysis
Pattern decoding was conducted within the MATLAB environment. The functional data
noise trials (i.e., the TRs of data collected before the participant encountered a concealed fruit or
vegetable) were isolated in the following manner: The pure-noise TRs were assigned binarized
labels of the search target. They were then convolved with a time-shifted model of the
hemodynamic response and thresholded at 0.8, to identify the events predominantly affecting
each time-point. This gave a vector of activity values n-voxels long for each pure-noise TR,
which were averaged by block. To ensure that the block average was not influenced by the
signal-ascent of the block’s final trial (in which a fruit or vegetable was actually present), we
removed the last pure-noise TR of each block before averaging.
We conducted an information brain mapping ‘roaming searchlight’ analysis in each
participant by centering a sphere (3-voxel radius) on each voxel in turn (Kriegeskorte, Goebel, &
Bandettini, 2006). MVPA was conducted with the voxels in each searchlight volume (123 when
not restricted by the brain’s boundary) and performance was allocated to the central voxel. For
each searchlight, 4-fold cross-validation was conducted (training on three runs; testing on the
fourth) with a Gaussian Naïve Bayes (GNB) classifier (implemented through the MATLAB
Statistics toolbox) to classify activity to noise trials according to the search target (carrot, celery,
lime or tangerine). The classifier was trained and tested on the vectors of BOLD activity values
that were averaged for each block in the manner described above. GNB classifiers have been
shown to have particular success for datasets with small numbers of training samples (Mitchell et
al., 2004; Ng & Jordan, 2002; Singh, Miyapuram, & Bapi, 2005), such as here where each block
contributes one datapoint. It is also fast for searchlight analyses (Pereira, Mitchell, & Botvinick,
2009).
Each participant’s map of searchlight accuracies was brought to standardized space (with
the same resolution as the functional data) and spatially smoothed with a 6 mm FWHM kernel.
The 11 searchlight maps were submitted to a group analysis to test whether the accuracy at each
voxel was greater than 0.25 (chance), with familywise error correction for multiple comparisons
The next analysis tested whether a model trained on the cued visual noise would generalize to
activity patterns (also block averages) from the separate passive-viewing run. A classifier was
trained on all the pure-noise trials labeled by cue, and tested on data from the passive-viewing
run labeled by the fruit or vegetable on-screen. This 4-way classification was performed with the
voxels of each searchlight volume identified in the prior analysis (transformed back into each
participant’s original space), with the searchlights’ performances averaged. We could not train on
the passive-viewing data due to an insufficient amount of training data. To assess statistical
significance, we conducted permutation testing. First, each participant’s classifier testing labels
were scrambled 1,000 times and the classification was repeated for each new set of labels. This
produced 1,000 permutation-generated classification accuracies for each participant. To obtain a
group p-value, a null distribution was created by randomly sampling a classification accuracy
value from every subject’s 1,001 classification scores (1,000 permutations + 1 real order) and
calculating the group mean. This was performed 10,000 times, giving 10,000 permuted group
means. The real group mean was compared to this null distribution to identify the p-value.
To conduct color and shape generalization tests, we trained classifiers to distinguish two
items differing in one dimension (e.g., carrot versus celery for color) and tested the model on the
unused items that varied in the same way (e.g., tangerine versus lime). This was performed on
data from lateral occipital cortex, V4 and the left ATL region identified from the searchlight
analysis. A 4-fold leave-one-run-out cross-validation procedure was conducted twice: alternating
which items were used for training. Each pair of scores was averaged. To assess statistical
significance, we conducted the permutation testing procedure described above, with each set of
randomized labels held constant for the two combinations of training and testing. The null
distribution was generated by sampling 1,000 group means by randomly selecting from each
participant’s 100 permutations of classification scores. The p-value was then calculated from this
distribution.
The shape and color convergence analyses were conducted by extracting classification
classification in the shape region, and identity classification in the identified temporal lobe
searchlights. A logistic model [with quadratic penalty determined by marginal likelihood
maximization for convergence (Zhao & Lyengar, 2010) and coefficient stability] predicted object
identity decoding success (48 values; one for each block) for each of the identified temporal lobe
searchlights, with predicting variables for: block success in color decoding,
block-by-block success in shape decoding and block-by-block-by-block-by-block color-shape conjunction (color decoding x
shape decoding). Odds ratios were calculated for the models’ coefficients (eB) and averaged
across the identified searchlights for each subject.
Regions of interest
The color and shape across-item generalization tests were conducted using voxels in
regions involved in shape and color processing. The shape-relevant region was based in lateral
occipital cortex, an area with location-tolerant shape information (Carlson, Hogendoorn, Hubert
Fonteijn, & Verstraten, 2011; Eger, Ashburner, Haynes, Dolan, & Rees, 2008). Previous
research has shown that this region is modulated by top-down processing (Reddy, Tsuchiya, &
Serre, 2010; Stokes, Thompson, Nobre, & Duncan, 2009). We extracted standard space
coordinates from a highly cited study of shape processing (Grill-Spector et al., 1999). The lateral
occipital shape region can be characterized by three vertices (dorsal, posterior and anterior), so
we placed three spheres (6 mm radius -the reported extent of activation) against the vertex
coordinates from the object > texture contrast, in both hemispheres (coordinates in Table 1). This
successfully encompassed lateral and ventral regions of the LOC.
The color-processing region was based on a seminal color-processing study (McKeefry &
Zeki, 1997). The coordinates for maximum activation in a chromatic versus achromatic contrast
were extracted from this study and a sphere (radius 6 mm -the listed standard deviation of the
extent of activation) was placed at the right hemisphere coordinates. Investigations have
suggested that right V4 is particularly modulated by top-down control of color processing
Alpert, & Spiegel, 2000; Morita et al., 2004) and achromatopsia is differentially associated with
right V4 damage (Bouvier & Engel, 2006), so we focused on the right region (coordinates in Table
1), although also examined left V4 from the same study.
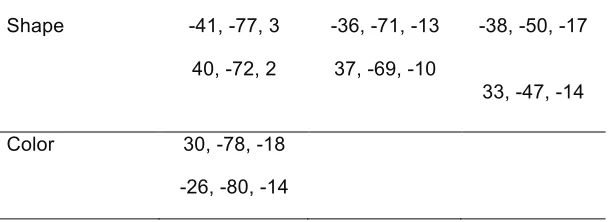
Shape -41, -77, 3
40, -72, 2
-36, -71, -13
37, -69, -10
-38, -50, -17
33, -47, -14
Color 30, -78, -18
-26, -80, -14
Table 1. Coordinates for feature ROIs. Talairach coordinates for shape (extracted from
Grill-Spector et al., 1999) and color (extracted from McKeefry & Zeki, 1997) regions. The shape
coordinates reference the three vertices in each hemisphere that characterize the lateral occipital
shape region. Spheres (6 mm radius) were positioned to border each vertex. The color
Results
We presented participants with images of colored random noise and directed subjects to
detect one of four types of fruits and vegetables – carrot, celery, lime and tangerine – that vary
systematically by shape and color (Figure 1). These blocks of pure-noise ended after an
unpredicable amount of time with the cued fruit or vegetable, or a foil, embedded within noise.
We analyzed data from time-points before any fruit or vegetable was revealed, in order to
examine top-down driven activity. Prior to the main task, participants passively viewed exemplars
of the four types of fruit and vegetable, giving us examples of visually-generated activity patterns
for these items.
Decoding object identity from anticipatory visual activity
To test the first requirement of a convergence zone – that a brain region contains a
memory-evoked code for object identity – we asked if the identity (carrot, celery, lime or
tangerine) of the searched-for object could be decoded as participants viewed visual noise. The
location (or even existence) of a convergence zone has not been established, so we used a
searchlight analysis to analyze sequential clusters of voxels. The functional data recorded during
visual noise time-points were labeled by the participant’s current detection target (given to
participants through a preceding cue) and then submitted to a 4-way machine learning classifier.
The classifier was able to decode (at p < 0.05 corrected) the identity of the
anticipated-but-unseen targets in a cluster of 64 searchlights in the left ATL (in which the volume includes the left
fusiform gyrus, interior temporal, middle temporal and superior temporal cortex, verified by
cortical segmentation and automated labeling through FreeSurfer; Fischl et al., 2002). The region
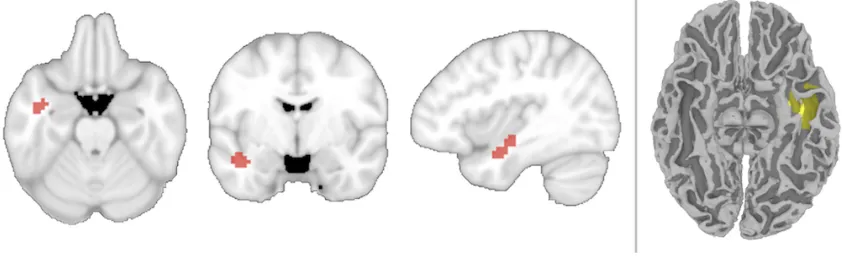
Figure 2: Location for searchlights with above-chance decoding of object identity while
participants viewed visual noise and attempted to detect one of four kinds of fruit and vegetable.
Left: A 4-way searchlight analysis revealed a region within the left ATL capable of decoding the
target. Searchlight centers are shown in red. Right: The searchlights’ volume displayed in one
participant’s original space, shown on their T1 anatomical image after automated cortical
reconstruction and volumetric segmentation using the FreeSurfer image analysis package (Fischl
et al., 2002).
We verified that this significant decoding was not based purely on a sub-categorical
distinction between ‘fruits’ and ‘vegetables’ by successfully classifying items that do not cross this
fruit / vegetable boundary (i.e., carrot vs. celery and lime vs. tangerine) at a level significantly
above chance (permutation testing: p = 0.025). We also confirmed that time-points from each of
the four fruits and vegetables had above-chance accuracies (p < 0.05). Although unlikely that
motor responses could account for temporal lobe performance, we also confirmed that
participants’ numbers of motor responses did not differ significantly between the different targets
(F (3,30) = 1.62, p = 0.23).
We performed further analyses to test the specificity of the left lateralization of the
identified region by analyzing an ROI in the right hemisphere at the same y and z coordinates as
the left ATL region. Successful decoding was specific to the left ATL: the right ATL’s
Because of the known signal issues in the ATL, we measured the temporal signal-to-noise ratio
(tSNR) of the left and right ATL regions, to assess signal quality, and to ask if tSNR differences
could account for the lateralization. The tSNR is calculated by dividing each voxel’s mean signal
with its standard deviation over the time-course of each run. The tSNR values of the searchlight
centers were high for both ATL regions (mean left = 77.4; mean right = 77.5) and well above
levels that are considered suitable for signal detection (e.g., 20 in Binder et al., 2011). This
indicated that the signal was strong in both regions, which additionally did not differ (t10 = 0.01, p
= 0.99).
Are multi-voxel patterns necessary to distinguish object identity? A direct and comparable
way to examine if univariate differences can distinguish the objects is to re-run the classification,
but replacing the multi-voxel patterns with the univariate mean of each block (Coutanche, 2013).
If conditions are separable by any univariate differences, this approach will produce
above-chance classification performance. We ran this analysis within the left ATL and found that
univariate activation cannot separate the conditions (mean classification performance = 0.24;
chance = 0.25; p = 0.70 from permutation testing). The importance of multi-voxel coding to the
investigated contrast is expected, given the necessity of multi-voxel patterns in successfully
decoding information about different objects (Eger et al., 2008; Haxby et al., 2001).
We next examined the nature of the top-down generated identity code by asking whether
it would generalize to activity that had been recorded while subjects viewed examples of the fruits
and vegetables. We trained a classifier on the noise-only trials in the searchlights identified
above (transformed back to each participant’s original space), with each trial labeled according to
the search target. We tested the trained models on data from a separate run in which
participants had viewed blocked images of each kind of fruit or vegetable. The model trained on
preparatory activity in the ATL was able to successfully classify the type of fruits and vegetables
viewed in the separate passive-viewing run (M = 0.30, s.d. = 0.08; chance = 0.25; permutation
testing: p = 0.037), revealing that the memory-generated and visually generated patterns were
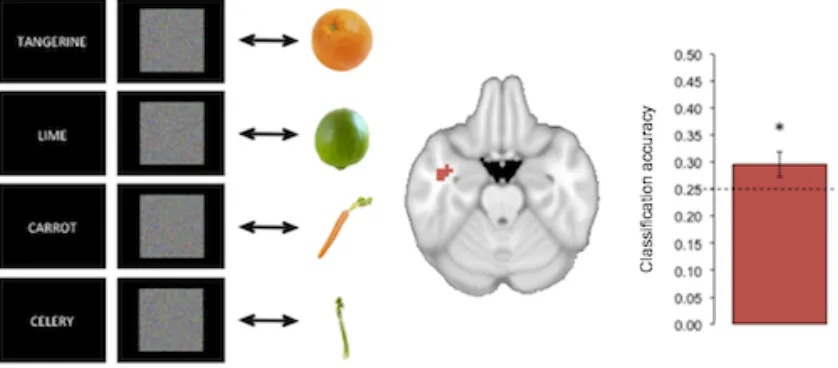
Figure 3: Generalizing from top-down activity to visual perception. Left: A classifier was trained
on activity patterns recorded as participants viewed visual noise and sought to detect a cued fruit
or vegetable. The classifier model was then tested on activity recorded as participants viewed
real images of category examples in a separate run. Center: Activity patterns in this analysis
were extracted from the left temporal lobe searchlights identified in the prior analysis of noise
trials alone. Right: Classification accuracy significantly exceeded chance performance, reflecting
successful generalization from anticipatory activity to visual perception. The dashed line reflects
the level of chance and the error bar shows the standard error of the mean. The asterisk signifies
above-chance classification performance (p < 0.05).
Decoding object features
The four targets in this study differed orthogonally by shape (two elongated, two
spherical) and color (two orange, two green), allowing us to decode each feature independently,
and test the second prediction of the convergence zone theory: that specific feature knowledge
fragments become active in sensory regions (Figure 4). We examined this by asking whether a
model trained to distinguish different shapes or colors could generalize to another pair of objects
generalization in: i) a bilateral region of lateral occipital cortex that is associated with shape
processing, and ii) an occipital area (right V4) associated with color processing (see Method for
full details).
Figure 4: Feature-based generalization. Classifiers were trained to distinguish noise trials in
which participants were searching for fruits and vegetables differing by shape or color. The
classifiers were then tested on noise trials with the other pair of targets that differed in the same
way. In the first example (left), classifiers are trained and tested based on shape (trained on lime
versus celery, tested on tangerine versus carrot). In the second example (right), classifiers are
trained and tested based on color (trained on lime versus tangerine, tested on celery versus
carrot). The items took turns to act as the training data and the results of both comparisons were
then averaged.
A classifier model that was trained on data from when participants were searching for two
fruits and vegetables that differed by shape (e.g., lime vs. celery), could decode the remaining
fruits and vegetables with similar shapes (tangerine vs. carrot), using activity from the bilateral
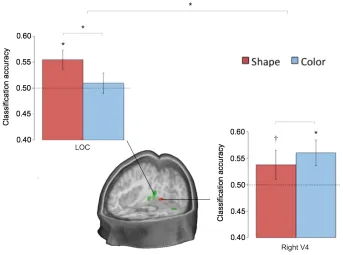
lateral occipital cortex (M = 0.55, s.d. = 0.06; p = 0.01). Successfully decoding specific shapes
across different colors (training on green, testing on orange) provides strong evidence that
not decode the color of the targets (M = 0.51, s.d. = 0.07; p = 0.43), with higher performance for
shape (p = 0.05). The right V4 region contained activity patterns that, using the same approach
as above, decoded colors (M = 0.56, s.d. = 0.08; p = 0.01), and also shape at a trend-level (M =
0.54, s.d. = 0.09; p = 0.09, no significant difference: p = 0.17). This was specific to the right V4
region: left V4 could decode neither (p > 0.4; lower accuracies than the right region for color: p =
0.04, although not shape: p = 0.15). There was a significant interaction for greater shape
decoding in lateral occipital cortex and greater color decoding in right V4; p = 0.03; Figure 5).
As expected for regions coding feature fragments, identity decoding was unsuccessful in both
regions (p > 0.46). We also returned to the identity-decoding ATL region and applied the feature
generalization tests to activity from this region. Consistent with the ATL region containing identity
information that is transformed away from features, neither shape (M = 0.49, s.d. = 0.04; p =
0.61) nor color (M = 0.50, s.d. = 0.05; p = 0.46) were decodable (significantly lower decoding than
in V4 for color: p = 0.01, and lateral occipital cortex for shape at a trend: p = 0.09).
Figure 5: Classification results from the shape and color decoding analyses. Results are
detect targets that differed by shape or color, and tested on data with other targets that varied in
the same way. The shape results (e.g., training: lime versus celery, testing: tangerine versus
carrot) are shown in red. The color results (e.g., training: tangerine versus lime, testing: carrot
versus celery) are shown in blue. The dashed lines reflect the level of chance and the error bars
show the standard error of the mean. Asterisks signify above-chance classification performance
(p < 0.05). The cross signifies trend-level performance (p < 0.1). The green region displayed in
the cross-section is the area of the lateral occipital complex. The red region is based on the
color-responsive area - right V4 (Methods).
Shape and color conjunction predicts the left ATL’s identity code
The third and final convergence zone prediction was that the converged (identity) code
should occur with converging activation of the specific shape and color feature fragments for the
object. We employed a novel decoding-dependency analysis to examine this. We first coded
each classified block of every participant for whether its neural activity contained decodable
object identity in the ATL, color in V4 and shape in lateral occipital cortex. We then created a
logistic regression model (full details in Method) of identity-decoding success (1 versus 0) in each
block for the discovered ATL region, with predictors for: i) color decoding success in right V4, ii)
shape decoding success in lateral occipital cortex, and iii) simultaneous shape and color
decoding (i.e., i x ii). The odds ratios of this model reflect dependencies between the feature
fragments and converged-upon identity.
The conjunction (i.e., convergence) of V4 color decoding and lateral occipital shape
decoding was specifically predictive of successful ATL identity decoding in the model (M odds
ratio = 2.64; odds ratio > 1: t(10) = 4.08, p = 0.002) unlike each feature alone (M odds ratio for
color: 0.76; M odds ratio for shape: 0.66). This relationship is also apparent from directly
comparing the degree of converging shape and color decoding in blocks with, and without,
correct identity classification in the ATL: blocks with successful identity decoding had higher
t-test: t (10) = 11.63, p < 0.001) than blocks that were misclassified (M = 0.15, s.d. = 0.05). These
types of blocks did not differ in proportions of successful color (paired twotailed ttest: t (10) =
-0.14, p = 0.89) or shape (paired two-tailed t-test: t (10) = 1.37, p = 0.20) decoding alone. How do
these rates of conjunctive color-and-shape decoding compare to a model of independence (i.e.,
where Pcolor-and-shape = Pcolor x Pshape)? The degree of shape-color conjunction was greater in ATL
identity-decoded blocks than would be predicted under a model of independence (trend level:
two-tailed paired t-test: t (10) = 1.93, p = 0.08), and was substantially lower in
identity-misclassified blocks (two-tailed paired t-test: t (10) = -7.74, p < 0.001), showing that the
concurrent color and shape decoding co-occurs with successful object-identity decoding to a
greater degree than expected from their baseline occurrences. The feature decoding results for
Figure 6: The properties of blocks with successful ATL object-identity decoding, compared to
those blocks with unsuccessful identity decoding. Positive values indicate that greater shape
and/or color decoding was found in blocks having correct identity decoding.
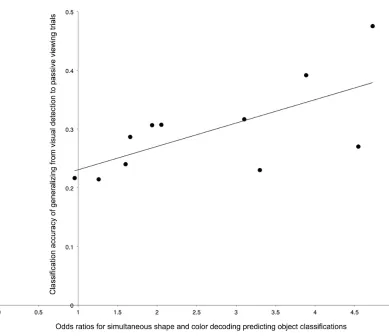
Finally, if the relationship between color–shape conjunction and ATL identity decoding
plays an active role in evoking a concept, we might expect subjects with stronger relationships to
have conceptually driven ATL-codes that more closely match codes evoked from viewing
exemplars of a concept. This correspondence between conceptual and perceptual codes reflects
the extent that top-down processes activate generalizable patterns. A relationship between the
strength of the feature-to-identity relationship, and percept / concept generalizability, would
suggest that this convergence is directly tied to the character of the activated concept. We
confirmed this relationship. Subjects with a stronger link between feature fragments and their
ATL (indicated by a higher odds ratio for shape-and-color convergence predicting ATL identity in
the previous logistic regression) had top-down ATL identity codes that more closely resembled
visually driven activity patterns (r = 0.67, p = 0.02; Figure 7). This was not simply due to
differences in the robustness of the noise-related activity: the strength of the features-to-ATL link
was not related to decoding success when a model was trained and tested on noise only (p =
0.72), suggesting it was specific to memory-generated patterns being more similar to visually
Figure 7: Across-subject differences in noise-to-visual generalization against the strength of the
relationship between featural and object-identity decoding. The y-axis represents each subject’s
classification performance from training on cued noise and testing on visual presentations of each
fruit and vegetable in the ATL. The x-axis reflects each participant’s odds ratio for the conjunction
of color-and-shape decoding (in relevant feature regions) predicting noise-trial identity
classifications in the ATL. A logistic regression model generated these odd ratios (details in
Discussion
The results described here provide evidence for theories of memory that posit the
existence of a region of integration, such a convergence zone (Damasio, 1989; Meyer &
Damasio, 2009; Simmons & Barsalou, 2003). Activity patterns representing an object’s identity
were present in a region of left ATL, and could generalize to activity patterns produced from
passive viewing. Posterior featural regions encoded the anticipated objects’ specific shapes and
colors. Importantly, these levels of representation were closely linked: ATL-decoding of object
identity was more likely when both color and shape could be decoded from featural regions.
Further, the stronger this relationship across subjects, the more that participants’ top-down
generated patterns matched visually generated patterns.
The particular cortical site identified here as encoding object identity information is
consistent with a variety of patient work that points to the ATL’s role in conceptual knowledge
(Patterson et al., 2007; Rogers et al., 2007). The findings also support theories that the ATL
contains convergence zones between visual components of objects (Damasio, 1989). The
results are additionally consistent with proposals that the ATL acts as a central ‘semantic hub’
(Patterson et al., 2007). Unlike convergence zone proposals, hub-based theories suggest just
one central integration zone (in the ATL). As well as a role for the ATL, however, we have found
that visual featural regions: i) evoke specific feature-relevant activity patterns from top-down
influences, and ii) have a functionally relevant relationship with anterior regions. Shape and color
processing are known to be neurally dissociable (e.g., agnosia patients can show impairments in
one but not the other: Cavina-Pratesi et al., 2010), arguing that distinct feature systems are
sharing information with the ATL and contributing different types of conceptual information
(Lambon Ralph et al., 2010). Of the hub-based models, the findings here are most supportive of
so-called “hybrid” models, which incorporate important roles for both sensorimotor cortices and a
central hub. One such theory, the “hub-and-spoke” model, proposes that modality-specialized
regions (V4 and lateral occipital cortex in this study) provide sensory and motor substrates that
(Pobric et al., 2010; Lambon Ralph et al., 2010). The strong and predictive link found between
feature and identity-coding regions in these results give weight to a significant role for sensory
regions, such as that proposed by the hub-and-spoke model.
The findings of this study may be helpful in interpreting some recent semantic dementia
patient findings. A recent study of semantic dementia reported that processing items rich in
visual color and form was disproportionately impaired in patients with severe dementia, unlike
items with other features such as sound/motion and tactile/action (Hoffman, Jones, & Lambon
Ralph, 2012). The authors speculated that temporal lobe atrophy may have spread more
posteriorly to affect basic featural regions in these severe cases. Our results suggest a new
possible explanation: the patients may have experienced disruption to a key shape and color
convergence zone.
Our between-subject analyses showed that participants differed in the resemblance
between their top-down generated, and their visually generated, ATL patterns, according to the
strength of the ATL’s dependence on color-and-shape decoding synchrony. This raises several
fascinating questions for future research: Do individual differences in the link between object
identity and feature synchrony produce differences in people’s phenomenological experiences
during processes such as imagery? Are time-points with synchronous color and shape decoding
more likely to be accompanied by particularly vivid imagery? The relationship between our
findings and peoples’ inner visual experiences is an exciting topic for future research.
There are a number of reasons to be confident that the object-identity decoding reported
here reflects visual processes, rather than others such as verbal rehearsal. The link between
identity and shape-and-color decoding argues strongly for a perceptual basis for the identity
decoding, rather than other semantic features such as taste. Further, the ability to generalize
decoding from top-down to visually presented objects (where no task was required) supports a
visual account.
In our featural analyses, we found shape, but not color, information in the shape region.
trend level. Interestingly, this asymmetry was also reported in a recent meta-analysis of
modality-specific imagery, where shape-related activity overlapped with color regions, but not vice versa
(McNorgan, 2012). Prior work has also suggested that “V4 neurons are at least as selective for
shape as they are for color” (Roe et al., 2012, p. 17). Shape curvature is particularly represented
in V4 (Roe et al., 2012), which would account for V4 decoding spherical versus elongated shapes
at a trend level here. We note that our interpretation of the convergence pattern does not require
that the two regions are uniquely selective to color or shape; only that they contain different (i.e.,
non-redundant) patterns of information.
We employed a novel analysis in this work, enabling us to identify a link between ATL’s
object-identity code and a conjunction of visual feature decoding in occipital regions. This type of
analysis has great potential for future investigations of other configural stimuli, such as
multi-sensory interplay (Driver & Noesselt, 2008), to test whether the synchronous emergence of
composing features co-occurs with the generation of a higher-level code. Relating this measure
to between-subject differences, as we have done here, can help elucidate the behavioral and
neural consequences of connected lower-level conjunctions and higher-level representations.
In summary, this study has demonstrated that top-down retrieval of object knowledge
leads to activation of shape-specific and color-specific codes in relevant specialized visual areas,
as well as an object-identity code within left ATL. Moreover, the presence of identity information
in left ATL was more likely when shape and color information was simultaneously detectable in
their respective feature regions. The strength of this relationship predicted the correspondence
between top-down and bottom-up generated identity activity patterns. These findings support
proposals that convergence zones integrate converging featural information into a less
CHAPTER 3: INFORMATIONAL CONNECTIVITY: IDENTIFYING SYNCHRONIZED
DISCRIMINABILITY OF MULTI-VOXEL PATTERNS ACROSS THE BRAIN
Abstract
The fluctuations in a brain region’s activation levels over a functional magnetic resonance
imaging (fMRI) time-course are used in functional connectivity to identify networks with
synchronous responses. It is increasingly recognized that multi-voxel activity patterns contain
information that cannot be extracted from univariate activation levels. Here we present a novel
analysis method that quantifies regions’ synchrony in multi-voxel activity pattern discriminability,
rather than univariate activation, across a timeseries. We introduce a measure of multi-voxel
pattern discriminability at each time-point, which is then used to identify regions that share
synchronous time-courses of condition-specific multi-voxel information. This method has the
sensitivity and access to distributed information that multi-voxel pattern analysis enjoys, allowing
it to be applied to data from conditions not separable by univariate responses. We demonstrate
this by analyzing data collected while people viewed four different types of man-made objects
(typically not separable by univariate analyses) using both functional connectivity and
informational connectivity methods. Informational connectivity reveals networks of
object-processing regions that are not detectable with functional connectivity. The informational
connectivity results support prior findings and hypotheses about object processing. This new
method allows investigators to ask questions that are not addressable through typical functional
connectivity, just as MVPA has added new research avenues to those addressable with the
Introduction
The enormous wealth of data generated by functional magnetic resonance imaging
(fMRI) has driven the continual development of new analytical methods to understand the brain’s
functions and processes. For many years, a predominant analysis approach has applied the
general linear model (GLM) to compare blood oxygenation level dependent (BOLD) univariate
activation levels across conditions, regions and subject groups (Friston et al., 1994). The last ten
years, however, have seen increased recognition within the fMRI community that information can
also be encoded in the activity patterns of populations of voxels. A multitude of studies have now
successfully employed multi-voxel pattern analysis (MVPA) techniques to decode information
contained within multi-voxel activity patterns (Haynes and Rees 2006; Norman, Polyn, Detre, &
Haxby, 2006; O’Toole et al., 2007). Many such studies have reported that their conditions of
interest could not be distinguished by the mean voxel-response differences that are assessed in a
univariate GLM approach (e.g., Haxby et al., 2001).
In this study, we introduce an analysis method that combines MVPA’s access to
distributed encoding, with connectivity analyses. Functional connectivity (FC) techniques
measure the degree of response-level synchrony between different brain regions or voxels
(Biswal, Zerrin Yetkin, Haughton, & Hyde, 1995). The particular measures used to index
connectivity (during rest or while performing a task) vary with different approaches (e.g., Friston
et al., 1997), but a frequent goal is to identify regions with response levels that fluctuate in a
synchronized manner. Just as univariate analyses have led to numerous findings, GLM’s cousin
– the analysis of fluctuating univariate responses of voxels or regions (FC) – has led to results in
a wide spectrum of research fields. In this paper, we introduce a method – Informational
Connectivity (IC) – that could analogously be considered a cousin of MVPA.
As discussed above, multi-voxel pattern investigations have revealed that one voxel’s
response magnitude is frequently insensitive to information encoded across a pattern of voxels.
Instead of comparing the magnitude of activation levels, multi-voxel analyses frequently employ a
investigations look to increased or decreased response levels as an indication of relevant neural
activity, studies using MVPA often consider the successful separation of conditions as being an
indicator of relevant neural information. In this paper, we introduce a method that quantifies the
discriminability of multi-voxel patterns in a seed region and identifies regions of the brain that
show synchronized discriminability over time.
Whereas FC is frequently applied to measure connectivity between a seed and individual
brain voxels, it is (by definition) not possible to measure multi-voxel patterns in single voxels.
Instead, we quantify how well a condition can be discriminated from other conditions in the
multi-voxel patterns at each time-point in a scanning session. We measure the time-course of
discriminability for a seed region and for three-dimensional spheres (‘searchlights’) placed at
every location in the brain. We correlate the seed region’s discriminability time-course with the
equivalent time-course of each searchlight: measuring the simultaneous ebb and flow of