COMPARATIVE ANALYSIS OF THE PARAMETERS OF THE
TRAFFIC FLOW USING A VIDEO RECORD OF UNMANNED
AERIAL VEHICLES (UAVs)
Tomislav Bubalo1, Darko Bokulić2, Josip Lučić3 1 Planinska ulica 33, Sesvete, Croatia
2 Faculty of Transport and Traffic Sciences, University of Zagreb,Vukelićeva 4, Zagreb, Croatia 3 Kuče, braće Radića 3, Velika Gorica, Croatia
Received 9 March 2018; accepted 27 August 2018
Abstract: Unmanned aircraft is a non-crew aircraft or drone. It can be controlled from the
distance or fly alone. A non-pilot aircraft can fly independently using a pre-programmed flight plan or complex autonomous dynamical systems. The development of unmanned aerial vehicles has begun primarily by the army to reduce costs and human casualties. Suffice it to say that the cost of maintaining and making an unmanned aircraft is a tenth of the cost of a modern aircraft. The biggest challenge of modeling is, of course, navigation and positioning of unmanned aerial vehicles, whether it is traffic or civilian use. Following the historical development to date has demonstrated that progress has been made towards the use of unmanned aerial vehicles in transport science. Today, there has been an increase in the number and type of sensors that unloaded aircraft can contain, and thus the spread of their use, primarily in the observation of the roads in the final analysis of the collected data.
Keywords: Unmanned aerial vehicles (UAVs), traffic flows, traffic counting, data analysis.
1 Corresponding author: [email protected]
1. Introduction
In this paper, work on the Use case principle is described through the methodological procedure and comparative analysis of the results of estimation of the traffic flow rate obtained by analyzing the recorded video of the wider area of the Sesvete center by unmanned plane and the actual results obtained by the classical traffic counting method. Traffic flow parameters (density and flow) were analyzed, and average annual daily traffic (AADT) was estimated to determine the bandwidth of the Zagrebačka road in the narrow center of Sesvete and to demonstrate the possibility of using unmanned aerial
vehicles in the data collection and analysis. Road transport networks reach large ranges, so it is difficult to monitor and analyze them in this context. The development of new technologies has offered an alternative to the latest solutions, unmanned Aerial Vehicles (UAVs), and so-called unmanned systems have also found their use in the transport business. By collecting data from unmanned systems and subsequent photogrammetric processing, a digital transport surface model can be created. They can measure lengths, count volumes, create profiles, and the like.
the potential benefits of unmanned systems in the field of intelligent transport systems. The aim and purpose of this paper is to investigate the possibility of using unmanned aerial vehicles in the analysis of the traffic flow parameters of the Zagrebačka road in order to use obtained results in the further planning of the Sesvete transport system. In this paper the parameters of traffic flow are presented through a mathematical model by using two different methods (fixed and serial photo frames). Further analysis of the obtained results will explore which of the above mentioned methods provides a more accurate picture of the current state of the analyzed traffic flows while achieving satisfactory results in the terms of accuracy of estimation and real state of traffic size in nature.
2. Literature Review
In the field of transportation and traffic engineering, the researches on this autonomous technology primarily focused on examining the traffic monitoring and route planning. (Coifman et al., 2006) investigated the use of UAV to monitor traffic conditions on freeways and interchanges. Other methods to acquire the parameters of traffic conditions like traffic flow, average speed, the length of queue and traffic density use the video analysis (Micchalopoulos, 1991; Wang et al., 2008). So, the vehicle detection and tracking techniques are used to find traffic data collection (Dickmanns, 2002; Bertozzi et al., 2000). Some studies detect and tract vehicle from stationary rectilinear cameras (Bishop, 2000; Bertozzi et al., 2002; Meng Cao et al., 2007). Airborne and spaceborne traffic monitoring has developed by some authors until 2006 (Hinz et al., 2006; Lenhart et al., 2008). Who consider spaceborne sensors able to do cover very large areas, but because of their relatively
short acquisition time and their long revisit period, such systems contribute to the periodic collection of statistical traffic data to validate and improve certain traffic models (Lenhart et al., 2008). The study discussed the applications of using data collected from UAVs to determine annual average daily traffic, level of service, and intersection operations on a small road network. The study however faced with some technical issues, such as the quality of image and the stabilization of the equipment. The literature reviews showed that the research on UAV applications is ongoing, and more in-depth research studies are needed for further achievements of UAV implementation.
3. Methodology
This paper proposes a UAV technology as an alternative data collection technique to monitor and evaluate comparative analysis of the parameters of the traffic flow. Similar to vehicular traffic stream, the traffic flow can be described by three basic parameters: flow, density, and speed. Traffic flow is the number of vehicles that pass through road section during a specified time. Density is the number of vehicles that occupy a specified length of a road section. Speed is the measurement of distance per unit of time passing through by a vehicles. Using video records attached to UAVs, we can measure three basic parameters in two methods. One is from still footage taken from a stationary UAV and two is from the series of footage taken from a moving UAV.
3.1. Selection of the Relevant Type of
UAVs
That is why a link between the control station and the aircraft is required, which is either a radio link or in the case of unmanned aircraft flying at high altitudes, a satellite connection. The control station is a computer interface operated by an expert on unmanned aerial vehicles. From it, the operator can communicate with the unmanned aircraft with communication links to operate the aircraft or rectify the previously specified flight plan. The unmanned aircraft sends information back and transmits camera
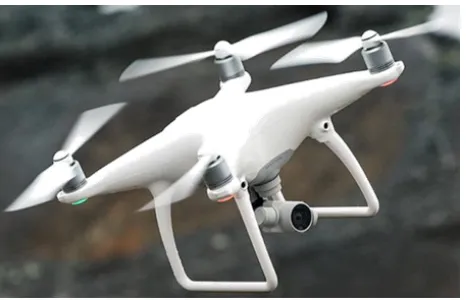
shots in the real time. It most often transmits information about the cargo, the “health” of the aircraft, the altitude and flight speed and the position of the aircraft. The Faculty of Traffic and Transportation Sciences has in its possession the unmanned aircraft Phantom 4 (Figure 1). In order to make the instructions clearer, they will be explained on the concrete example of the said aircraft. Phantom 4 is the smallest new generation aircraft with state-of-the-art technology (PHANTOM 4, 2016).
Fig. 1.
Phantom 4
3.2. Flight Characteristics of Unmanned
Aircraft
The drone can be used with compatible mobile devices that must have an Android or IOS operating system. It is also possible to transfer a live transmission with a flywheel, with a maximum delay of 200 m / s. To the human eye, such delays are insignificant. The aircraft weighs 1380 grams and can reach a significant speed of 20 m / s. It is possible to use the aircraft at 6000 m above sea level in a 28 minute flight length. The flight path is very precise, deviations are 0.1
m from the desired height, and 0.3 m from the desired direction. Its diagonal length with all propellers is 350 mm. The aircraft has an obstacle detection system. However, detection is possible at a distance of up to 15 meters and lighting needs to be greater than 15 lux. The whole aircraft is powered by a 17.4 V battery and 100W power.
1. prepared field work; 2. shooting from the air;
3. postprocessing or processing of data.
Preparatory fieldwork consists of establishing a series of points that are needed for orientation and control of aerial images. Orientation points are used for the orientation of aerial images and should be placed on the ground in such way that they are visible later in air photography. When talking about orientation points we should consider that these footages are taken at altitudes of several hundred meters above sea level and it would be best to set up cross-shaped signals. The signal format must be symmetrical. Orientation points are determined by geodetic methods: triangulation, precision polygonometry or GNNS. The most efficient and fastest method is GNNS. By setting the orientation points, we move to the next step, i.e. the flight planning. Flight planning at
Swinglet Cam Aircraft is an automated process and is taking place on the field. In fact, the e-mo-tion software automatically downloads satellite or “open street” maps of recording sites from internet, depending on the users’ choice. It is recommended to do this part of the project before the fieldwork due to Internet connectivity, but of course this can be done in the field with the presence of an Internet connection. These maps indicate the recording area, and it should be taken into account to cover a slightly larger recording area than the required (WCO, 2016; Eisenbeiss, 2009).
After adjusting the recording resolution and the fold rate of 70%, the software calculates and shows the flight plan. Through radio communication, the data is switched from laptop to unmanned aircraft and it is ready to take off. Solely air recording is a fully automated process, from takeoff to landing.
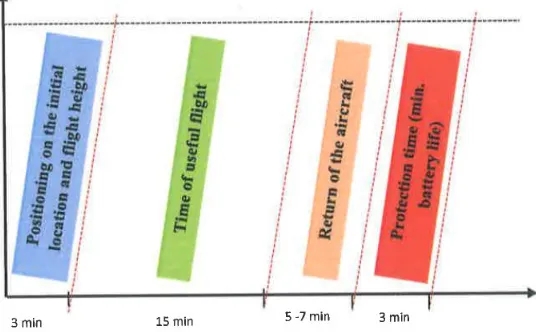
Fig. 2.
4. Description of the Traffic Problem and
Observation Area
Traffic development of Sesvete is articulated with the primary interest of solving the transit and local traffic problems that are radially concentrated in the narrow center of the city and passing through it. Transit traffic from and to Zagreb from the directions of Varaždin, Dugo Selo and Marija Bistrica and local traffic flows make a double barrier. Traffic bottleneck of the Sesvete center is a barrier to transit traffic towards mentioned directions while at the same time overloaded road infrastructure in the immediate vicinity
and parallel to railway infrastructure divides Sesvete into two completely separate parts. This problem has been further highlighted in recent years with construction of the new settlement Novi Jelkovec. From the point of view of the traffic profession, solving these barriers and functional connection of Sesvete to a unified and sustainable entity requires compromise between the existing state (unplanned construction etc.) of set requirements (urbanistic, architectural, traffic, ecological and so on), future plans of sustainable development and preserving the existing natural green resources in Sesvete (GUP, 2016).
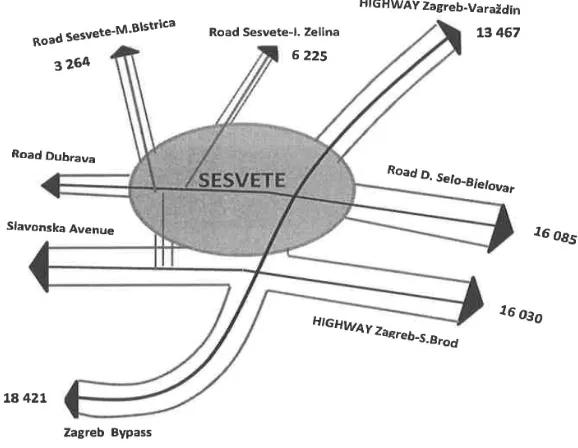
Fig. 3.
Traffic Network of Sesvete Settlement
4.1. Traffic Problem in Observation Zone
(Zagrebačka road - Sesvete)
Potential area for transport solutions can be reduced to two mutually dependent segments. The first is the vertical connection of Sesvete, generally converting traffic areas in the center of Sesvete primarily for pedestrian, bicycle and public transport, thus
(extension plan for Branimirova street - North ring road Sesvete) are necessary to be re-examined according to the requirements of future plans and sustainable development. To select the traffic solution of Sesvete, it is necessary to make a detailed analysis of the entire transport infrastructure, with reference to a traffic study that would analyze all alternatives and take into account the
plans and needs of the future development of Sesvete. The traffic study, based on conducted analyses and simulation models would estimate the proposed alternatives and provide a satisfactory traffic solution in terms of removing bottlenecks for transit traffic through Sesvete and linking the separated parts of Sesvete into a unique and functional entity.
Fig. 4.
Daily Traffic on External Access Roads to Sesvete - Annual Vehicle Average per Day
Presence of the transit traffic on city streets, even with built motorways towards Slavonia and Zagorje, complicates conducting of local traffic, reduces safety and quality of life. This is particularly the case with the main longitudinal street stroke east-west: Zagrebačka - Bjelovarska - Dugoselska, on which, in the center of Sesvete, connect other transversal main city streets: Ljudevita Posavskog street, Bistrička street and
4.2. Determination of the Coverage Zone
for Conducting Experimental Observation
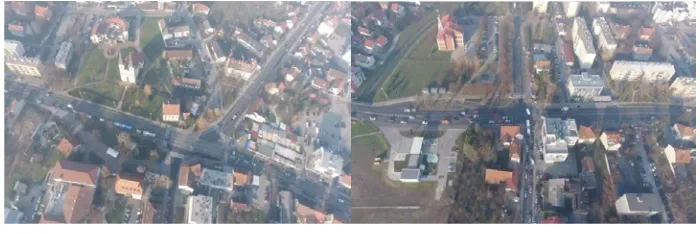
The unmanned aircraft took a snapshot along the main road 700 m west towards the city from intersection of Zagrebačka and Varaždinska streets, and central snapshot on the main intersection of Zagrebačka and Bistrička streets in radius of 200 m (Figure 5). The duration of the video at the site was 30 minutes. The video footage taken at the location is used to investigate traffic density and average annual daily traffic (AADT),reflecting the current situation and long-term traffic conditions. Density (vehicle/ km) is used to measure the level of traffic service while flow (vehicles/hour) is used to estimate AADT. As explained below, two different methods for estimating density and traffic f low have been developed. The first method uses fixed frames (still framework), and the other method uses information obtained from a series of images generated from aerial recording generalized and defined by time and spatial dimensions.
Fig. 5.
Main Road Section of Zagrebačka Road Between Two Intersections (Fixed Frames-Method 1)
5. Parameters Analysis of the Traffic
Towards Classified by Number of Traffic
Figure 6 shows graphically the result of the traffic flows obtained by manual counting method that was did at the same time as the video recording by an unmanned aircraft. A comparative analysis of the traffic flows from the city and to the city is shown. By analyzing the parameters of the traffic flow it is established that a significant number of vehicles was moving from the direction of theFig. 6.
Intersections with Traffic Flows (Results Obtained by Classical Traffic Counting)
6. Methodological Model for Assessing
Parameters of the Traffic Flow by
Application of UAVs
6.1. Method 1- Density and Traffic Flow
from Fixed Frames
The number of personal and freight vehicles can be obtained directly from the video. Given these numbers and the length of the roadway recorded in the photo segment, traffic density can be defined as (Edie, 1963):
(1)
Where is:
L = the length of the roadway (segment) in km;
PC = number of personal cars in the recorded part of the segment;
TR = number of freight vehicles in the recorded part of the segment.
The hardest part here was exactly measuring the length of the roadway (L). For the purposes of this study, the aerial photographs and geo-portal of the Zagreb County and Google Earth were used to measure the distance between observed points (Figure 7). A camera on an unmanned aircraft can be calibrated so that the distance from the ground and distances on the ground can be measurable from fixed frames and obtained photographs. In any case, given the density calculated in equation 1, the hourly volume can be estimated from the fundamental equation:
(2) Where is:
Fig. 7.
Example of Determinating the Distances Between Observed Points on the Road Section
Although the speed cannot be measured with just one photo frame, it can be later determined from the speed limit on the observed part or from the video of an unmanned aircraft. In this study, two approaches for speed estimation were used. The first approach to estimate speed is by using GIS to measure the distance between two visible points obtained from the photo frame. Then video recording was used to measure the travel time along the whole observed segment for as many vehicles as possible. Spatial speed was then estimated as the arithmetic speed of all measured velocities along the observed segment.
(3)
Where is:
ti = the travel time of the i-vehicle in the segment with length L;
m = total number of vehicles.
Another approach to estimating vehicle speed is used when it is difficult or impossible to match the beginning and end of the
segment with the GIS markers. In this case, several vehicles were randomly selected from the obtained photo frame. Each vehicle was tracked for a certain amount of time (a few seconds), lane markers that are passed were counted and travel time was noted. Once again, spatial velocity is estimated to be arithmetic mean of the measured velocities, i.e.:
(4)
Where is:
ni= the number of lane markers that i-vehicle has passed;
l = distance from the start of a first marker to the beginning of the second;
ti= travel time of the i-vehicle.
6.2. Method 2 - Density and Flow from
Serial Frames
density measured by fixed photo frames. The use of fixed frames for the calculation of density discards a multitude of information that could be obtained by using a video footage. As the unmanned aircraft flies over observation area for a longer period of time and at a certain distance, the field of vision is constantly changing, resulting in more difficult measurability of conventional density and f low. Generalized spatial-temporal definition can accommodate field of vision that is changing constantly. For the observed area (A) the spatial-temporal dimensions: density, flow and spatial velocity can be defined as:
(5A)
(5B)
(5C)
Where is:
d(A) = total travel distance of all vehicles in area A;
t(A) = total travel time of all vehicles in area A;
׀A׀ = area A in space-time dimension. By using v ideo recorded a long t he Zagrebačka road, the trajectory of the vehicles are constructed for traffic movement in the west direction (towards city) at 2 second intervals using the GIS calculated position. This procedure is repeated for each lane separately. Similarly, the field of view (FOV) for that part of the traffic is extracted from the video and analyzed in the spatial-temporal dimension showing the trajectories and the field of vision measured in 20 seconds. In case the vehicle exits the observation field before the observation,
the path is extended linearly to the field of view, which is also shown with dotted lines of most trajectories. The flow and density of the observation area extracted from the field of view and the trajectories of the vehicles can be represented with equation (5A-B). In fact, trajectories of vehicles should not be applied, only the places and times where the vehicles enter and exit from the field of view. It is only important to distinguish entrances from exits in the observation area, without monitoring the vehicle through the field of view.
(6A)
(6B)
where i-vehicle enters in the field of view
(FOV) on and exits
from the field of view to .
Boundaries of field of view must be specified and accurate so that it can be measured accurately . Equations 6A and 6B can be summed up along the individual lane, or for the entire section of the road, regardless of the number of lanes and the number of directions in which the vehicles are moving.
6.3. Assessment of AADT
(7)
Where is:
= the time when the video was recorded;
= day and month when video was taken.
Of course, the estimations in equations 2 and 7 are somewhat tedious. Table 2 shows an estimated qH of each of the fixed photo frames
for the observed section of the road ranging
from the largest to the lowest value of AADT from 2300 vehicles per hour to 18000/day. In comparison, method of the fixed photo frames is easier to apply but what makes it problematic is the small sample size of each frame. With this method relatively short sections of the roadway used in every estimation of density and flow can increase any irregularities in the traffic fluctuation, surrounding mismatches, vehicle spots, and other errors. These errors are the main factor in the variability between the AADT framework estimation.
Table 1
Service Level Classified by Density Range (vehicle/km/track) Service Level Basic Segments
A 0-7
B 7-11
C 11-16
D 16-22
E 22-28
F over 28
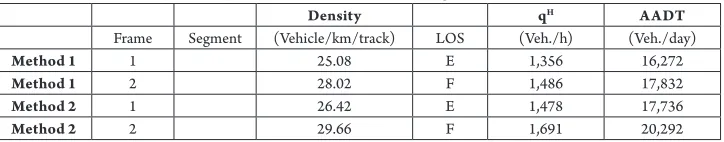
Table 2
Results of the Research of the Traffic Flow Parameters on the Zagrebačka Road Section with Methods
Density qH AADT
Frame Segment (Vehicle/km/track) LOS (Veh./h) (Veh./day)
Method 1 1 25.08 E 1,356 16,272
Method 1 2 28.02 F 1,486 17,832
Method 2 1 26.42 E 1,478 17,736
Method 2 2 29.66 F 1,691 20,292
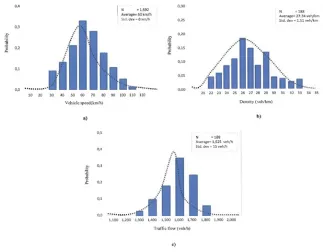
For the analysis of speed, the total 1,592 vehicles datasets were collected at the middle of the Zagrebačka road (Section B) by randomly tracking vehicles moving throughout the operating period. At this footage, the section of 200 meter long and 6.4 meter wide is utilized. UAV records the still footage for every 15 minutes at 90 meter above the ground. The arrival time and departure time of randomly selected vehicles were recorded to calculate the vehicles speed. The results show
For the analysis of density, the total 188 records were collected by selecting the segments along the Zagrebačka road. At the experiment segments, the values of traffic density range from 25.08-29.66 veh/km. Fig. 8(b) shows the traffic density distribution of the segments along the Zagrebačka road. The traffic density is average 27.34 veh/km with the confidence interval of 26.5-28.1 veh/km, while the standard deviation is 1.51 veh/km with the confidence interval of 0.99-1.86 veh/km.
For the analysis of vehicle flow, the total 188 records were used to collect traffic flow along the Zagrebačka road. The result shows that on the average flow of vehicles ranges from 1,356 – 1,691 veh/h. Fig. 8(c) shows the traffic flow distribution of the Zagrebačka road. The traffic flow is average 1,525 veh/h with the confidence interval of 1,480-1,550 veh/h, while the standard deviation is 15 veh/h with the confidence interval of 12-18 veh/h.
Fig. 8.
Distribution of Traffic Flow Parameters (a) Vehicles Speed, (b) Traffic Density; (c) Traffic Flow
6.4. Discussion of Results
Table 2 shows the results of the survey on the section of the Zagrebačka road in Sesvete by using unmanned aerial vehicles. Two methodologies were used in the analysis of
that the analysis of the footage obtained by an unmanned aerial vehicle is a much more efficient method of data collection and analysis of traffic flow parameters than the method of fixed photo frames. The level of service results and the traffic load at the analyzed intersections are particularly concise, especially in the peak hour, where major standstills are created and waiting queues arise.
7. Conclusion
This research represents development of methodologies obtained from the collected data during the survey of the road using unmanned aerial vehicle. Firstly, this paper mainly focuses on the use of UAV in data collection rather than the full analysis of traffic flow parameters data on Zagrebačka road in center of city Sesvete. By analyzing data and using mathematical models, the level of service, average daily traffic and the value of traffic flow (density and flow) are shown. The analysis and processing of the data collected during the observation of the Zagrebačka road and the narrow center of Sesvete has determined overburdening of the main road and the congestion of traffic flows at the both intersections, especially in the peak hours, where large queues of left turners from Zagrebačka road in Bistrička road arise in the afternoon and arising in the morning while right turners join the main road. For this intersection it is recommended to change the signal plan and to extend the cycle of the green signal concept for the described traffic flows. The observation problem is the use of a camera and visual field for the observed part and the lens development to use more functional cameras to extend the traces of the vehicle tracks and to determine the distance of the road section more accurately. The use of unmanned aerial vehicles in transport
is of paramount importance for traffic surveillance, control and traffic analysis, and as such has the future in wider application and traffic planning. The safety and legal issues related to the use of UAV technology must be taken into consideration. The development of unmanned aerial vehicles and application development for automated traffic analysis represent a challenge for future research.
References
AASHTO. 2001. A Policy on Geometric Design of Highways and Streets. American Association of State Highway and Transportation Officials, Washington, D.C., USA. Bertozzi, M.; Broggi, A.; Fascioli, A. 2000. Vision-Based intelligent Vehicles: State of the Art and Perspective,
Robotics and Autonomous Systems 32(1): 1-16.
Bertozzi, M.; Broggi, A.; Cellario, M.; Fascioli, A.; Lombardi, P.; Porta, M. 2002. Artificial vision in road vehicles, In Proceedings of the IEEE, 90(7): 1258-1271. Bishop, R. 2000. Intelligent Vehicle Applications,
Worldwide IEEE Intelligent Systems 15(1): 78-81. Cao, M.; Vu, A.; Barth, M. 2007. A novel omnidirectional vision sensing technique for traffic surveillance, In
Proceedings of the IEEE Intelligent Transportation Systems Conference, 678-683.
Coifman, B.; McCord, M.; Mishalani, R.; Iswalt, M.; Ji., Y. 2006. Roadway Traffic Monitoring from an Unmanned Aerial Vehicle, In IEE Proceedings-Intelligent Transport Systems, 153(1): 11-20.
Dadić, I.; Kos, G.; Ševrović, M. 2014. Theory of traffic flow, textbook.Faculty of transportation and traffic sciences, Zagreb, Croatia.
Edie, L. 1963. Discussion of Traffic Stream Measurements and Definitions. In Proceedings of the 2nd International Symposium on the Theory of Traffic Flow, 139-154.
Eisenbeiss, H. 2009. UAV photogrammetry. Doctoral dissertation, ETH Zurich. 203 p.
GUP. 2016. General Urban Plan of Sesvete. Department of Spatial Planning of the City of Zagreb, Croatia. Hinz, S.; Bamler, R.; Stilla, U. 2006. Airborne and space-borne traffic monitoring, Journal of Photogrammetry and Remote Sensing 61(3): 135-280.
Hinz, S.; Lenhart, D.; Leitloff, J. 2008. Traffic extraction and characterisation from optical remote sensing data,
The Photogrammetric Record 23(124): 424-440. Jiang, Z.; McCord, M.; Goel, P. 2006. Improved AADT Estimation by Combining Information in Image- and Ground-based Traffic Data, Journal of Transportation Engineering 132(7): 523-530.
Lenhart, D.; Hinz, S.; Leitloff, J.; Stilla, U. 2008. Automatic traffic monitoring based on aerial image sequences, Pattern Recognition and Image Analysis 18(3): 400-405.
McCord, M.; Yang, Y.; Jiang, Z.; Coifman, B.; Goel, P. 2003. Estimating AADT from Satellite Imagery and Air Photos: Empirical Results, Transportation Research Record 1855: 136-142.
Micchalopoulos, P.G. 1991. Vehicle detection through video image processing AUTOSCOPE System, IEEE Transaction on Vehicular Technology 40(1): 21-29. PHANTOM 4. 2016. Characteristics of unmanned aircraft. Available from internet: <http://www.dji.com/ phantom-4>.
Wang, G.; Xiao, D.; Gu, J. 2008. Review on Vehicle Detection Based on Video for Traffic Surveillance, In Proceedings of the IEEE International Conference on Automation and Logistics, 2961-2966.