http://www.gjaets.com © Global Journal of Advance Engineering Technology and Sciences 35
Abstract
Queuing is the common activity of customers or people to avail the desire service, which could be processed or distributed one at a time. Bank ATMs would avoid losing their customers due to a long wait on the line. The bank initially provides one or two ATMs in every branch. But, one or two ATMs not serve a purpose when customers withdraw to us ATM and try to use other bank atm. Thus the service time need to be improved to maintain the customers. This paper shows that the queuing theory used to solve this problem. We obtain the data from a bank ATM in the city. We then derive the arrival rate, service rate, utilization rate, waiting time in the queue and the average number of customers in the queue based on the data using little’s theorem and M/M/I queuing model. The arrival rate at a bank ATM on Monday during banking time is 1 customer per minute (CPM) while the service rate is 1.50CPM. The average number of customer in the ATM is 2 and the utilization period is 0.70. It was observed that queuing technique has great positive impact on customers in the bank by 0.5%.
Keywords:ATM, Queuing Model, Queue Technique, Queuing Theory Utilization Period, Arrival Rate.
Introduction
Queue is a common word that means a waiting line or the act of joining a line. Queuing theory was initially proposed by K. Sanjay (2002). It optimizes the number of service facilities and adjusts the times of services (1). Queuing theory is the study of queue or waiting lines. Some of the analysis that can be denied using queuing theory include the expected waiting time in the queue, the average time in the system; the expected queue length as well as the probability of the system to be in certain states, such as empty or full Brown (2004). This paper uses queuing theory to study the waiting lines in Diamond Bank ATM at Okpala Avenue in Enugu State Nigeria. The bank provides two ATM in every branch. In ATM, bank customers arrive randomly and the service time is also random. I used little’s theory and M/M/I queuing model to derive the Arrival rate, Service rate, Utilization ratio, Waiting time in the queue. On average, 600 customers are served on weekdays (Monday to Friday) and 300 customers are served on weekends (Saturday and Sunday) Monthly. Generally, on Fridays there are more customers coming to ATM, during 8am to 4pm compare to other days in a week.
Queuing Theory
A queuing system can be completely described by, i. The Input or arrival pattern (customers) ii. The service mechanism (service pattern). iii. The ‘queue discipline and
iv. Customer’s behavior. Tiwari (2009)
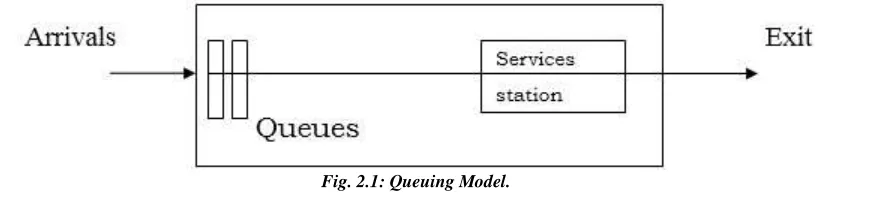
The diagrammatic representation of the above components of queuing system is shown in fig. 2.1:
http://www.gjaets.com © Global Journal of Advance Engineering Technology and Sciences 36
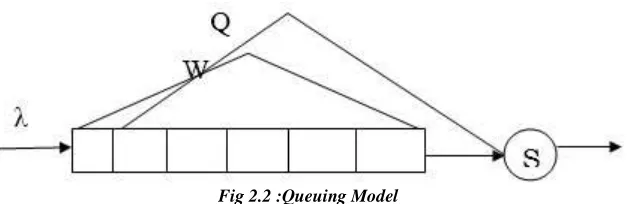
Fig 2.2 :Queuing Model
A queuing system consists of one or more services that provide service to arriving customers. Fig. 2.1. Shows the characteristics of queuing system. The population of customers may be finite (close systems) or infinite (open systems). The customers arrive to the service center in a random fashion. Queue represent a certain number of customers waiting for service. The capacity of a queue is either limited or unlimited. Bank is an example of Unlimited queue length. Hall (1991) Figure 2.2 represents a queuing model, where
Arrival rate (λ) – the average rate at which customers arrive.
Service time (S) – the average time required to service one customer.
Number waiting (w) – the average number of customers waiting.
Number on the system (Q) – the total Number of Customer in the system. Reiman, (2002)
Queuing Methodology
In 1908, Agner K. Erlang worked on the holding times In a telephone Sontech, he identified that the number of telephone conversation and telephone holding time fit into Poisson distribution and exponentially distributed. This was the beginning of the study of queuing theory. In this section, I discuss two common concepts in queuing theory.
QUEUING THEORY
Queuing theorem (4) describes the relationship between throughput rate (i.e. arrival and service rate) cycle time and work In process (i.e. number of customers/jobs in the system). The theorem states that the expected number of customers (N) for a system in a steady state can be determined using the following equation.
L = λT ……… (3.1)
Here, λ is the average customer arrival rate and T is the average service time for a customer. Three fundamental relationship can be derived from queuing theorem
L Increases if λ or T Increase
λ increases if L increases or T decreases
T increases if L increases or λ decreases. R.W Hall (1991)
ATM MODEL (M/M/1 queuing Model). M/M/1 queuing model means that the arrival and service time are exponentially distributed (poission process). For the analysis of the ATM M/M/1 queuing model, the following variables will be investigated.
λ: The mean customers arrival rate ---
µ: The mean service rate
P = λ/µ : Utilization factors ---(3.2)
Probability of zero customer in the ATM
Po = 1-p ---(3.3)
Pn: The probability of having n customers in the ATM
Pn = PoPn = 1-P)Pn ---(3.4)
http://www.gjaets.com © Global Journal of Advance Engineering Technology and Sciences 37
Wq = Lq𝜆 = µ−λP − − − − − − − − − − − − − − − − − − − (3.7) W: The average time spent in th3e ATM, Including the waiting time.
W = 𝐿𝜆 = µ−λ1 − − − − − − − − − − − − − − − − − − − (3.8)
Observations And Analysis
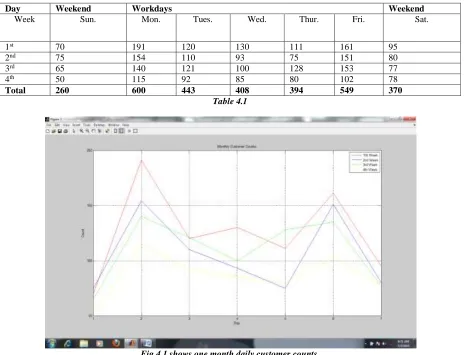
The data was collected for four weeks from Monday to Sunday and the observations were recorded below as shown in table 4.1.
Day Weekend Workdays Weekend
Week Sun. Mon. Tues. Wed. Thur. Fri. Sat.
1st 70 191 120 130 111 161 95
2nd 75 154 110 93 75 151 80
3rd 65 140 121 100 128 153 77
4th 50 115 92 85 80 102 78
Total 260 600 443 408 394 549 370
Table 4.1
http://www.gjaets.com © Global Journal of Advance Engineering Technology and Sciences 38
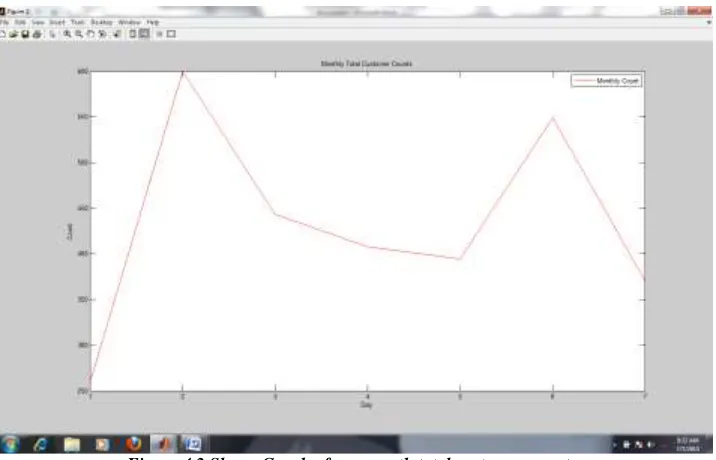
Figure 4.2 Shows Graph of one month total customer counts.
Analysis
From the above table 4,we observe that number of customers on Mondays is double the number of customers on Sundays during the week. The busiest period for the bank ATM is Mondays and Fridays during banking time (8am-4pm). Hence the time period is very important for the research. Also we observed from the figure 4.1 that, after Monday, the number of customers start decreasing slowly as the week progresses. On Sunday it is least and on Wednesday and Thursday it stays slightly more than Saturdays.
CALCULATIONS
Investigation shows that, after Sunday, during the first two days of the week, there are on average of 60 people coming to the ATM per hour during the banking time. From this, arrival rate was derived as:
λ = 60
60 = 1𝐶𝑢𝑠𝑡𝑜𝑚𝑒𝑟𝑚𝑖𝑛𝑢𝑡𝑒 (𝑐𝑝𝑚)
⁄ 4.1
We also figured out from observations discussion with the guard that each customer spend 2 minutes on average in the ATM (W), the queue length is around 3 people (Lq) on average and average waiting time is around 2.5 minutes i.e. 150 seconds.
Theoretically, the average waiting time is
Wq = Lqλ = 3customer1 cpm = 3 𝑚𝑖𝑛𝑢𝑡𝑒𝑠 = 180 𝑠𝑒𝑐𝑜𝑛𝑑𝑠 4.2
Here we can see that, the observed actual waiting time does not differ by much when it is compared with the theoretical waiting time.
Next; Average Number of people in the ATM was calculated using (3.1)
L = 1𝑐𝑝𝑚 𝑥 2 𝑚𝑖𝑛𝑢𝑡𝑒𝑠 = 2 𝑐𝑢𝑠𝑡𝑜𝑚𝑒𝑟𝑠.
Having calculated the average number of customer in the ATM, service rate and utilization rate were derived using (3.5) & (3.2)
http://www.gjaets.com © Global Journal of Advance Engineering Technology and Sciences 39
small as can be derived using (3.3).
Po = 1-p = 1 – 0.70 = 0.3
Therefore the probability of having zero customers in the ATM is 0.3.
The queuing theory provides the formula to calculate the probability of having n customers in the ATM as follows.
𝑃𝑛= (1 − 𝑃)𝑃𝑛 = 1 − 0.70) (0.70)𝑛 (0.30)(0.70)𝑛
We assume that impatient customers will start to balk when they see more than 3 people are already queuing for the ATM.
We also assume that the maximum queue length that a patient customer can tolerate is 10 people as the capacity of the ATM is 1 people, the probability of 4 people in the system can be calculated as (i.e. in the ATM).
Therefore, the probability of customers going away = P (more than 3 people in the queue) = P (more than 4 people in the ATM) is
𝑃5=11= ∑ 𝑃𝑛 11
𝑛−5 = 0.15423 = 15.42%
The utilization is directly proportional with the mean number of customers. It means that the mean number of customers will increase as the utilization increase. The utilization rate at the ATM is 0.70. This however, is only the utilization rate during banking times Mondays and Fridays. On weekend, the utilization rate is almost half of it. This is because the number of customers on weekends is only half of the number of people on weekdays.
In case the customer waiting time is lower or in other words, customer waited for less than 150 seconds, the number of customers that are able to be served per minute will increase. When the service rate is higher, the utilization will be lower, which makes the probability of the customer going away decreases.
This research can help bank ATM to increase its Qos (Quality of Service) by anticipating, if there are many customers in the queue.
The result of this paper work may become the references to analyze the current system and improve the next system. Because the bank can now estimate the number of customers waits in the queue and the number of customers going away each day.
Conclusion
This research paper has discussed the application of queuing theory to the Bank ATM. From the result it was observed that the rate at which customers arrive in the queue system is 1 customer Per minute and service rate is 1.50 customer per minute. The probability of buffer flow if there are 3 or more customers will run away, because may be they are impatient to wait in the queue. This theory is also applicable for the bank, if they want to calculate all the data daily and this can be applied to all branches of ATM also, we hope that this research can contribute to the betterment of a bank in terms of its functioning through ATM.
http://www.gjaets.com © Global Journal of Advance Engineering Technology and Sciences 40
References
1. K. Sanjay, Bose (2002) “ An Introduction to Queuing System Springer”.
2. Ten Chu Cheng Supervised by Lawerence D. Brown (2004) “Analysis of call center data.
3. N.K. Tiwari and Shishir K. Shandilya, (2009) “Operations Research” Third Edition, ISBN 978-81-203-2966-9 eastern Economy Edition
4. Hall, R. (1991), “Queueing Methods for Services and Manufacturing”, Englewood Cliffs, NJ: Prentice-Hall. 5. Garnett, O., Mandelbaum, A., and Reiman, M. (2002), “Designing a Call-Center With Impatient Customers,”
Manufacturing and Service Operations Management, 4, 208–227.