Type of the Paper: Article 1
Security-Constrained Optimal Dispatch of Combined
2Natural Gas and Electricity Networks Using Genetic
3Algorithms
4Denis C. L. Costa¹*, João P. A. Vieira², Marcus V. A. Nunes³. 5
¹ Federal Institute of Science and Technology of Pará, Ananindeua, PA, Brazil; [email protected]; 6
* Correspondence:email:[email protected]; Tel: +55 91 3278-3750 7
² Federal University of Pará, Belém PA, Brazil. [email protected]. 8
³ Federal University of Pará, Belém PA, Brazil. [email protected]. 9
10
Abstract: This paper proposes a method based on genetic algorithm (GA) for the security-constrained 11
optimal dispatch of integrated natural gas and electricity networks, considering operating scenarios 12
in both energy systems. The mathematical formulation of the optimization problem consists of a 13
multi-objective function which aims to minimize both cost of thermal generation (diesel and natural 14
gas) as well as the production and transportation of natural gas. The joint gas-electricity system is 15
modeled by two separate groups of nonlinear equation, which are solved by the combination of 16
Newton's method with the GA. The applicability of the proposed method is tested in the Belgian gas 17
network integrated with the IEEE 14-bus test system and a 15-node natural gas network integrated 18
with the IEEE 118-bus test system. The results demonstrate that the proposed method provides 19
efficient and secure solutions for different operating scenarios in both energy systems. 20
21
Keywords: Integrated Electric Power and Natural Gas Network, Optimal Power Flow, Genetic 22
Algorithm. 23
24
1. Introduction 25
In 2012, the thermoelectric power sector in Brazil generated 73.456 GWh; whereas the share of 26
natural gas increased by 50% [1]. This data provides evidence of the increasing importance of natural 27
gas in the thermal power generation of Brazil, mainly resulting from the high efficiency, low-cost 28
investment, operational flexibility and less environmental impact when compared to diesel [2]. This 29
significant increase in the installation of thermoelectric power plants using natural gas associated 30
with increased electricity demand, prompted this type of power generation to assure a greater 31
participation in electric power supply. 32
On the other hand, this fact creates a strong interdependence between the electrical system and 33
the gas pipeline system, the latter being responsible for the transportation of natural gas from the 34
production well to the consumption point. Traditionally, this interdependence is disregarded in 35
studies of optimal planning of the operation of thermoelectric power plants using natural gas. 36
However, this simplification may affect the safe operation and performance of the joint systems, as 37
pressure losses, contingencies in gas pipelines, lack of storage or interruptions in the supply of natural 38
gas may bring about a cut off of the generating units. In the occurrence of shutdowns of gas pipelines 39
or power transmission lines, inconsistent procedures for cutting off the supply of natural gas to 40
thermal electric generators may restrict the operation of the electrical system or even result in 41
additional shutdowns [3]. The active power adjustment in an arbitrary number of generators may 42
affect the flows in the gas network, which shows the interdependence between both networks [4]. 43
Therefore, this strong dependence operation between these two systems requires a coordinated 44
operation to obtain reduced operating costs and congestion without jeopardize the security of power 45
systems. 46
Various models have been proposed to ensure optimal combined operation of natural gas and 47
electrical networks by means of an unified formulation. In [3], the authors performed an assessment 48
of interdependence between both networks in terms of the impact of market prices of natural gas in 49
the dispatch of the generating units. In [5], the authors presented an multiperiod generalized network 50
flow model focusing on the economic interdependence of the combined system (electric grid, coal 51
and natural gas). In [6], a model was presented to calculate the maximum amount of energy that 52
should be provided to a natural gas combined cycle power plant. In [7], an integrated model of 53
optimal dispatch was proposed to evaluate the impact of the interdependence of electricity and 54
natural gas networks in the operational safety of the electric system. Other studies have proposed 55
methods of optimal dispatch of joint natural gas and electric networks [8]-[12]. All these cited works 56
used conventional optimization methods as a solution to the problem of joint gas-electricity optimal 57
dispatch. 58
The electricity-gas optimal dispatch is a mixed integer, nonlinear, non-convex problem with a very 59
complex solution. Conventional methods of nonlinear programming may not be able to provide an 60
optimal solution taking into account that generally the solution is trapped in on local minima. As an 61
alternative to conventional optimization methods, an evolutionary computation has been used to 62
solve a variety of problems due to its ability to find the global optimum. However, few studies have 63
employed evolutionary computation to solve the problem of joint electricity-gas optimal dispatch. In 64
[13], an optimization methodology based on genetic algorithms (GA) is proposed to determine the 65
pipeline diameter to minimize the cost of the gas network. Nonetheless, the authors did not take into 66
account the model of the electrical grid. A hybrid model is proposed in [14], combining an 67
evolutionary algorithm with Newton's methods and the interior points to plan for the optimal 68
operation of the natural gas and electric systems. However, the work does not take into account the 69
cost of transportation of natural gas in the objective function, which may reduce the overall efficiency 70
of the system considering that the pipeline system must meet the demands for natural gas with the 71
lowest production and transportation costs [15]-[16]. Besides, the authors of [14] did not evaluate the 72
operating interdependence of the gas-electric system from different operational scenarios in both 73
energy systems. 74
In this context, this paper proposes a method based on GA for security-constrained optimal 75
dispatch of integrated natural gas and electricity networks, in order to minimize the costs associated 76
with thermoelectric generation (natural gas and diesel), natural gas production and transportation. 77
The nonlinear algebraic equations representing both systems are solved separately by Newton's 78
method combined with GA in order to assess the optimal dispatch of the global energy matrix under 79
a pre-specified operating condition. 80
The proposed method is described in detail hereinbelow in accordance with the following 81
sections. Section II shows the formulation of the natural gas flow system considering the pipeline and 82
the production nodes and gas consumption. section III describes the integrated electricity-gas optimal 83
dispatch using the GA. The application of the proposed method in two coupled energy systems is 84
presented in section IV. Finally, section V presents the conclusions of the work. 85
2. Natural Gas System Formulation 86
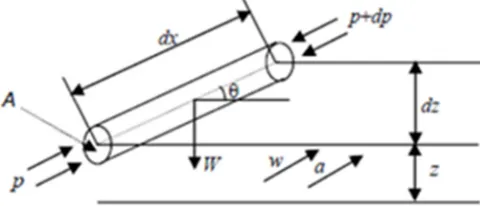
In order to determine the gas flow model in pipelines, it may be admitted as a reference an element 87
of a pipeline of infinitesimal length dx (m) and transversal section A (m2) and consider w (m/s) and a 88
(m/s2)),respectively, the velocity and acceleration of the gas inside this element, W (Kg.m/s2) weight of 89
the gas particles, and p (bar) the external pressure as shown in Figure 1, according to [17]. 90
Figure 1. Parameters of the gas flow in pipelines. 91
Bernoulli's Equation is written as: 93
94
+
2 + =
96
(1) 95
97
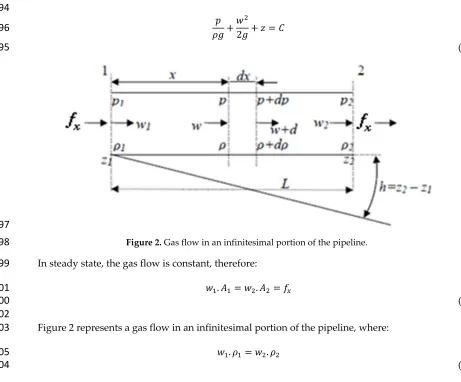
Figure 2. Gas flow in an infinitesimal portion of the pipeline. 98
In steady state, the gas flow is constant, therefore: 99
. = . =
101
(2) 100
102
Figure 2 represents a gas flow in an infinitesimal portion of the pipeline, where: 103
. = .
105
(3) 104
+
2 + =
+
+( + )
2 + ( + ) + ℎ
107
(4) 106
The term dhf represents the losses in the form of heat due to friction of the gas against the pipeline 108
wall and can be quantified by Darcy's equation. 109
ℎ =4
. 2
111
(5) 110
Where f is the friction factor (dimensionless) and D is the inner diameter of the pipeline (m). By 112
replacing (5) in (4), one has: 113
− =2 +
115
(6) 114
Considering equation (3) and the proportionality of density variations, pressure and gas velocity in 116
the pipes, equation (7) is obtained according to [17]. 117
− =2 +
119
(7) 118
=1
122
(8) 121
The gas compressibility factor in the pipeline is given by equation (9). 123
=
125
(9) 124
From equations (7), (8) and (9), equation (10) is obtained. 126
127
− =2 +
129
(10) 128
From equations (2) and (3), equation (11) can be written as: 130
= = ( )= ( )
(0,25 )
132
(11) 131
Where the subscript n indicates the values for the standard pressure and temperature conditions, 133
which are ≅ 0.1 and ≅ 288 . 134
By replacing equation (11) in equation (10), equation (12) is obtained as: 135
− =32 +
137
(12) 136
According to [17], = can be considered, and = for gas, where as = ( ) 138
is for air. By dividing the two expressions for ( ) , equation (13) can be written as: 139
140
( ) = =
142
(13) 141
With being the specific gravity of gas, equation (14) is obtained: 143
144
= .
.
146
(14) 145
By replacing equations (13) and (14) in equation (12), equation (15) can be written as: 147
148
− = 32 ( ) +
. .
150
(15) 149
By integrating equation (15) in the following intervals: = 0; , = ; and = ℎ, equation 151
(16) is obtained: 152
153
− =64 ( ) +
2 .
. ℎ
155
By isolating , equation (17) can be written, which is the equation of gas flow according to [17]. 156
157
( )= 64 . .
( − ) − 2 . ℎ .
159
(17) 158
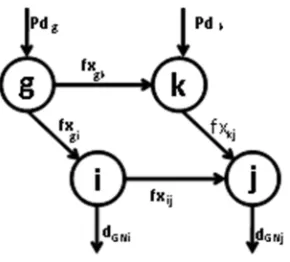
Figure 3 shows the nodes and arcs [16] in a simplified manner. In Figure 3, is the gas production 160
associated with that node, for example, is the natural gas production at node g., ( ) is the 161
flow from one node to another; this means that is the gas flow from node g to node k. Still referring 162
to Figure 3, are the demands for gas in each node. 163
The supply node, which can be a gas well, a reservoir or regasification terminal of LNG (Liquefied 164
Natural Gas), may have contractual supply requirements. Depending on the flexibility of the contract, 165
the supply of natural gas may have a pre-specified range of values, a minimum (Pdmin) and maximum
166
(Pdmax) production. Mathematically: 167
≤ ≤
169
(18) 168
170
171
172
173
174
175
176
Figure 3. Simplified natural gas network. 177
For the nodes on-demand, the consumption value must always meet the demand . 178
In pumping gas in pipelines, there is a maximum value in the operating pressure, which refers to 179
safe pressure levels for the operation and at delivery points to consumers. Moreover, for each node 180
in the system, the gas demand should be met at a certain minimum pressure guaranteed to industries, 181
local distribution companies and thermoelectric power plants. Mathematically: 182
≤ ≤
184
(19) 183
In addition to restrictions of operating limits, there is the flow conservation equation at node i, shown 185
below, ensuring gas balance (Figure 3). In pipelines, there is a relationship between the gas flow 186
transmitted and the pressure difference between end nodes. 187
Mathematically, the flow conservation can be expressed as: 188
189
( ) = ( ) + − |( , )∈
|( , )∈ 191
(20) 190
The gas flow through each passive pipeline ( ) is a quadratic function of the pressures at the end 192
nodes: 193
( ) ( ) = − , ∀( , ) ∈
195
The gas flow through an active pipeline is also a quadratic function of the pressures at the end nodes. 196
In this case, the pressure at the incoming node i (or j) is lower than the pressure at the outcoming 197
node j (or i) (pi< pj) and the gas flows from node i (or j) to node j (or i ) (fij > 0 (or fij > 0) ). Mathematically,
198
= 96,074830. 10
200
(22) 199
201
Where Ap is the set of passive pipelines and Aa is the set of active pipelines and Cij is a constant that 202
depends on the length, diameter and absolute roughness of the pipeline and the gas composition as 203
shown in (23) and (24) 204
205
( ) ( ) ≥ − , ∀( , ) ∈
207
(23) 206
1
= 2 3,7
∈
209
(24) 208
210
3. Combined Natural Gas and Electric Optimal Power Flow Formulation 211
The integrated gas-electricity formulation is obtained by the coupled model of power flow and 212
natural gas flow, considering that the link between both systems is the thermal gas-fired generators 213
which are connected to gas pipelines network. 214
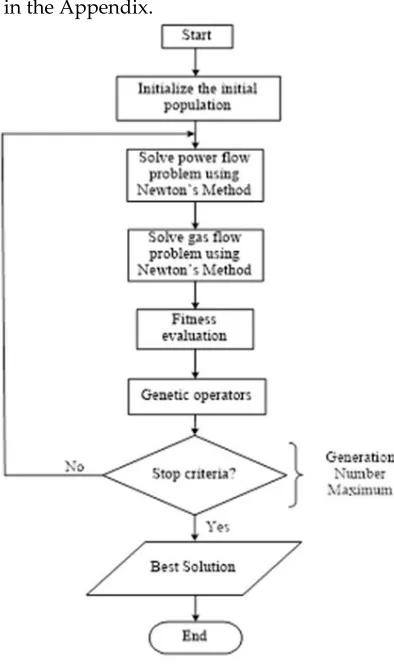
The joint gas-electricity system is modeled by two separate groups of nonlinear equations, which 215
are solved by the combination of Newton's method with the GA. Firstly, the optimal power flow is 216
solved. Next, the gas flow is solved using the values of state variables provided by optimal power 217
flow, in order to assess the steady-state of the overall network. 218
The attractiveness of using Newton's method is the solution with a local quadratic convergence, 219
irrespectively of the dimension of the electric power grid, provided that all the state variables 220
involved in the study are properly initialized. On the other hand, the solution provided by Newton's 221
method can be trapped on local minima. 222
In the power flow solution, the voltage magnitudes are initialized 1.0 p.u. for all uncontrolled 223
voltage bus. Meanwhile the voltage magnitudes and the active power at buses of thermal power 224
generation (diesel and natural gas) are initialized by GA at specified values that remain constant 225
throughout the iterative solution provided by the Newton-Raphson method. The active power of the 226
slack generator is not initialized by GA, considering that this slack bus is responsible for supplying 227
the entire imbalance of active power in the system, even when a sufficient spinning reserve exists on 228
other generators. 229
The strategy adopted for the gas flow solution is similar to that of the load flow. The initial nodal 230
pressures at the pipelines are measured in Baria. The initial values of pressures and gas flow in 231
producing nodes are provided by GA, remaining constant throughout the iterative solution process 232
provided by Newton's method. As for the power flow solution, the gas to be produced by the swing 233
node is not initialized by GA. It is repeated while the maximum generation’s number hasn’t been 234
reached. Therefore, the proposed approach fully takes the advantages of both evolutionary strategy 235
optimization and classical method in the attempt to jump out from the local optimal point. It increases 236
the precision and quickens the convergence. The flowchart of this approach is depicted in Figure 4. 237
The scope of this article is to propose a method of joint electricity-gas optimal dispatch, under 238
security constraints that aims to minimize the total operating cost of the gas-electricity system. 239
Thus, the formulated objective function is represented by: 240
241
. + . + + . + .
243
(25) 242
Subject to: 245
246
( ) = ( ) + −
|( , )∈ |( , )∈
247
248
( ) ( ) = − , ∀( , ) ∈
249 250
( ) ( ) ≥ − , ∀( , ) ∈
251 252
≤ ≤
254 253
≤ ≤
256 255
− ( , ) = ;∀ ∈
257 258
− ( , ) = ;∀ ∈
259 260
, ≤ ≤ , ; ∀ ∈
261 262
( , ) ≤ , ; ∀ ∈
263 264
, ≤ ≤ , ; ∀ ∈
265 266
, ≤ ≤ , ; ∀ ∈
267 268 269
The variables are described in the Appendix. 270
271
Figure 4. Flowchart of the proposed method 272
4. Case Studies 274
The proposed method for optimal dispatch of the power grid combined with the natural gas 275
network is tested in two systems, namely: 276
• Case 1: The Belgian natural gas network integrated to the IEEE 14-bus electric grid; 277
• Case 2: 15-node natural gas network integrated to the IEEE 118-bus electrical grid. 278
279
a) Case 1 280
The proposed method is applied to determine the optimal gas-electricity operation made up by 281
the Belgian natural gas network [16], shown in Fig. 5, and the IEEE 14-bus electric grid [18], illustrated 282
in Fig. 6. The 20-node Belgian natural gas network consists of eight nodes for gas consumption for 283
non-electrical purposes, seven nodes for gas production and 24 pipelines [16]. The node referred to 284
as Zeebugge is considered the slack node. On the other hand, the electric grid is assumed to consist 285
of two natural gas generators connected to bus bars 2 and 3, which are supplied by nodes 4 286
(Zomergen) and 12 (Namur) of the natural gas network, respectively. For analysis purposes, the 287
optimal gas-electricity solution was obtained assuming the following operating conditions in both 288
systems: (a) base case; (b) shutdown of the pipeline between nodes 4 and 14; (c) 20% increase in the 289
total gas demand for non-electric purposes; and (d) 20% increase in the total load of the electrical 290
grid. 291
292
Figure 5. Belgian natural gas network. 293
294 295 296 297 298 299 300 301 302 303 304 305 306 307 308
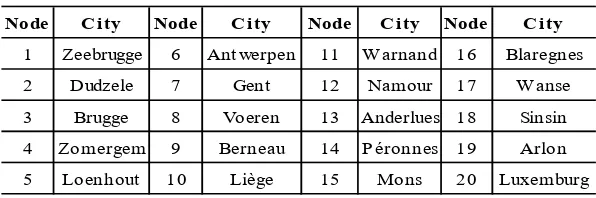
Table 1 shows the correspondence between the nodes of the Belgian natural gas network and the 310
cities to the Figure 5. 311
312
Table 1. Nodes and Cities- Belgian Natural Gas Network 313
314
315
316
317 318 319 320
Table 2 shows the coefficients for the costs of thermal power generation using natural gas 321
(connected to bus bars 2 and 3) and diesel (connected to the buses 1 and 4) of the 14-bus electric grid. 322
Figures 7, 8 and 9 show the results of the joint electricity-gas optimal dispatch with power provided 323
by natural gas and diesel-fired generators, the natural gas flows and nodal pressures of the gas 324
network, respectively. Table 3 presents the total costs of the integrated electricity-gas optimal 325
dispatch with the cost of thermoelectric power generation (gas and diesel) and the production and 326
transportation costs of natural gas. The results presented are related to the operating conditions: (a), 327
(b), (c) and (d). 328
All generators have regulated their active powers to meet the economic criteria, according to the 329
operation scenario without compromising the security of the gas-electricity system. The voltages in 330
the buses of the electric system, the thermal capacity of lines and transformers and reactive capacity 331
of the generators were not violated. 332
333
Table 2. Operational Characteristics of Gas- and Diesel-Fired Generators 334
Unit
Cost coefficients ($/MWh)
PG,min (MW)
PG,max (MW) a1 b1 c1
1 2239 21.02 0.009 10 150
4 1469 19.71 0.077 10 100
335
Tower (node)
Unit
Gas supply coefficients (Mm3/Mw)
PG,min (MW
)
PG,max (MW
)
K0 K1 K2
Zomerge n (4)
2 0.00 0.005 0.00 0 100
Namur (12)
3 0.00 0.005 0.00 0 100
336
Figure 7 shows that natural gas-fired generators injected a greater amount of active power 337
compared to diesel generators for the base case (a), showing the efficiency of the method to minimize 338
the cost of thermal power generation (natural gas and diesel). For cases (b) and (c), which correspond 339
to different scenarios of the gas network in relation to the base case, figure 7 illustrates that natural 340
gas-fired generators also injected more active power when compared to diesel-fired generators. 341
The model adopted first solves the optimal power flow through Newton´s method combined with 342
GA, and subsequently solves for the gas flow also by Newton's method combined with GA. In other 343
words, in case there are no changes in the scenarios in the electric grid, the results to be obtained for 344
the optimal dispatch of thermal units tend to be very close. These similar results take into account 345
Node City Node City Node C ity Node City
1 Zeebrugge 6 Antwerpen 11 Warnand 16 Blaregnes
2 Dudzele 7 Gent 12 Namour 17 Wanse
3 Brugge 8 Voeren 13 Anderlues 18 Sinsin
4 Zomergem 9 Berneau 14 Péronnes 19 Arlon
that the GA has associated structures to the probability. For this reason, the generation levels obtained 346
for cases (b) and (c) are close to those in case (a). On the other hand, cases (b) and (c) could have been 347
critical considering that both the shutdown of a pipeline and the increase of gas consumption for non-348
electrical purposes could have restricted the supply of natural gas to generating units. However, the 349
solution of the gas flow converged to cases (b) and (c), ensuring the supply of natural gas to nodes 4 350
and 14, which in turn correspond to the nodes that supply the gas-fired generators. It is important to 351
note that producing nodes store gas for supply in scenarios of increased natural gas demand. For case 352
(d) both the diesel and gas-fired generators contribute with the increase in electric demand. 353
Figures 8 and 9 illustrate the flow in the pipeline network and the pressures at each node of the 354
network, respectively. It is possible to notice in case (b) an interruption of the gas flow in the branch 355
between nodes 4 and 14. Such contingency causes a reduction in gas production illustrated in Fig. 10 356
in nodes 1, 2 and 5, reducing the flow in the pipelines located in the upper part of the gas system. 357
Since node 14 does not receive gas from node 4, gas production in nodes 8, 13 and 14 increases to 358
maintain the systems supplied. 359
360 361 362 363 364 365 366 367 368 369 370
Figure 7. Optimal dispatch of diesel and gas-fired generators [MW]. 371
372 373 374 375 376 377 378 379 380 381 382 383
Figure 8. Natural gas flows at pipelines [m3/h]. 384
385 386 387 388 389 390 391 392 393 394 395 396
Case (c) reflects an increase in the demand for gas for non-electrical purposes. This condition 398
causes an increase in gas supply and an increased gas flow transported in pipelines and the pressures 399
of the nodes, as can be observed in Figures 8 and 9. For the scenario applied in case (d), which refers 400
to an increased electrical power demand, it can be observed in Figs. 8 and 9 that the branches 401
responsible for supplying nodes 4 and 12 (nodes that supply the thermal gas-fired generators) 402
undergo an increase in gas flow without a significant pressure variation in the nodes. 403
404 405 406 407 408 409
410
411
412
Figure 10. Gas Production [Mm3]. 413
414
The scenario presented in Case (b) simulates an interruption in the pipeline between the cities of 415
Zommergen (node 4) and Perrones (node 14). This contingency causes a division of the gas network 416
in two systems, generating an islanding pipeline. So producers nodes located in the cities of 417
Zeebrugee (node 1), Dudzele (node 2) and Lorenhout (node 5) decrease the level of natural gas 418
production, as shown in Figure 10. Consequently, the gas flow in the branches 1-2, 2-3, 3-4, 5-6, 6-7 419
and 7-4 reduces in the same proportion in accordance with Figure 8, since there isn´t a demand gas 420
from node 4 to node 14. 421
In the lower portion of the gas system an inverse process occurs. Without the amount of gas 422
transported from node 4 to 14, the producers nodes located in the cities of Voeren (node 8), Anderlues 423
(node 13) and Perrones (node 14) increase their level of gas production (Figure 10), causing an 424
increase in the gas flow in that part of the pipeline network (Figure 8). Thus, the Genetic Algorithm 425
(AG) evaluate the levels of security of electric and gas system and optimizes the solution to new 426
values of the costs, as shown in case (b) of the Table 3 below. 427
This scenario demonstrates the importance of the security-constrained studies related with 428
integration of gas network and electric systems. At the same time it´s possible to guarantee the 429
process of cost optimization (minimization of costs) based on GA as described previously. 430
Table 3 depicts the operating costs for each scenario. It is observed that the costs are subject to 431
individual variations due to the contingency brought about in the respective simulation. The largest 432
identified cost refers to the increase in electricity demand, represented by scenario (d). 433
434
Table 3. Optimal Dispatch Costs 435
436 437 438 439 440 441
It’s verified that contingency in the pipeline between 4 and 14, represented by the case (b) causes 442
an increase in the cost of gas production and a reduction in cost of transportation. The 1st situation 443
is explained by the need of the node 8 from the gas network to produce a portion of gas higher than 444
Scenaries Case A Case B Case C Case D
Generation cost 5365,50 5,371.82 5,351.17 6,654.60
Gas production cost 2880,20 2905.00 2,991.40 3,032.76
Gas transport cost 709,83 763.20 819.77 777.67
Gas total cost 3590,00 3,668.20 3,811.17 3,810.43
its optimal value. The 2nd situation is related to disruption in the gas flow in a branch of 55 miles 445
long. 446
b) Case 2 447
The proposed method is also applied to obtain the optimal dispatch of the electricity-gas system 448
made up of the 15-node natural gas network [8], shown in Figure 11, and the IEEE 118-bus electric 449
grid [18], shown in Figure 12. The 15-node natural gas network consists of five nodes for the 450
consumption of gas for non-electrical purposes, and two nodes for gas production, and 16 gas 451
pipelines. Node 1, is considered the slack node. Table 4 shows the operational characteristics of these 452
networks. 453
On the other hand, the 118-bus electric grid is assumed to be made up of 118 buses for nineteen 454
generators, out of which 8 gas-fired generators and 11 diesel-fired generators. For analysis purposes, 455
the optimal gas-electricity solution was obtained assuming the operating conditions in both 456
networks: (a) base case; (b) shutdown of two gas pipelines between nodes 3 and 4 and another 457
between nodes 13 and 14; (c) 20% increase in the total gas demand for non-electric purposes; and (d) 458
a 20% increase in the total power of the electric grid. 459
460
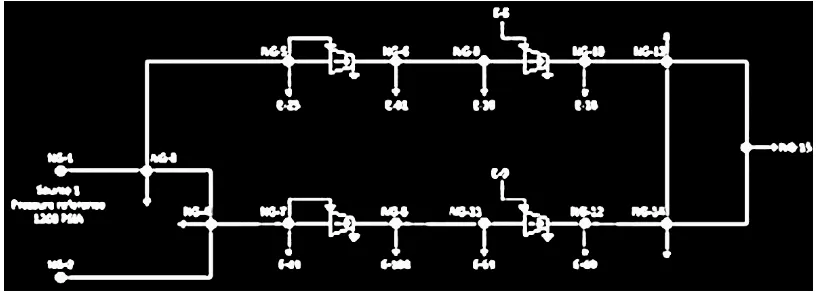
Figure 11. 15-node natural gas network. 461
462 463
464 465
Figure 12. IEEE 118-bus network. 466
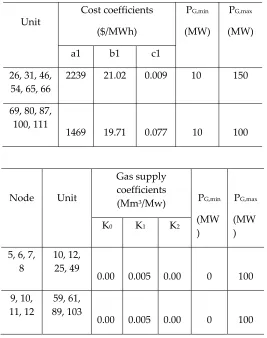
Table 4. Operational Characteristics of Gas and Diesel-Fired Generators 468
Unit
Cost coefficients
($/MWh)
PG,min
(MW)
PG,max
(MW)
a1 b1 c1
26, 31, 46, 54, 65, 66
2239 21.02 0.009 10 150
69, 80, 87, 100, 111
1469 19.71 0.077 10 100
469
Node Unit
Gas supply coefficients
(Mm3/Mw) PG,min (MW )
PG,max
(MW )
K0 K1 K2
5, 6, 7, 8
10, 12, 25, 49
0.00 0.005 0.00 0 100
9, 10, 11, 12
59, 61, 89, 103
0.00 0.005 0.00 0 100
470
Figures 13, 14 and 15 show the results of integrated gas-electricity optimal dispatch with the 471
powers provided by natural gas and diesel generators, the natural gas flows, and the nodal pressures 472
of the gas network, respectively. Table 5 presents the total costs of integrated gas-electricity optimal 473
dispatch with the cost of thermoelectric power generation (gas and diesel) and the costs for the 474
production and transportation of natural gas. The results presented are related to the operating 475
conditions: (a), (b), (c) and (d). 476
As can be observed in Figure 13, all generators regulate their active powers to meet the economic 477
criteria according to the operation scenario without compromising the security of the gas-electricity 478
system. Figure 13 shows that natural gas-fired generators connected to buses 10 and 89, respectively, 479
injected a greater amount of active power compared to the other generators in the system to the base 480
case (a), showing the efficiency of the method to minimize the cost of thermoelectric power 481
generation (gas and diesel). 482
483 484 485 486 487 488 489 490 491 492 493 494
496
It’s noted that contingency in the pipelines between the nodes 34 and 1314, represented by 497
the case (b), causes an increase in the cost of gas production and a reduction in cost of transportation. 498
Again the 1st situation is explained by the need of the node 2 produce a quantity of gas higher than 499
its optimal value. The 2nd situation is related to disruption in the gas flow in the branches cited above, 500
as shown in Figure 14. 501
502 503 504 505 506 507 508 509 510 511 512
Figure 14. Natural gas flows in pipelines [m3/h]. 513
514 515 516 517 518 519 520 521 522 523 524 525 526
Figure 15. Nodal pressures [bar]. 527
528 529
As expected, case c) returns an increase in gas flow transported in pipelines, the pressures of the 530
nodes and in gas production, as can be observed in Figures 14, 15 and 16 respectively. 531
Table 5 shows the operating costs for the scenarios presented herein. It is verified that the costs 532
are subject to individual variations due to the contingency brought about in the respective simulation. 533
Similar to case 1, the largest identified cost refers to the increase in electricity demand, represented 534
by scenario (d), because this scenario reflects an increase in the generation of electricity in diesel-fired 535
power plants. 536
537 538 539 540 541 542 543 544 545 546 547
549
Table 5: Optimal Dispatch Costs 550
551 552 553 554 555 556 557
5. Conclusions 558
This paper proposes a genetic algorithm-based optimal dispatch method of integrated gas-559
electricity networks, considering operating scenarios. A mathematical model of this problem was 560
formulated as an optimization problem where the objective function is to minimize both cost of 561
thermal generation (diesel and natural gas) as well as the production and transportation of natural 562
gas subject to electric system and natural gas pipeline constraints. 563
The integrated electricity-gas optimal power flow problem is solved using a hybrid approach 564
which combines genetic algorithm with Newton’s method. The tests on the Belgian gas network 565
integrated with the IEEE 14-bus test system and the 15-node natural gas network integrated with the 566
IEEE 118-bus test system demonstrate the effectiveness of the proposed optimal dispatch approach 567
taken into account Gas transportation cost and security-constrained which were guaranteed even in 568
contingencies conditions of the gas system and demand variable as demonstrated in both cases. 569
570 571
Appendix 572
g
C
- electricity generation cost; 573T
C
- natural gas transportation cost; 574PG
-active power generated; 575ger
P
- Active power from gas and diesel-fired generators; 576B
N
- bus number; 577G
N
- generators number; 578i
Ψ
- complex power injection; 579Gi
P
,P
Li- active power generated and demand at bus i; 580Gi
Q
,Q
Li- reactive power generated and demand at bus i ; 581,min
i
V
,V
i,max- voltage limits; 582,
V
θ
- Voltage Magnitude and angle of electric bus; 583ij
P
- Active power between bus i e j; 584,max
ij
P
- active power limitation in line ij; 585,min
Gi
Q
;Q
Gi,max- reactive power limits. 586587 588
References 589
[1] MME, Ministry of Mines and Energy, 2012. [Online]. Available: http://www. mme.gov.br 590
[2] S. M. Kaplan, “Displacing coal with generation from existing natural gas-fired power plants,” 591
CRS Report for Congress, 7-5700, R41027, Jan. 19th, 2010 [Online]. Available: 592
http://assets.opencrs.com/rpts
593
Scenaries Case A Case B Case C Case D
Generation cost 136,344.23 137,025.77 136,437.12 228,560.00
Gas production cost 10,277.05 10,538.00 12,129.00 11,278.00
Gas transport cost 1,461.63 1,406.00 1,855.40 1,739.90
Gas total cost 11,738.68 11,944.00 13,984.40 13,017.90
[3] M. Shahidehpour, Y. Fu, and T. Wiedman, “Impact of natural gas infrastructure on electric 594
power systems,” Proc. IEEE, vol. 93, no. 5, pp. 1042–1056, May 2005. 595
[4] A. M. Mares and C. R. F. Esquivel, "A unified gas and power flow analysis in natural gas and 596
electricity coupled networks", IEEE Trans. Power Syst., vol. 27, no. 4, pp. 2156–2166, Nov. 2012. 597
[5] A. Quelhas, E. Gil, J. D. McCalley, and S. M. Ryan, “A multiperiod generalized network flow 598
model of the U.S. integrated energy system: Part I—Model description,” IEEE Trans. Power Syst., 599
vol. 22, no. 2, 600
pp. 829–836, May 2007. 601
[6] J. Munoz, N. Jimenez-Redondo, J. Perez-Ruiz, and J. Barquin, “Natural gas network modeling 602
for power systems reliability studies,” in Proc. IEEE/PES General Meeting, Jun. 2003, vol. 4, pp. 23– 603
26. 604
[7] L. Tao, M. Eremia and Shahidehpour "Interdependency of natural gas network and power 605
systems security", IEEE Trans. Power Syst., vol. 23, no. 4, pp. 1817–1824, Nov. 2008. 606
[8] S. An, Q. Li, and T. W. Gedra, “Natural gas and electricity optimal power flow,” in Proc. 607
IEEE/PES Transmission and Distribution Conf. Expo., 2003, vol. 1, pp. 7–12. 608
[9] C. Liu, M. Shahidehpour, Y. Fu, and Z. Li, "Security-constrained unit commitment with 609
natural gas transmission constraints," IEEE Trans. Power Syst., vol. 24, no. 3, pp. 1523–1536, Aug. 610
2009. 611
[10]Arnold, M. & Andersson, G. "Decomposed electricity and natural gas optimal power flow", 612
Proceedings of 16th Power Systems Computation Conf. (PSCC), Glasgow, Scotland, Jul. 2008. 613
[11]Chaudry, M.; Jenkins, N. & Strbac, G. "Multi-time period combined gas and electricity network 614
optimisation", Elec. Power Syst. Research, Vol. 78, No. 7, pp. 1265-1279. 2008. 615
[12]Geidl, M. & Andersson, G., "Optimal power flow of multiple energy carriers", IEEE Trans. Power 616
Syst., Vol. 22, No. 1, pp. 145-155. 2007. 617
[13]O. F. M. El-Mahdy, M. E. H. Ahmed and S. Metwalli, "Computer aided optimization of natural 618
gás pipe networks using genetic algorithm" Applied Soft Computing, Vol 10, no 4, Sep 2010, pp. 619
1141-1150. 620
[14]C. Unsihuay, J. W. Marangon Lima, and A. C. Zambroni de Souza, “Modeling the integrated 621
natural gas and electricity optimal power flow,” in Proc. IEEE/PES General Meeting, Jun. 2007, pp. 622
24–28. 623
[15]D. Wolf and Y. Smeers, "Optimal dimensioning of pipe networks with application to gas 624
transmission networks", Operations Research, vol. 44, no. 4, Jul/Ago 1996, pp. 596-608. 625
[16]D. Wolf and Y. Smeers, "The Gas transmission problem solved by an extension of the simplex 626
algorithm", Management Science, vol. 46, no. 11, November 2000, pp. 1454-1465. 627
[17]A. J. Osiadacz, Simulation and analysis of gas networks, London: E. & F. N. Spon, 1987, pp. 273. 628
[18][Online]. Available: http://www.ee.washington.edu/research/pstca/. 629

![Figure 7. Optimal dispatch of diesel and gas-fired generators [MW].](https://thumb-us.123doks.com/thumbv2/123dok_us/1019209.1601922/10.595.161.420.270.404/figure-optimal-dispatch-diesel-gas-fired-generators-mw.webp)
![Figure 10. Gas Production [Mm3].](https://thumb-us.123doks.com/thumbv2/123dok_us/1019209.1601922/11.595.166.446.172.304/figure-gas-production-mm.webp)