Whole virus detection using aptamers and
paper-based sensor potentiometry
Subhashish Dolai and Massood Tabib-Azar * University of Utah
* Correspondence: a[email protected]
Abstract: Paper-based sensors, microfluidic platforms and electronic devices have attracted attention in the past couple of decades because they are flexible, can be recycled easily, environmentally friendly, and inexpensive. Here we report a paper-based potentiometric sensor to detect the whole Zika virus for the first time with a minimum sensitivity of 2.6 nV/Zika and a minimum detectable signal (MDS) of 1.2x10⁶ Zika. Our paper sensor works very similar to a P-N junction where a junction is formed between two different wet regions with different electrochemical potentials near each other on the paper. These two regions with slightly different ionic contents, ionic species and concentrations, produce a potential difference given by the Nernst equation. Our paper sensor consisted of a 2-3 mm x 10 mm segments of a paper with a conducting silver paint contact patches on two ends. The paper is dipped in a buffer solution containing aptamers designed to bind to the capsid proteins on Zika. Atomic force microscopy and Raman spectroscopy were carried out to verify both the aptamer and Zika become immobilized in the paper. We then added the Zika (in its own buffer) to the region close to one of the silver-paint contacts. The Zika virus (40 nm diameter with 43 kDa or 7.1x10⁻²⁰ gm weight) became immobilized in the paper’s pores (as shown using AFM and Raman spectra) and bonded with the resident aptamers creating a concentration gradient. The potential measured between the two silver paint contacts reproducibly became more negative upon adding the Zika. We also showed that an LCD powered by the sensor, can be used to detect the sensor output.
Keywords: Paper based sensor; whole virus; Zika; Aptamer.
1. Introduction
Sensors built with paper as substrate have short response time, are low-cost [1] and they are flexible [2], [3]. Moreover, they are biodegradable and suitable for mass deployment in resource limited areas and can be easily used by unskilled operators. Paper is also great medium for immobilizing and trapping and in some cases binding with biomolecules. Its porous structure with large connected pores composed of cellulose fibers allows to transport liquid by means of capillary forces that result in short response time. The porous structure also allows any particle or species to remain immobilized in the paper structure. Paper can also be functionalized with certain materials for selective sensing like nitrocellulose paper used for immobilizing nucleic acids [4]. Paper-based potentiometric sensors have been reported for detecting many ions and proteins [4]–[7]. Potentiometric paper-based sensors [1], [8]–[16] utilize gradients of ion distributions that generate open circuit voltages (Voc) to transduce analytes.
There are many Zika sensors and detection methods reported in the literature. These include serum analysis using the antibody detection assays [17], [18] and detection of viral RNA using molecular-based techniques like conventional polymerase chain reaction (PCR). Real-time reverse transcription polymerase chain reaction (RT-PCR) [19]–[25] to sense Zika has also been reported. These techniques involve using viral antibody or DNA/RNA extraction followed by labelled detection using fluorescent probes. They provide high sensitivity and specificity but require specialized equipment and expensive procedures and are time consuming. The paper-based sensors are fast, inexpensive and can be used in regions with limited resources. We show that a simple LCD
can be used to measure the sensor output with the power generated with the sensor itself. The paper sensor reported here can be modified by replacing its aptamer with aptamers for other viruses, such as corona virus, pathogens and even bacteria.
Our work shows for the first time that a potentiometric paper sensor can reliably detect a whole virus using standard printer papers. Paper can be functionalized with antigens or aptamers. Aptamers are single strand DNA structures that are artificially grown to detect biomolecules and pathogens with high specificity [26], [27]. In our sensors, the paper is functionalized with Zika aptamer and when Zika was added to one side of the paper, it resulted in a concentration gradient with the associated electrochemical potential difference. Electrical contacts to the paper sensor can be made with Graphene [15], [16] conducting glues and epoxies or silver paint that was used here. We also developed a proof-of-concept device (Fig. 2(a)) that can be printed with silver paint contacts or any other conducting inks. We also showed that the paper-based Zika sensor can be connected to an LCD for electronic readout.
2. Theoretical Background
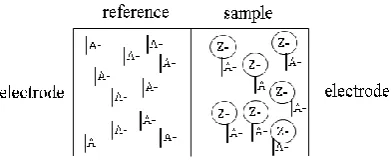
The charge distribution and ionic transport of different charged species in the paper device and the resulting open circuit voltage, can be explained using phase boundary model formed by two different ionic species (aptamer in the background and Zika added on the positive side). The electrochemical potential difference is a sum of the phase boundary potentials [28] between the Zika/aptamer-electrode (Voc1), the liquid junction potential [29], [30] between the Zika/aptamer-aptamer (Voc2) and between the aptamer-electrode due to concentration difference of the Zika between the reference aptamer-buffer soaked paper (Voc3), results in the sum-total open circuit voltage or the zero-current potential (Voc=Voc1+ Voc2 +Voc3). Fig. 1 shows the schematic of the phase boundary between electrodes and the paper and liquid junction potential at the center. The phase boundary potential between the Zika/aptamer-electrode interface is obtained from the Nernst equation and has a logarithmic dependence with the concentration of Zika sample.
[
𝑍𝑖𝑘𝑎−]
⇌[
𝑍𝑖𝑘𝑎]
+ 𝑒−𝑉𝑜𝑐1 = 𝑉0− 𝑅𝑇 𝑛1𝐹𝑙𝑛
1 [𝑍𝑖𝑘𝑎−].
where, 𝑉0 is the constant standard potential (V), R is the gas constant, T is temperature (K), F is
the faraday constant (C/mol) and n1 is the number of electron (mol). The phase boundary potential at the aptamer-electrode interface is similar to above expression and is given by, 𝑉𝑜𝑐3= 𝑉0−
𝑅𝑇 𝑛3𝐹𝑙𝑛
1
[𝑎𝑝𝑡𝑎𝑚𝑒𝑟−], where the symbols have their usual meaning. The liquid junction potential between
Zika/aptamer-aptamer can be written in the form [31, 32],
𝑉𝑜𝑐2= − ∑
𝑅𝑇 𝐹𝑧𝑖
∫ 𝑡𝑖𝑑(ln 𝐶𝑖) 𝑚
1 𝑖
where, 𝑧𝑖 is the signed valence of the particular sample species, 𝐶𝑖 denotes the activity of the
ions/sample species and 𝑡𝑖 is the transference number and signifies the fractional conductance of the
ith ion/sample species. The transference number defined by 𝑡
𝑖=
|𝑧𝑖|𝑢𝑖𝑀𝑖
Additionally, Zika (40 nm diameter) becomes immobilized in the paper fibers with the aptamers (reason discussed earlier with the AFM studies), hence there is no diffusion of Zika species through the interface, which allows phase boundary model to be implemented in this scenario. The selectivity of Zika is addressed with the use of Zika aptamer in section 4.
Figure 1. Schematic of the phase-boundary potential model with the electrodes and liquid wherein the potential is given by uneven distribution of the sample ions/particles.
3. Materials and Methods:
The devices used in our work (Fig. 2) consisted of a sample holder with two clips and electrodes mounted on a glass slide. The devices were then connected to a data acquisition system (NI-USB 6341 DAQ) and a computer with custom LabVIEW program (Fig. 2b). We measured the open circuit voltage (Voc) of the paper device connected with the two clips as a function of time. The glass slide was located inside a grounded copper enclosure to shield and improve the signal-to-noise ratio. Paper strips (0.2-0.3 cm x 1 cm) used in our devices were manually cut from a standard printer paper and were contacted with silver paint (from Ted-Pella). These paper devices were then coated with appropriate analytes such as de-ionized (DI) water/buffer/aptamer and buffer/Zika solutions.
(a) (b)
Figure 2. Schematic of the (a) proposed printed paper device. (b) experimental setup.
Figure 3. Predicted structure of the aptamer (Image courtesy: BasePair Biotechnologies Inc. [33])
4. Results and Discussions
The open circuit voltage (Voc) of a water-coated paper device with the buffer solution introduced on the positive contact side is shown in Fig. 4 as a function of buffer concentration. The Voc is given by the concentration gradient of the same ionic species C1 on the positive contact and C2 on the negative contact by the Nernst equation: 𝑉𝑜𝑐 =
𝑘𝑇 𝑞 ln (
𝐶1
𝐶2), where 𝑘𝑇
𝑞 is the thermal voltage. The
voltage reaches the highest value when the concentration gradient is maximum. The Voc also depends on the water content of the paper and paper material that determines the diffusion rate of the ionic species introduced. The Zika virus becomes entangled and immobilized in the pores of the paper. This results in a space charge region similar to a semiconductor P-N junction giving rise to Voc.
Figure 4. Voc vs percentage volume concentration of buffer with one side of the paper dipped in DI water and
the other side with the diluted buffer solution.
The Zika virus has a small residual negative charge (shown in Fig. 5(a)) that reduces the Voc as soon as it was added to the paper strip. To demonstrate that the Zika (40 nm diameter) was immobilized in the paper, Zika solution was added to a paper device. The buffer diffuses in the paper easily and its concentration gradient diminishes as a function of time. But Zika being immobilized cannot diffuse and the Zika concentration gradient is maintained as shown by the change in Voc (Fig. 5). If Zika was also mobile, the resulting Voc will diminish as a function of time as the Zika diffuses.
(a) (b)
Figure 5. Zika introduced a) at t= 7.45 min to paper device presoaked in Zika to demonstrate net negative charge of the virus and b) at t=0.5 min and t=3.1 min to a dry paper device to demonstrate that as the Zika is applied on the positive side, it stays immobilized in the applied region as the buffer spreads maintaining the voltage level.
0 0.025 0.05
0 20 40 60 80 100
Voc
(V
)
% Buffer conc.
-0.15 -0.13 -0.11
0 5 10 15
V
o
c
(V
)
t (min)
Zika
-0.11 -0.09 -0.07 -0.05
0 1 2 3 4
Voc
(V)
t (min)
Zika droplet
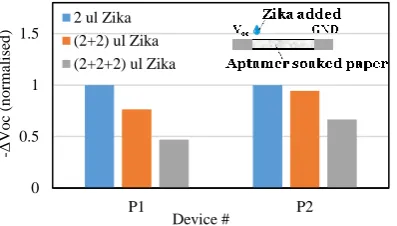
Fig. 6 shows the Vocchange (∆Voc) after adding Zika on the positive side of the aptamer-coated paper device as a function of Zika concentration. Zika-aptamer binding redistributes their charges. Once all the resident aptamers bind with Zika, the only changes in the device charge content and its gradient are introduced by the additional Zika alone that is (slightly) negatively charged. Thus, successive additions of Zika initially introduced larger changes in the device Voc followed by smaller changes once all the resident aptamers are saturated as shown in summary in Fig. 6. The average “point” sensitivity was measured to be 2.6 nV/Zika from the average ∆Voc of ~ 18 mV for 2 µl Zika. The sensitivity was nearly the same for 4 l Zika in device P1 but not in device P2 (Fig. 6). The paper-based sensor’s output response had a noise voltage of 2 mV and the minimum detectable voltage was 1 mV that resulted in the MDS of 1.2x10⁶ Zika.
Figure 6. 2 µl of diluted Zika added to aptamer-soaked paper at each instance (total 3 times) repeated on 2 separate paper devices (P1, P2).
To verify the presence of aptamers and Zika in the paper-based devices we carried out two additional experiments. The first series of experiments used atomic force microscopy (AFM) to image Zika-coated regions of the paper-based device as shown in Fig. 7(a). Although one can see large Zika complexes, individual Zika viruses could not be resolved. The paper has very large surface roughness in excess of 2 m rms that prevented performing high spatial resolution scans. We then performed AFM scans on aptamers and Zika deposited on gold-coated glass samples. As can be seen in Fig. 7(b) one could resolve individual Zika viruses on gold.
Next, AFM studies using AFM probes with aptamer-functionalized beads were carried on paper-based devices coated with different analytes. These studies showed that the aptamer-functionalized AFM probe measured larger stiction forces with papers coated with aptamers and then Zika papers with only aptamer or Zika alone. The results are shown in Fig. 7 (d). The stiction force of Zika/aptamer/paper was higher due to aptamer-specific binding with Zika that was anchored to its aptamer anchored to the paper.
(a) (b)
0 0.5 1 1.5
P1 P2
-Δ
V
o
c
(n
o
rmal
ise
d
) 2 ul Zika
(2+2) ul Zika (2+2+2) ul Zika
Device #
36.7 nm
41.7 nm
35.4 nm 79 nm 194.2 nm
132 nm
88 nm 95.2 nm
(c) (d)
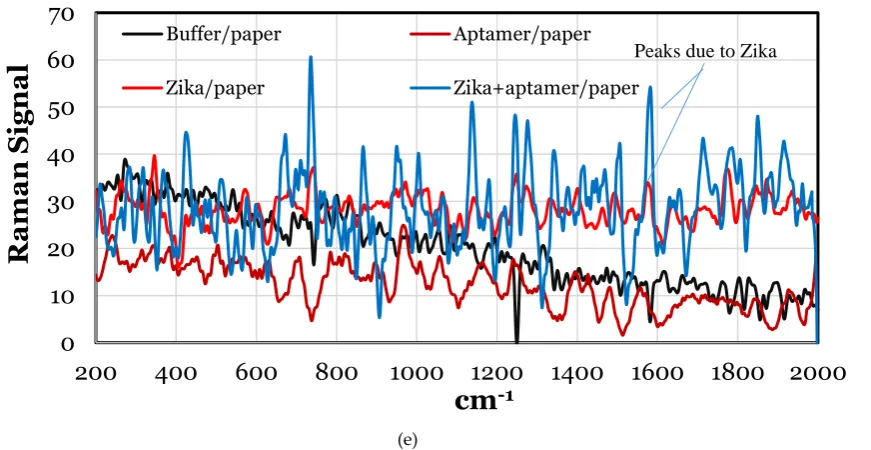
Figure 7. a)AFM imageof the Zika on aptamer-coated paper. The scale is 10 µm. b) AFM image of Zika on gold substrate showing the Zika step height of ~ 40 nm to demonstrate Zika on the aptamer-coated gold surface. c) Photograph of the AFM tip with a single microbead (Diameter ~ 150 µm). d) AFM stiction force measured using the AFM tip (c) with bead coated with aptamer specific to Zika. e) Raman spectra of buffer/paper, aptamer/paper, Zika/paper and Zika/aptamer/paper. The spectra are normalized with dry paper Raman spectrum. These spectra clearly show the difference between aptamers, Zika and buffer deposited on paper.
The second set of experiments used Raman spectroscopies on paper-based devices coated with different analytes. The Raman spectra shown in Fig. 8 are from different regions of the paper coated with aptamers, Zika and Zika/aptamers. A DeltaNu spectrometer with Examiner 785 Raman unit was used in these experiments. The amount of aptamers used in coating these samples were 10 l with 1
M concentrations and the Zika concentration was 1.7x10⁸ / l and the amount used in each application was 1 l. The buffer solution was 1 l of 1x PBS with 1 mM MgCl2. The Raman peak due to Zika was around 1590 cm-1 [34] and [35].
(e)
Figure 8. Raman spectra of buffer/paper, aptamer/paper, Zika/paper and Zika/aptamer/paper. The spectra are normalized with dry paper Raman spectrum. These spectra clearly show the difference between aptamers, Zika and buffer deposited on paper.
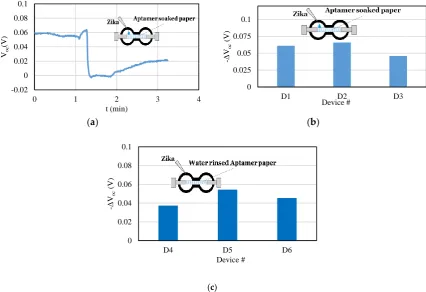
We then used a laser printer to print patterns on paper followed by adding silver paint contacts as shown in Fig. 2(a) and Fig. 9 insets. The purpose of the printed device is to clearly show the location of the Zika solution (or fluids that may contain Zika) on the device. Fig. 9(a) shows the Voc-time response for paper-based devices (D1, D2, and D3). The negative ∆Voc shift in these devices, after
0 20 40 60 80
P
u
ll
-o
ff
F
o
rc
e
(n
N
)
Stiction force on different material
Aptamer Zika
Aptamer/Zika
0
10
20
30
40
50
60
70
200
400
600
800
1000 1200 1400 1600 1800 2000
Rama
n
Si
g
na
l
cm
-1Buffer/paper Aptamer/paper
Zika/paper Zika+aptamer/paper
introducing Zika, are shown in Fig. 9(b). We verified that the aptamer stayed and was resident in the paper even after rinsing the paper with DI water. Fig. 9(c) shows the response of adding Zika on the three different aptamer-coated printed devices (D4, D5, D6). The Voc levels in Fig. 9(c) are similar and consistent with that of aptamer-coated device in Fig. 9(b).
(a) (b)
(c)
Figure 9. a) Voc vs time of the printed sensor with Zika added at t=1.3 min. ΔVoc obtained on adding
Zika to b) aptamer coated printed device D1, D2, D3, and c) aptamer coated and subsequently rinsed devices D4, D5 and D6, showing that the aptamer remain immobilized in the paper after rinsing.
The actual interactions between different components in the paper matrix is quite involved and the sensor response depends on the history of the paper, temperature, air current on the sensor, and other environmental factors, leading to higher Voc variations [15] than in micro-fabricated devices. However, the results shown here are in agreement with the overall trends seen with many averaged measurement results (with a standard deviation of ~ 2 mV) and theory. Also, the paper-based devices were manually cut (~ 1cm x 0.2-0.3 cm) with uncertain dimensions. Variations in device dimensions can be considerably reduced using automated machine cutting. Uniformity of the electrical contacts can also be a concern that can be addressed using 3-D printing. Another very important source of error was in making sure that the paper sensor was not saturated with the analytes introduced at each step. When the paper was saturated, the addition of Zika resulted in a thin layer of liquid above the paper sensor and Zika did not incorporate in the paper resulting in noisy sensor output. The sensor was also very sensitive to spurious environmental electric fields generated by us and other objects nearby that could be addressed by proper grounding.
5. Electronic Readout
We next explored the possibility of detecting the virus from the paper-based sensor in a form of direct electronic readout through an LCD instead of measuring the open circuit voltage using a voltmeter. The LCD can be configured to display a letter such as “Z” once the paper sensor voltage reaches a threshold value generated by the presence of sufficient number of Zika viruses. In order to demonstrate the feasibility of such application, we used an LCD screen from a digital watch and experimentally obtained turn-on voltage for a single display segment to be ~100 mV. From the previous results we observed that addition of Zika resulted in Voc ~ 50 mV. Thus, 6 paper sensors
-0.02 0 0.02 0.04 0.06 0.08 0.1
0 1 2 3 4
Voc
(V)
t (min)
0 0.025 0.05 0.075 0.1
D1 D2 D3
-Δ
Voc
(V
)
Device #
0 0.02 0.04 0.06 0.08 0.1
D4 D5 D6
-Δ
Voc
(V)
were connected in series to generate ~ 300 mV Fig. 10(a) that is sufficient to power may readout devices including the LCD. The only drawbacks are that the series-connected sensors should be fed Zika separately and the external load should not draw more than 0.1 mA current to cause internal sensor resistor to become important. As can be seen in Fig. 10(b), once the Zika was added, the LCD displayed “A”. The LCD can be replaced by electronic-ink display which requires much lower voltages/power eliminating the necessity of using many paper-based devices in series.
(a) (b)
Figure 10. a) Output from the paper sensor measured using multimeter showing voltage level of ~300 mV for 6 paper sensors connected in series. b) Output from the paper sensor connected to the LCD readout optioned from digital watch showing the letter “A” on adding Zika on each side of each of the aptamer-soaked paper devices. The paper strip is connected using clips with 6 devices imprinted on the strip. The grey patches are the silver contact paint regions separating the sensors from each other.
The paper-based sensors we constructed and reported here were very reproducible as long as they were not saturated and as long as they were grounded properly. Their “point” sensitivity of 2.6 nV/Zika and their minimum detectable signal (MDS) of 1.2x10⁶ Zika are quite good given their simple structures and ease of operations. Selectivity of this sensor as well as other aptamer-based sensors are limited by the selectivity of their respective aptamers that can be modified to achieve better selectivity if needed. In the case of paper-based sensors discussed here, the selectivity may also be affected by viruses becoming immobilized in the paper even if they are do not bind with the resident aptamer. These other viruses can be removed by mildly washing them away that will not affect the Zika-aptamer complexes appreciably. The real-world application of Zika paper sensors will involve presence of bodily fluids such as urine or sweat or saliva. These biofluids are very complex and proper filtering on the sensor will be used to remove their components that may affect the paper sensor operation adversely.
As with any sensor development, the research and development efforts have many different stages. It usually starts with developing the transduction mechanism using modified “clean”
samples and progresses toward more realistic samples in real world. The present work describes the transduction phenomena of “sensing pure Zika” virus using a paper-based potentiometric
device that to the best of our knowledge was not done before. The innovation has two parts: a) using paper-based sensors to detect the whole virus and b) using resident aptamers in the paper to
bind with Zika. The sensor’s selectivity comes from its resident aptamer. In the near future we will measure and report our sensors’ selectivity and verify their operations in the presence of bodily
fluid.
6. Conclusion
This work demonstrates for the first time a paper-based sensor for detecting Zika virus using
signal of 1.2x10⁶ Zika. It can be generalized to detect any other viruses, pathogens even bacteria by
simply using appropriate aptamers. The most important and unique aspect of the potentiometric paper based Zika virus is its structural simplicity and ease of use. This study demonstrates the
feasibility of detecting whole Zika viruses and the use of simple electronic readout using paper-based sensors. Although aptamers are known for their high specificity to capture target pathogens and
viruses, more study is required with different viruses to verify and measure its cross-sensitivity.
Acknowledgments: This research was supported by a National Science Foundation Grant under Dr. Leon Esterowitz.
References
[1] A. Määttänen et al., “A low-cost paper-based inkjet-printed platform for electrochemical analyses,” Sensors Actuators, B Chem., vol. 177, pp. 153–162, 2013.
[2] A. C. Siegel, S. T. Phillips, M. D. Dickey, N. Lu, Z. Suo, and G. M. Whitesides, “Foldable
printed circuit boards on paper substrates,” Adv. Funct. Mater., vol. 20, no. 1, pp. 28–35, Jan. 2010.
[3] D. Tobjörk and R. Österbacka, “Paper electronics,” Adv. Mater., vol. 23, no. 17, pp. 1935– 1961, May 2011.
[4] M. Novell, T. Guinovart, P. Blondeau, F. X. Rius, and F. J. Andrade, “A paper-based potentiometric cell for decentralized monitoring of Li levels in whole blood,” Lab Chip, vol.
14, no. 7, pp. 1308–1314, Mar. 2014.
[5] J. Cui, G. Lisak, S. Strzalkowska, and J. Bobacka, “Potentiometric sensing utilizing paper
-based microfluidic sampling,” Analyst, vol. 139, no. 9, pp. 2133–2136, Apr. 2014. [6] J. Szucs and R. E. Gyurcsányi, “Towards Protein Assays on Paper Platforms with
Potentiometric Detection,” Electroanalysis, vol. 24, no. 1, pp. 146–152, Jan. 2012.
[7] J. Hu, A. Stein, and P. Bühlmann, “A Disposable Planar Paper-Based Potentiometric Ion-Sensing Platform,” Angew. Chemie - Int. Ed., vol. 55, no. 26, pp. 7544–7547, Jun. 2016.
[8] P. Sjöberg et al., “Paper-based potentiometric ion sensors constructed on ink-jet printed gold electrodes,” Sensors Actuators, B Chem., vol. 224, pp. 325–332, 2016.
[9] E. W. Nery and L. T. Kubota, “Integrated, paper-based potentiometric electronic tongue for the analysis of beer and wine,” Anal. Chim. Acta, vol. 918, pp. 60–68, Apr. 2016.
[10] J. H. Jin, J. H. Kim, S. K. Lee, S. J. Choi, C. W. Park, and N. K. Min, “A fully integrated paper -microfluidic electrochemical device for simultaneous analysis of physiologic blood ions,”
Sensors (Switzerland), vol. 18, no. 1, 2018.
[11] J. Kofler, S. Nau, and E. J. W. List-Kratochvil, “A paper based, all organic, reference -electrode-free ion sensing platform,” J. Mater. Chem. B, vol. 3, no. 25, pp. 5095–5102, 2015.
[12] J. Ding, N. He, G. Lisak, W. Qin, and J. Bobacka, “Paper-based microfluidic sampling and separation of analytes for potentiometric ion sensing,” Sensors Actuators, B Chem., vol. 243,
pp. 346–352, 2017.
[13] M. Parrilla, R. Cánovas, and F. J. Andrade, “Paper-based enzymatic electrode with enhanced
potentiometric response for monitoring glucose in biological fluids,” Biosens. Bioelectron., vol. 90, pp. 110–116, 2017.
determination of ions,”Sensors Actuators, B Chem., vol. 207, no. PB, pp. 933–939, 2015.
[15] R. Kawahara, P. Sahatiya, S. Badhulika, and S. Uno, “Paper-based potentiometric pH sensor using carbon electrode drawn by pencil,” Jpn. J. Appl. Phys., vol. 57, no. 4, p. 04FM08, Apr.
2018.
[16] J. Ping, Y. Wang, K. Fan, W. Tang, J. Wu, and Y. Ying, “High-performance flexible
potentiometric sensing devices using free-standing graphene paper,” J. Mater. Chem. B, vol. 1, no. 37, pp. 4781–4791, 2013.
[17] A. A. Al-Qahtani, N. Nazir, M. R. Al-Anazi, S. Rubino, and M. N. Al-Ahdal, “Zika virus: a
new pandemic threat,” J Infect Dev Ctries, vol. 10, no. 3, pp. 201–207, 2016.
[18] C. J. Haug, M. P. Kieny, and B. Murgue, “The zika challenge,” New England Journal of
Medicine, vol. 374, no. 19. Massachussetts Medical Society, pp. 1801–1803, 12-May-2016. [19] J. Shin, A. G. Cherstvy, and R. Metzler, “Sensing Viruses by Mechanical Tension of DNA in
Responsive Hydrogels,” APS, vol. 4, no. 2, 2014.
[20] K. Murray, R. Gorchakov, … A. C.-E. infectious, and undefined 2017, “Prolonged detection
of Zika virus in vaginal secretions and whole blood,” ncbi.nlm.nih.gov.
[21] G. Calvet, R. Aguiar, A. Melo, … S. S.-T. L. infectious, and undefined 2016, “Detection and sequencing of Zika virus from amniotic fluid of fetuses with microcephaly in Brazil: a case
study,” Elsevier.
[22] O. Faye, O. Faye, A. Dupressoir, … M. W.-J. of C., and undefined 2008, “One-step RT-PCR
for detection of Zika virus,” Elsevier.
[23] “Detection of Zika virus in urine,” ncbi.nlm.nih.gov.
[24] C. Klungthong et al., “Dengue Virus Detection Using Whole Blood for Reverse Transcriptase PCR and Virus Isolation,” J. Clin. Microbiol., vol. 45, no. 8, pp. 2480–2485, 2007.
[25] “Detection of Zikavirus in saliva,” Elsevier.
[26] K. H. Lee and H. Zeng, “Aptamer-Based ELISA Assay for Highly Specific and Sensitive Detection of Zika NS1 Protein,” Anal. Chem., vol. 89, no. 23, pp. 12743–12748, 2017.
[27] R. D. Jenison, S. C. Gill, A. Pardi, and B. Polisky, “High-resolution molecular discrimination by RNA,” Science (80-. )., vol. 263, no. 5152, pp. 1425–1429, 1994.
[28] E. Bakker, P. Bühlmann, and E. Pretsch, “The phase-boundary potential model,” Talanta, vol. 63, no. 1, pp. 3–20, 2004.
[29] H. H.-C. E. Science and undefined 1970, “The liquid junction potential—the free diffusion junction,” Elsevier.
[30] H. W. Harper, “Calculation of liquid junction potentials,” J. Phys. Chem., vol. 89, no. 9, pp. 1659–1664, 1985.
[31] “Zika Envelope Recombinant Antigen | Zika Virus | ProSpec.” [Online]. Available: https://www.prospecbio.com/zika_envelope_sf9.
[32] S. Dolai and M. Tabib-Azar, “433 MHz Lithium Niobate microbalance aptamer-coated
whole Zika virus sensor with 370 Hz/ng sensitivity,” IEEE Sens. J., pp. 1–1, Dec. 2019. [33] “Base Pair Biotechnologies - Aptamer Discovery Company.” [Online]. Available:
https://www.basepairbio.com/. [Accessed: 04-Sep-2019].
[34] M. Sanchez-Purra, M. Carre-Camps, H. de Puig, I. Bosch, L. Gehrke, and K. Hamad-Schifferli,
“Surface-Enhanced Rama Spectroscopy-Based Sandwich Immunoassays for Multiplexed Detection of Zika and Dengue Viral Biomarkers.” ACS Infectious Diseases, 2017, 3, 767-776. DOI: