RECOGNITION OF PHASE TRANSITION IN
FERM ENTATION USING ON-LINE
MONITORED VARIABLES.
A thesis submitted to the University of London for the degree of
DOCTOR OF PHILOSOPHY
by
Mitra DEHGHANI BEng.(Hons), MPhil
February 1996
Department of Chemical and Biochemical Engineering University College London
ProQuest Number: 10042840
All rights reserved
INFORMATION TO ALL USERS
The quality of this reproduction is dependent upon the quality of the copy submitted.
In the unlikely event that the author did not send a complete manuscript and there are missing pages, these will be noted. Also, if material had to be removed,
a note will indicate the deletion.
uest.
ProQuest 10042840
Published by ProQuest LLC(2016). Copyright of the Dissertation is held by the Author.
All rights reserved.
This work is protected against unauthorized copying under Title 17, United States Code. Microform Edition © ProQuest LLC.
ProQuest LLC
789 East Eisenhower Parkway P.O. Box 1346
ABSTRACT
The aim of this research was to develop a technique by which aerobic batch stirred tank fermenters, containing the yeast S, cerevisiae (strain GB4918, Bakers yeast) cultured in a chemically defined and/or undefined medium with glucose as the initial limiting substrate at 30 g/L, pH 4.5 and temperature 28°C, as well as in repeated fill and draw batch bioreactors, can be controlled and operated by the use of a single on-line parameter that identifies and represents the complex biochemistry of the aerobic yeast and enables the batch cycle to be initiated and terminated, as well as the harvesting of intracellular enzymes of the yeast at optimum yield or concentration.
An extensive literature survey has been carried out into the aerobic culture of the yeast S.cerevisiae that identified key transition phases in the metabolism in relation to the operation of cellular metabolic pathways, (limited respiratory capacity, dioxic growth on ethanol).
Distinct changes in some of the on-line monitored variables of dissolved oxygen tension (DOT) and CO2 exit gas concentration have been used to recognise the specific identifiable phases of glucose depletion, biomass formation and production of some intracellular enzymes, which in this project were alcohol dehydrogenase (ADR), glucose-6-phosphate dehydrogenase (G6PDH), mal ate dehydrogenase (MDH), and hexokinase. Direct information about the metabolic activity of the cells and product concentration inside the batch bioreactor were obtained from the off-line samples taken from the culture broth. These on-line and off-line variables were correlated to enable process decision making to be based on calculated parameters rather than using a predetermined schedule.
An extensive data base has been set up from the experimentation in terms of the functioning of the yeast cells that gives the change in the external culture environment and the intracellular enzymes associated with glucose metabolism in an aerobic environment. These date place some considerable doubt on the published theories of the cell metabolic functioning.
ACKNOW LEDGEM ENTS
I would like to express my sincere gratitude to my supervisors Mrs Nina Thornhill and Dr Andrew Ison for their advice, encouragement and support. I would also like to express my appreciation to Dr Malcolm Gregory, Dr Mark Bulmer and Dr Claire Turner for their help and their comments throughout the project.
Many sincere thanks to the technical staff of the Chemical and Biochemical Engineering department at University College London.
The support of the EPSRC and BBSRC through the Interdisciplinary Research Centre for Process Systems Engineering, Imperial College of Science, Technology and Medicine, and through Advanced Centre for Biochemical Engineering, University College London is gratefully acknowledged.
TABLE OF CONTENTS
Abstract 2
A cknow ledgm ents 3
List of Figures 8
List of Tables 18
Nomenclature and abbreviations 19
Thesis Outline 21
Chapter 1 Introduction 2 2
1.1 Introduction to the project 22
1.1.1 Choice of the micro-organism. 23
1.1.2 Project aims and objective 24
1.2 Yeast physiology 25
1.2.1 Microbial yeast metabolism. 25
1.2.2 Glucose metabolism in 5'. 27
1.2.3 Regulation of glucose metabolism in 5. 32 1.3 Aerobic growth of S. cerevisiae in batch culture 37
1.3.1 Repeated batch fermentations 39
1.3.4 Fermentation products 42
1.3.5 Inhibition of fermentation products 44
1.4 Fermentation environmental variables 46
1.4.1 Physical and chemical variables 46
1.4.2 Measurement of fermentation variables 49 1.4.3 Accuracy and reliability of measurement variables 51
1.5 Fermentation measurements for control 53
1.5.1 Direct fermentation variables 54
1.5.1.1 Data bases and neural network 54
1.5.2 Derived fermentation variables 55
1.5.2.1 Fermentation phase profiling 56
1.6 Summary 58
Chapter 2 Materials and Methods 5 9
2.1 Fermentation 59
2.1.1 Strain Selection and maintenance 59 2.1.1.1 Microscopic examination of yeast 61
2.1.2 Media and reagents 62
2.1.2.2 Defined medium 63
2.1.2.3 MYGP undefined medium 65
2.1.3 Inoculum preparation 65
2.1.4 Fermenter preparation 66
2.1.5 Aseptic refilling of the fermenter 69 2.1.5.1 Aseptic emptying of the fermenter 69 2.1.5.2 Aseptic refilling and self inoculation of 70 the fermenter
2.1.6 Off-line sampling 70
2.2 Instrumentation 71
2.2.1 Fermenter equipment and instmmentation 71
2.2.2 Exit gas analysis 73
2.2.3 Data acquisition and processing 74
2.2.4 Micon Lab 40 homogeniser 74
2.2.5 High performance liquid chromatography (HPLC) 75
2.3 Off line analytical techniques 76
2.3.1 Biomass measurements 76
2.3.1.1 Dry cell weight measurements 76 2.3.1.2 Optical density measurements 77 2.3.2 Glucose and ethanol measurements 77
2.3.3 Total protein 77
2.3.3 Intracellular enzyme assays 78
2.4 Summary 83
Chapter 3 Fermentation data analysis- Results and discussion 8 4
3.1 Single batch cultures of S. ce rev 86
3.1.1 CO2 exit gas analysis 87
3.1.2 Correlation of intracellular enzyme activities with 88 CO2 exit gas profiles in single batch fermentations
3.1.3 Biomass formation and intracellular enzyme products 99 3.1.4 Reproducibility of the off-line analysis profiles in batch 105
fermentations with defined medium
3.2 Repeated batch cultures 120
3.2.1 Preliminary repeated batch experiments with 122 defined medium
fermentations "A comparison"
3.3.2 CO2 and DOT profiles 158
3.4 Summary 166
Chapter 4 Measurement Variability Analysis 167
4.1 Statistical methods 169
4.2 Production of broth samples for protein and enzyme assays 170
4.3 Off-line sample variability analysis 171
4.3.1 Variability in biomass measurement 171 4.3.2 Variability in soluble protein and ADH 172
activity measurements
4.3.3 Variability in replicate protein measurements 172 4.3.4 Variability in replicate ADH measurements 174 4.3.5 Variability in MDH, hexokinase, and G6PDH 177
replicate measurements
4.3.6 Variability in glucose, ethanol, and pyruvate replicate 177 measurements
4.4 Summary 180
Chapter 5 Process Decision Making 181
5.1 Intracellular enzyme production schedules 181
5.2 Process automation 184
5.3 CO2 peak detection 185
5.3.1 Linearisation of CO2 exit gas profile 186
5.3.2 Derivative of the CO2 profile 187
5.3.3 On-line recognition of the CO2 signal 191
5.4 Summary 193
Conclusions and Recommendations 194
6.1 Conclusions 195
6.2 Recommendations 201
A ppendices 2 0 3
Appendix 2 Experimental results from Single batches of S. cerevisiae 208 fermentation with defined medium 'SBD'
Appendix 2.1 Fermentation results from SBDl 209 Appendix 2.2 Fermentation results from SBD2 211 Appendix 2.3 Fermentation results from SBD3 213
Appendix 3 Experimental results from a repeated batch culture of 215 S. cerevisiae fermentation with defined medium RBDl'
Appendix 3.1 Fermentation results from RBD1-1 216 Appendix 3.2 Fermentation results from RBD 1-2 218
Appendix 4 Experimental results from a repeated batch culture of 220 S. cerevisiae fermentation with defined medium RBD2'
Appendix 4.1 Fermentation results from RBD2-1 221 Appendix 4.2 Fermentation results from RBD2-2 223 Appendix 4.3 Fermentation results from RBD2-3 225
Appendix 5 Experimental results from a repeated batch culture of 227 S. cerevisiae fermentation with defined medium (RBD3)
Appendix 5.1 Fermentation results from RBD3-2. 228 Appendix 5.2 Fermentation results from RBD3-3. 230 Appendix 5.3 Fermentation results from RBD3-4. 232
Appendix 6 Experimental results from a repeated batch culture of 234 S. cerevisiae fermentation with complex medium.(RBC2-2).
Appendix 7 Lab View programming code 237
Appendix 7.1 LabView programming code to get CO2 data 237 Appendix 7.2 LabView programming code to detect the first 238
and the last CO2 peak
LIST OF FIGURES
Chapter 1 Introduction
Figure 1.1 Aerobic metabolism of yeast adapted from Ratledge, (1991).
Figure 1.2 The breakdown of glucose to pyruvate with the simultaneous formation of ATP is referred to as Glycolytic (BMP) pathway, adapted from Stryer (1988).
Figure 1.3 Pathway of yeast intermediat metabolism. Pyruvate oxidises by the tri carboxylic cycle (TCA) to carbon dioxide and water.
Figure 1.4 Schematic representation of glucose metabolism in S. cerevisiae (adapted from Sonnleitner, 1991).
Figure 1.5 Limited respiratory capacity of S. cerevisiae illustrated as a bottleneck (Kappeli, 1986).
Figure 1.6 Regulation of glucose metabolism in S.cerevisiae based on limited respiratory capacity. Adapted from Kappeli, (1986)
Figure 1.7-a Aerobic growth of S.cerevisiae with glucose limiting substrate at an initial concentration of 20 g/L.Adapted from Fiechter et a l, (1987)
Figure 1.7-b Oxygen uptake rate (mmolg'^h"^), carbon dioxide production rate (mmolg"^h"l), and respiratory quotient of an aerobic batch growth of S.cerevisiae. Adapted from Fiechter et a l, (1987).
Figure 1.8 A graphical representation of 8 repetitive batch experiments of CO2 exhaust gas analysis.(Adapted from Locher et a l, 1991, 1993). Figure 1.9 Typical bioprocess interactions (Montague et a l, 1989).
Chapter 2 Materials and Methods
Figure 2.1 Illustrates the acquisition of on-line and off-line data during the fermentations. (A process overview).
Figure 2.2 Diagram of the LH 7L fermenter used for all fermentations in this work.
Chapter 3 Fermentation data analysis- Results and discussion
Figure 3 .1 . CO2 exit gas profile of single batch 'SBD2' from inoculation time to the end of growth on ethanol.
Figure 3.2-b Off-line data of glucose (g/L), ethanol (g/L), and pyruvate (g/L) profile in single batch SBD4 with defined medium.
Figure 3.2-c Dry cell weight concentration (g/L) and total protein content (mg/mL) analysis of single batch fermentation SBD4.
Figure3.2-d Dry cell weight concentration (g/L) and total protein content (g/mg biomass) analysis of single batch fermentation SBD4 .
Figure 3.2-e Off-line assay of Alcohol dehydrogenase (U/mL) and Malate dehydrogenase (U/mL) in single batch fermentation.
Figure 3.2-f Glucose-6-phosphate dehydrogenase activity levels (U/mL) and Hexokinase activity levels (U/mL) in single batch fermentation SBD4. Figure 3.2-g Off-line assay of Alcohol dehydrogenase (U/mL) and Malate
dehydrogenase (U/mL) in single batch fermentation.
Figure 3.2-h Glucose-6-phosphate dehydrogenase activity levels (U/gDCW) and Hexokinase activity levels (U/gDCW) in SBD4.
Figure 3.2-i Off-line assay of Alcohol dehydrogenase (U/mg protein) and Malate dehydrogenase (U/mg protein) in single batch fermentation.
Figure 3.2-j Glucose-6-phosphate dehydrogenase activity levels (U/mg protein) and Hexokinase activity levels (U/mg protein) in SBD4.
Figure 3.3-a The log-log plot of ADH product formation in relation to biomass concentration from fermentation SBD4.
Figure 3.3-b The log-log plot of hexokinase product and biomass formation in SBD4.
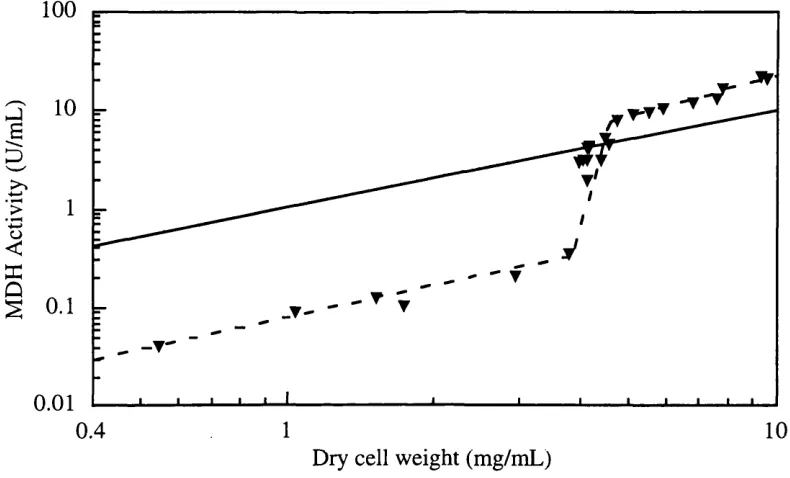
Figure 3.3-c The log-log plot of MHD production and biomass formation during fermentation SBD4.
Figure 3.3-d The log-log plot of G6PDH product formation in relation to biomass concentration in SBD4 fermentation.
Figure 3.4-a Off-line data of glucose consumption (g/L) profile from single batches with defined medium for SBDl, SBD2, SBD3 , SBD4 , and RBD2-1 batches. Figure3.4-b Ethanol production profile (g/L) from single batches with defined medium
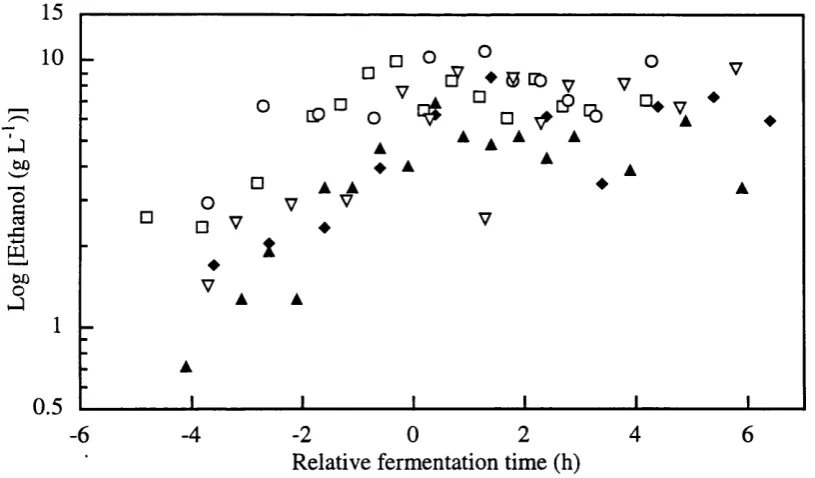
for SBDl, SBD2, SBD3 , SBD4 , and RBD2-1 batches.
Figure 3.4-c Dry cell weight concentration (g/L) profiles from single batches with defined mediumfor SBDl, SBD2, SBD3 , SBD4 , and RBD2-1 batches. Figure 3.4-d Optical density measurements of biomass concentration. Profiles in
single batches with defined medium for SBDl, SBD2, SBD3 , SBD4 , and RBD2-1 batches.
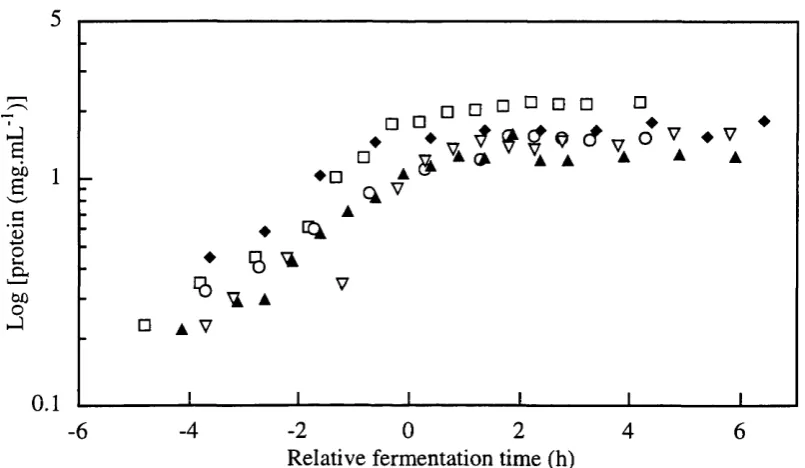
Figure 3.4-f Total protein concentration profiles in single batches with defined medium for SBDl, SBD2, SBD3 , SBD4 , and RBD2-1 batches.
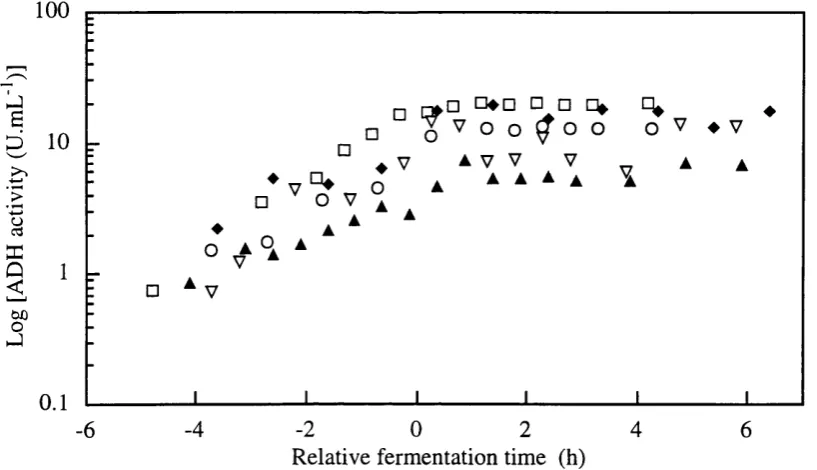
Figure 3.4-g ADH enzyme activity (U/mL) profiles from single batches with defined mediumfor SBDl, SBD2, SBD3 , SBD4 , and RBD2-1 batches.
Figure 3.4-h ADH enzyme activity (U/g DCW) profiles from single batches with defined medium for SBDl, SBD2, SBD3 , SBD4 , and RBD2-1 batches.
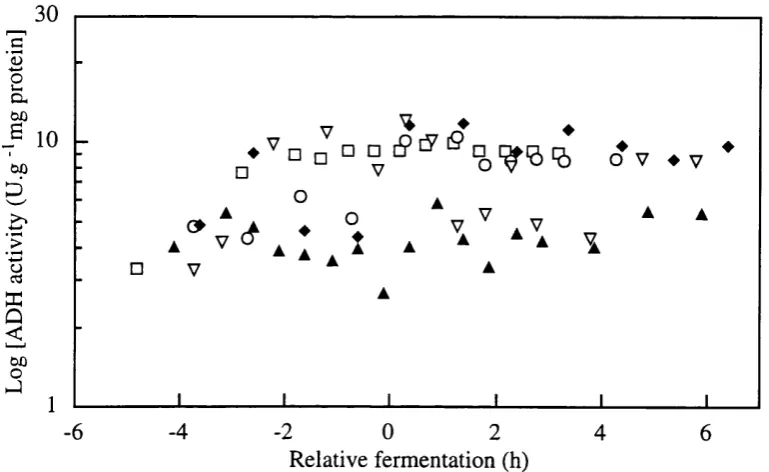
Figure 3.4-i ADH enzyme activity (U/mg protein) profiles from single batches with defined medium for SBDl, SBD2, SBD3 , SBD4 , and RBD2-1 batches. Figure 3.4-j G6PDH enzyme activity (U/mL) profiles from single batches with defined
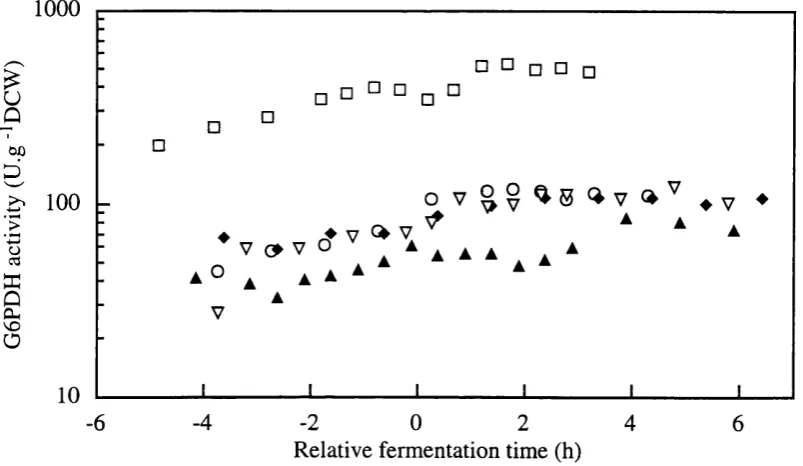
medium for SBDl, SBD2, SBD3 , SBD4 , and RBD2-1 batches. Figure 3.4-k G6PDH enzyme activity (U/g DCW) profiles from single batches with
defined medium for SBDl, SBD2, SBD3 , SBD4 , and RBD2-1 batches. Figure 3.4-1 G6PDH enzyme activity (U/mg protein) profiles from single batches with
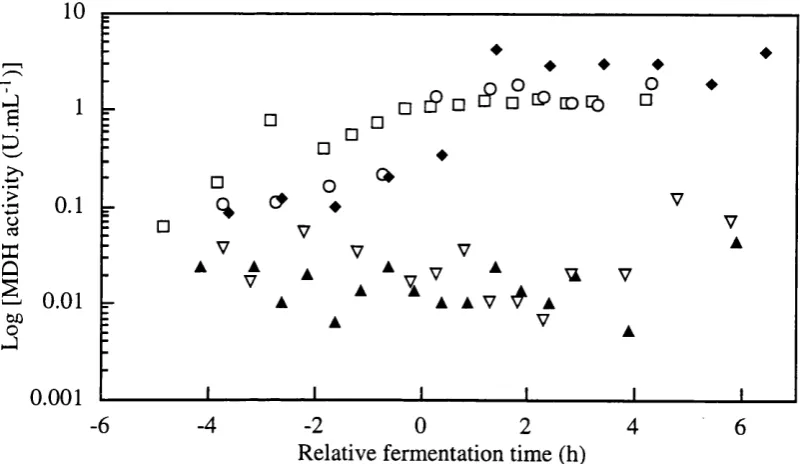
defined medium for SBDl, SBD2, SBD3 , SBD4 , and RBD2-1 batches. Figure 3.4-m MDH enzyme activity (U/mL) profiles from single batches with defined
medium for SBDl, SBD2, SBD3 , SBD4 , and RBD2-1 batches. Figure 3.4-n MDH enzyme activity (U/g DCW) profiles from single batches with
defined medium for SBDl, SBD2, SBD3 , SBD4 , and RBD2-1 batches.
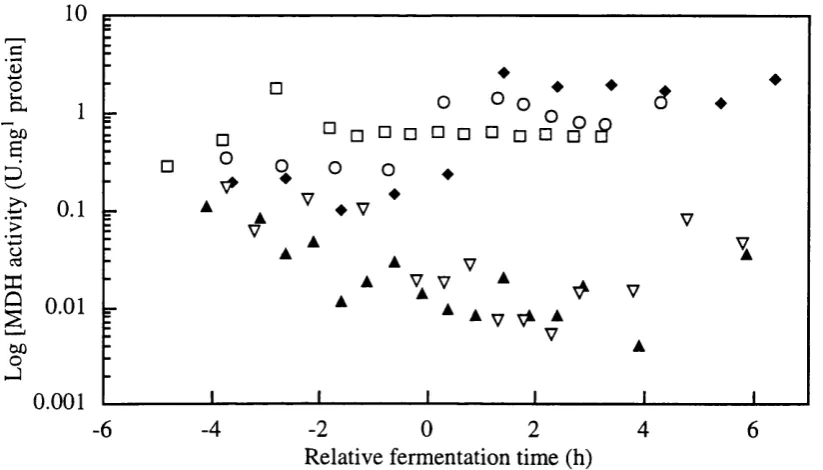
Figure 3.4-0 MDH enzyme activity (U/mg protein) profiles from single batches with defined medium for SBDl, SBD2, SBD3 , SBD4 , and RBD2-1 batches.
Figure 3.4-p Hexokinase enzyme activity (U/mL) profiles from single batches with defined medium for SBD3, SBD4, and RBD2-1 batches.
Figure 3.4-q Hexokinase enzyme activity (U/g DCW) profiles from single batches with defined medium for SBD3, SBD4, and RBD2-1 batches.
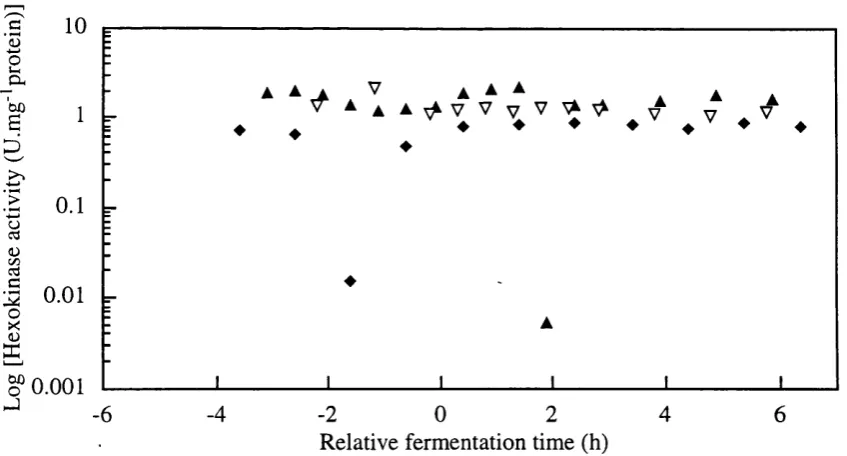
Figure 3.4-r Hexokinase enzyme activity (U/mg protein) profiles from single batches with defined medium for SBD3, SBD4, and RBD2-1 batches.
Figure 3.5-a A graphical presentation of CO2 exit gas profile in repeated batch culture (PRBl) on defined medium.
Figure 3.5-b DOT profile of the same experiment (PRBl) is presented.
Figure 3.6 DOT profile of repeated batch culture on defined medium RBD2.
Figure 3.6-a Off-line data of glucose consumption (g/L) profile from RBD2. Figure 3.6-b Ethanol production profile (g/L) profile from RBD2.
Figure 3.6-f Total protein concentration (mg /mg DCW) profile from RBD2. Figure 3.6-g ADH enzyme activity (U/mL) profile from RBD2.
Figure 3.6-h ADH enzyme activity (U/gDCW) profile from RBD2. Figure 3.6-i ADH enzyme activity (U/mg protein) profile from RBD2. Figure 3.6-j G6PDH enzyme activity (U/mL) profile from RBD2. Figure 3.6-k G6PDH enzyme activity (U/mg DCW) profile from RBD2. Figure 3.6-1 G6PDH enzyme activity (U/mg protein) profile from RBD2. Figure 3.6-m MDH enzyme activity (U/mL) profile from RBD2.
Figure 3.6-n MDH enzyme activity (U/g DCW) profile from RBD2. Figure 3.6-0 MDH enzyme activity (U/mg protein) profile from RBD2. Figure 3.6-p Hexokinase enzyme activity (U/mL) profile from RBD2. Figure 3.6-q Hexokinase enzyme activity (U/g DCW) profile from RBD2. Figure 3.6-r Hexokinase enzyme activity (U/mg protein) profile from RBD2. Figure 3.6-s Pyruvate (g/L) profile from RBD2.
Figure 3.7-a A graphical presentation of normalised CO2 exit gas profile in repeated batch culture RBD3.
Figure 3.7-b A graphical presentation of DOT exit gas profile in repeated batch culture RBD3.
Figure 3.8-a Off-line data of glucose consumption (g/L) profile from RBD3. Figure 3.8-b Ethanol production profile (g/L), profile from RBD3.
Figure 3.8-c Dry cell weight concentration (g/L) profile from RBD3. Figure 3.8-d Biomass optical density measurements, profile from RBD3. Figure 3.8-e Total protein concentration (U/mL) profile from RBD3. Figure 3.8-f Total protein concentration (U/mg DCW) profile from RBD3. Figure 3.8-g ADH enzyme activity (U/mL) profile from RBD3.
Figure 3.8-h ADH enzyme activity (U/gDCW) profile from RBD3. Figure 3.8-i ADH enzyme activity (U/mg protein) profile from RBD3. Figure 3.8-j G6PDH enzyme activity (U/mL) profile from RBD3. Figure 3.8-k G6PDH enzyme activity (U/g DCW) profile from RBD3. Figure 3.8-1 G6PDH enzyme activity (U/mg protein) profile from RBD3. Figure 3.8-m MDH enzyme activity (U/mL) profile from RBD3.
Figure 3.9-a CO2 exit gas profile, and DOT profile of 'RBCl-2'.
Figure 3.9-b Off-line data of glucose, ethanol, and pyruvate (g/L) in RBCl-2. Figure 3.9-c Dry cell weight concentration (mg/mL) and total soluble protein
content (mg/mL) analysis of RBCl-2.
Figure 3.9-d Dry cell weight concentration (g/L) and total soluble protein content (g/gDCW) analysis of RBCl-2.
Figure 3.9-e Off-line assay of Alcohol dehydrogenase (U/mL) and Malate dehydrogenase (U/mL) in RBCl-2.
Figure 3.9-f Glucose-6-phosphate dehydrogenase activity levels (U/mL) and hexokinase enzyme activity level (U/mL) in RBCl-2.
Figure 3.9-g Off-line assay of Alcohol dehydrogenase (U/gDCW) and Malate dehydrogenase (U/gDCW) RBCl-2.
Figure 3.9-h Glucose-6-phosphate dehydrogenase activity levels (U/gDCW) and hexokinase enzyme activity level (U/gDCW) in RBCl-2.
Figure 3.9-i Off-line assay of Alcohol dehydrogenase (U/mg protein) and Malate dehydrogenase (U/mg protein) in RBCl-2.
Figure 3.9-j Glucose-6-phosphate dehydrogenase activity levels (U/mg protein) and hexokinase enzyme activity level (U/mg protein) in r RBCl-2.
Figure 3.10-a CO2 exit gas profile in repeated batch culture (RBC2) with complex medium.
Figure 3.10-b DOT exit gas profile in repeated batch culture (RBC2) with complex medium.
Chapter 4 Measurement Variability Analysis
Figure 4.1 Statistics of the biomass optical density measurements (660 nm). Figure 4.2-a Statistics of soluble protein assay.
Figure 4.2-b The log-log plot of statistics of soluble protein assay.
Figure 4.3-a Replicate measurements of ADH activity from a single broth sample. Figure 4.3-b Statistics of ADH assay.
Figure 4.4 Statistics of additional intracellular enzyme assays. Figure 4.5 Statistics of HPLC analysis.
Chapter 5 Process Decision Making
Figure 5.2 Piecewise linearisation of CO2 exit gas data from fermentation SBD2, using the software developed by Mairshall (1992).
Figure 5.3 CO2 exit gas profile from SBD2 fermentation with defined medium using Matlab programming environment.
Figure 5.4 CO2 exit gas profile from RBC2-1 fermentation with complex medium using Matlab programming environment..
Figure 5.5 CO2 exit gas profile from SBD2 fermentation with defined medium using Lab VIEW programming environment.
Chapter 6 Conclusions and recommendations
Figure 6.1 C02 exit gas analysis profile and RQ plot for SBD2.
Appendix 1
Figure A l. 1 Calibration curve of absorbance verses yeast cell concentration.
Figure A 1.2 Calibration curve of absorbance verses yeast cell concentration. All samples are diluted using DW.
Figure A 1.3 Calibration curve of absorbance verses yeast cell concentration.
Appendix 2
Figure A2.1-a CO2 exit gas profile and DOT profile of single batch culture SBDl' on define medium.
Figure A2.1-b Off-line data of glucose, ethanol, and pymvate profiles in single batch SBDl
Figure A2.1-C Dry cell weight concentration and total protein content analysis of single batch fermentation SBDl in define medium.
Figure A2.1-f Off-line assay of Alcohol dehydrogenase (U/ml) and Malate dehydrogenase (U/ml) in single batch fermentation.
Figure A2.1-g Glucose-6-phosphate dehydrogenase activity levels (U/mL) in single batch fermentation SBDl.
Figure A2.2-a CO2 exit gas profile and DOT profile of single batch culture SBD2' on define medium.
Figure A2.2-b Off-line data of glucose, ethanol, and pyruvate profiles in single batch SBD2 with define medium.
Figure A2.2-d
Figure A2.2-e
Off-line assay of Alcohol dehydrogenase (U/mL) and Malate dehydrogenase (U/mL) in single batch fermentation.
Glucose-6-phosphate dehydrogenase activity levels (U/mL) in single batch fermentation SBD2
Figure A2.3-a
Figure A2.3-b
Figure A2.3-C
Figure A2.3-d
Figure A2.3-e
CO2 exit gas profile and DOT profile of single batch culture 'SBD3' on define medium.
Off-line data of glucose, ethanol, and pyruvate profiles in single batch SBD3 with define medium.
Dry cell weight concentration and total protein content analysis of single batch fermentation SBD3 in define medium.
Off-line assay of Alcohol dehydrogenase and MDH activity levels (U/mL) in single batch fermentation.
Glucose-6-phosphate dehydrogenase activity levels (U/mL) and hexokinase enzyme activity level (U/mL) in single batch fermentation SBD3
Appendix 3 Figure A3.1-a
Figure A3.1-b
Figure A3.1-C
Figure A3.1-d
Figure A3.1-e
Figure A3.2-a
Figure A3.2-b
Figure A3.2-C
CO2 exit gas profile and DOT profile of repeated batch culture 'RBDl-T on defined medium.
Off-line data of glucose, and ethanol profile in repeated batch RBDl-1 with definedmedium.
Dry cell weight concentration and total soluble protein content analysis of repeated batch fermentation RBD 1-1 in defined medium.
Off-line assay of Alcohol dehydrogenase (U/mL) and Malate dehydrogenase (U/mL) in repeated batch fermentation
RBDl-1.
Glucose-6-phosphate dehydrogenase activity levels (U/mL) in repeated batch fermentation RBD 1-1.
CO2 exit gas profile of repeated batch culture RBD 1-2' on defined medium.
Off-line data of glucose, and ethanol profile in repeated batch RBD 1-2 with defined medium.
Figure A3.2-d
Figure A3.2-e
Off-line assay of Alcohol dehydrogenase (U/niL) and Malate dehydrogenase (U/mL) in repeated batch fermentation RBDl- 2.
Glucose-6-phosphate dehydrogenase activity levels (U/mL) in repeated batch fermentation RBD 1-2.
Appendix 4 Figure A4.1-a
Figure A4.1-b
Figure A4.1-C
Figure A4.1-d
Figure A4.1-e
DOT profile of repeated batch culture 'RBD2-1' on defined medium.
Off-line data of glucose, ethanol, and pyruvate profiles in repeated batch RBD2-1 with definedmedium.
Dry cell weight concentration and total soluble protein content analysis of repeated batch fermentation RBD2-1 in defined medium.
Off-line assay of Alcohol dehydrogenase (U/mL) and Malate dehydrogenase (U/mL) in repeated batch fermentation. Glucose-6-phosphate dehydrogenase activity levels (U/mL) and Hexokinase activity levels (U/mL) in repeated batch fermentation RBD2-1.
Figure A4.2-a
Figure A4.2-b
Figure A4.2-C
Figure A4.2-d
Figure A4.2-e
DOT profile of repeated batch culture 'RBD2-2' on defined medium.
Off-line data of glucose, ethanol and pyruvate profiles in repeated batch RBD2-2 with defined medium.
Dry cell weight concentration and total soluble protein content analysis of repeated batch fermentation RBD2-2 in defined medium.
Off-line assay of Alcohol dehydrogenase (U/mL) and Malate dehydrogenase (U/mL) in repeated batch fermentation. Glucose-6-phosphate dehydrogenase activity levels (U/mL) and Hexokinase activity levels (U/mL) in repeated batch fermentation RBD2-2.
Figure A4.3-a
Figure A4.3-b
DOT profile of repeated batch culture RBD2-3' on defined medium.
Figure A4.3-C Dry cell weight concentration and total soluble protein content analysis of repeated batch fermentation RBD2-3 in defined medium.
Figure A4.3-d Off-line assay of Alcohol dehydrogenase (U/mL) and Malate dehydrogenase (U/mL) in repeated batch fermentation. Figure A4.3-e Glucose-6-phosphate dehydrogenase activity levels (U/mL)
and Hexokinase activity levels (U/mL) in repeated batch fermentation RBD2-3.
A ppendix 5
Figure A5.1 -a CO2 exit gas profile and DOT profile of repeated batch culture 'RBD3-2' on defined medium.
Figure A5.1 -b Off-line data of glucose, ethanol, and pyruvate profiles in repeated batch RBD3-2 with defined medium.
Figure A5.1-c Dry cell weight concentration and total soluble protein content analysis of repeated batch fermentation RBD3-2 in defined medium.
Figure A5.1-d Off-line assay of Alcohol dehydrogenase (U/mL) and Malate dehydrogenase (U/mL) in repeated batch fermentation. Figure A5.1-e Glucose-6-phosphate dehydrogenase activity levels (U/mL)
and Hexokinase activity levels (U/mL) in repeated batch fermentation RBD3-2.
Figure A5.2-a CO2 exit gas profile and DOT profile of repeated batch culture 'RBD3-3' on defined medium.
Figure A5.2-b Off-line data of glucose, ethanol, and pyruvate profiles in repeated batch RBD3-3 with defined medium.
Figure A5.2-C Dry cell weight concentration and total soluble protein content analysis of repeated batch fermentation RBD3-3 in defined medium.
Figure A5.2-d Off-line assay of Alcohol dehydrogenase (U/mL) and Malate dehydrogenase (U/mL) in repeated batch fermentation. Figure A5.2-e Glucose-6-phosphate dehydrogenase activity levels (U/mL)
and Hexokinase activity levels (U/mL) in repeated batch fermentation RBD3-3.
Figure A5.3-a CO2 exit gas profile and DOT profile of repeated batch culture 'RBD3-4' on defined medium.
Figure A5.3-C
Figure A5.3-d
Figure A5.3-e
Dry cell weight concentration and total protein content analysis of repeated batch fermentation RBD3-4 in defined medium. Off-line assay of Alcohol dehydrogenase (U/mL) and Malate dehydrogenase (U/mL) in repeated batch fermentation RBD3-4.
Glucose-6-phosphate dehydrogenase activity levels (U/mL) and Hexokinase activity levels (U/mL) in repeated batch fermentation RBD3-4.
Appendix 6 Figure A6.1-a
Figure A6.1-b
Figure A6.1-C
Figure A6.1-d
Figure A6.1-e
CO2 exit gas profile and DOT profile of repeated batch culture 'RBC2-2' on complex medium.
Off-line data of glucose, and pyruvate profiles in repeated batch RBC2-2 with complex dmedium.
Dry cell weight concentration and total soluble protein content analysis of repeated batch fermentation RBC2-2 in complex medium.
Off-line assay of Alcoho dehydrogenase (U/mL) and Malate dehydrogenase (U/mL) in repeated batch fermentation
RBC2-2.
Glucose-6-phosphate dehydrogenase activity levels (U/mL) and hexokinase enzyme activity level (U/mL) in single batch fermentation RBC2-2.
Appendix 7 Figure A7.1 Figure A7.2
Lab VIEW visual program code to get CO2 data.
LIST OF TABLES
Table 1.1 Changes in the activity of enzymes during growth of yeast (Adapted from Polakis and Bartley, 1965).
Table 1.2 Effect of ethanol on specific enzyme activities of yeast S.cerevisiae in cell extract and whole cells (Adapted from Pascual et a l, 1988).
Table 1.4 Performance of measurement and control instrumentation in a 1 m^ pilot plant bioractor (Flynn, 1982).
Table 1.5 Integration of computer capabilities (Adapted from Omstead, 1991) Table 2.1 The solid media used for storage of Saccharomyces cerevisiae. Table 2.2 The total concentration of defined medium used for cultivation of
Saccharomyces cergv;jmg.(Fiechter etal., 1981).
Table 2.3 The defined media used for cultivation of S.cerevisiae (Fiechter et a l, 1981).
Table 2.4 The composition of the MYGP culture medium.
Table 2.5 Set points of the controlled variables for all fermentations. Table 2.6 Measured and monitored variables during the time course of the
fermentation processes.
Table 3.1 Fermentation experiments using defined medium.
Table 3.2 A matrix of fermentation experiments using defined medium. Emboldened experiments are included in SBD comparison figures. Table 3.3 A matrix of fermentation experiments using defined medium.
Emboldened experiments are included in RBD section.
Table 3.4 Estimated fermentation time at which the first CO2 peak had occurred for RBD2-1,3 from on-line monitored DOT data.
Table 4.1 Standard deviation of some assays for S.cerevisiae. Table A l.l The composition of the solution made (g/L).
Table A 1.2 Replicate measurements of optical density and dry cell weight concentration for several measurement sets.
Table A l .3 At concentrations 0.3 g/L and 0.8 g/L, 5 more replicate of the
NOM ENCLATURE and ABBREVIATIONS
ADH alcohol dehydrogenase ATP adenosine tri-phosphate ADP adenosine di-phosphate CER carbon dioxide evolution rate
c the molar concentration of all particles within the sample (C0 2)c calculated center point of the CO2 interval
(C0 2)ci ith value of the calculated center point of the CO2 interval (C0 2)i ith value of the CO2 data in the interval
d thickness of the substance D dilution factor
DO dissolved oxygen
DOT dissolved oxygen tension (%saturation) DCW dry cell weight
EDTA ethylene diamine tetra acetic acid EMP Emdben-Mey eij of-Pamas
G6PDH glucose-6- phosphate dehydrogenase HPLC high performance liquid chromatography lo intensity of light passed through a substance I the intensity of transmitted light
IMS industrial methylated spirits Ka the calibration constant
MAX maximum
MDH malate dehydrogenase
n number of replicate measurements N number of sequential data
NAD(P)H reduced form of nicotinamide adenine dinucleotide (phosphate) NAD(P) nicotinamide adenine dinucleotide (phosphate)
OD optical density OUR oxygen uptake rate PHB poly- p-hy droxy butyrate
PID proportional, differential, integral (control) PRB preliminary repeated batch culture
RI refractive index rpm revolution per minute
RQ respiatory quotient S 2 sample variance
s standard deviation of the replicates
SBD single batch fermentation on defined medium
(Oci ith value of the calculated center point of the time interval
TCA trichloroacetate acid TCS Turnbull control system
Tcmax time at which maximum CO2 occurs Tferm actual fermentation time
Trel relative fermentation time to the first CO2 peak tris tris(hydroxymethyl)aminomethane
UV ultra violet
Vt total volume of the assay mixture
V s sample size in the cuvette
VI virtual instruments
X an estimate of the population mean
X the sample mean
Xi the replicate measurements at a particular concentration
population variance
AA rate of change of absorbence
AT time interval
THESIS OUTLINE
Chapter 1 includes the introduction to the thesis and a literature review carried out into yeast physiology, aerobic growth of S.cerevisiae in batch culture, effect of environmental variables on fermentations and fermentation measurements for control. The brief literature survey is given to provide the basis for understanding the complexity of bioprocesses and the limitations in measurements for control of these processes.
The experimental methodology and instrumentation used in this project are reported in chapter 2.
Fermentation data analysis and basic results are discussed in chapter (3) and the associated appendices where on-line and off-line data correlations from defined medium fermentations are investigated, reproducibility of the correlations are tested and profiles of the same variables from complex medium fermentations are presented as a comparison.
Chapter (4) indicates the variability analysis of the off-line sample measurements carried out for this project. Summary statistics of replicate sets of measurements from fermentation broth samples are indicated.
The mathematical technique for on-line phase transition recognition is described in chapter (5). Signals from the CO2 exit gas profiles are identified to base the process decision making on the first and the last peak of the CO2 profile.
1
INTRODUCTION
This chapter includes an introduction to the project (section 1.1) and a literature review (sections 1.2-1.5) into yeast physiology, aerobic batch fermentation of S.cerevisiae, fermentation environmental variables, and the application of fermentation variables to the control of these processes, to provide the basis for understanding the application of on-line monitored variables for process decision making.
1.1
Introduction to the project
Complexity of bioprocesses and the multitude of control variables has led to a wide range of possibilities for optimisation of these processes. Wilson (1991), has reviewed the basic techniques available for bioprocess control, and identified the main limitation and extensions of these techniques.
Monitoring and control of fermentation processes are necessary to ensure consistent performance of these processes (Salmon and Buckland, 1992). Many industrial processes are run using reliable measured parameter changes as a basis for process decision making (such as inoculation, induction, and feeding). Most parameters that can be directly determined are measurement of the physical conditions of the bioreactor. Sampling of the broth is required for analysis of many compounds that give information about the state of the fermentation. Off-line handling of the broth samples are often time consuming and involve an interruption of the process.
Availability of on-line measurements to recognise the specific identifiable events such as nutrient depletion and product formation for further process decision making (timing of the feed, harvesting a specific product, and automation of refilling the bioreactor) is an issue to be considered. Reliability of these measurements must also be considered, specially when the cost of the raw material is significance for some large scale fermentation operations.
Other factors which that need to be taken into account in attempting to use the monitored variables for process decision making are;
* Possibility of obtaining indirect information about the state of the fermentation by correlating the off-line sample measurements and the monitored variables.
* Reproducibility of the correlations of the two sets of monitored and measured data.
* Reliability of the monitored and measured variables.
* Availability of a signal form profiles of the on-line variables.
* Simplicity of detecting the signal.
1.1.1 C hoice o f the m icro-organ ism .
The selected micro-organism was Saccharomyces cerevisiae strain (GB4918 provided by Distiller's Company Ltd.) a Bakers yeast. S. cerevisiae was chosen as this micro organism satisfied the following criteria;
a) S. cerevisiae is commercially an important micro-organism in brewing, baking, and food manufacture.
b) There has been much research on microbiology, biochemistry, modelling and kinetics of yeast growth.
c) Yeast has an advantage over many organisms in being able to grow easily under both aerobic and anaerobic conditions, on defined and complex medium, and on a range of substrates.
d) Ease of cultivation makes the microbe suitable for quick data generation.
e) S. cerevisiae has been successfully cultured aerobically at pH 4.5 in a chemically defined medium, where the low acidic pH helps prevent contamination
infections.
1.1.2 P roject aim s and objective
With reference to the problems mentioned about the measurement for control of fermentations in section 1.1, the objective of this project was:
To use easily monitored variables (CO2 and DOT profiles) and their correlations with the biological events inside the batch bioreactor (nutrient depletion, and product formation) to aid process decision making (e.g. the timing of seed transfer, prediction of maximum product formation) for a better process operation and control of the batch bioreactor.
Accordingly, in order to achieve this objective, the following aims were identified:
a) To investigate the enzyme production levels during the exponential growth phase, through the transition into the stationary phase of the yeast growth. Intracellular enzymes such as G6PDH, hexokinase, ADH, and MDH were chosen as metabolic indicators of the transition phase.
b) To identify the correlations between the on-line monitored variables and the intracellular enzyme activity levels measured off-line, and to indicate the reproducibility of the correlations between these variables.
c ) To study the reproducibility of the assay profiles and to reduce the batch to batch variability of the profiles by performing repeated batch cultures under the same fermentation conditions as the batch cultures.
d ) To assess the variability of the off-line measurements to obtain a knowledge of the measurement error for establishing the validity of the correlations and events observed in the fermentations.
e) To use mathematical techniques to identify a signal from the on-line monitored variables, indicating the transition of the fermentation phase, where process decisions such as timing of the harvest or refilling the tank could be based on the recognised signal.
1.2
Yeast physiology
Saccharomyces cerevisiae physiology has been reviewed by many authors including Rose and Harrison (1987, 1989), Fraenkel (1982), Berry and Brown (1987), and Ratledge (1991). An overview of microbial yeast metabolism, glucose metabolism, and regulation of glucose metabolism is presented in this section. The information is used as a reference to understanding of glucose substrate uptake and cellular metabolic activity for production of some intracellular enzymes investigated in this work.
1.2.1 M icrob ial yeast m etabolism
Ratledge (1991) defined the metabolism as the overall biochemical reactions that take place inside the living organism for transformation of nutrients to cellular material. Metabolism is a combination of catabolism (degradation) and anabolism (biosynthesis) processes shown in Figure 1.1.
Catabolism is the break down of complex organic compounds by the cells to give a number of carbon intermediates as building blocks for cellular material, as well as providing energy in the form of ATP and some reducing power (NADH and NADPH). Whilst, anabolism is the biosynthetic process of the cells using carbon intermediates together with reducing power and the energy to make proteins, nucleic acid, polysaccharides and other monomers for making up the new cellular material.
Carbon substrate
New cells
Carbon intermediates
Reducing power Catabolism
Anabolism Ox
I
phosEnergy
Figure 1.1 Aerobic metabolism of yeast adapted from Ratledge, (1991). Processes of catabolism (degradation) and anabolism (biosynthesis), (Ox. phos. is oxidative phosphorylation).
Biosynthesis, active transport of ionic and neutral substrate through the cell membrane and mobility (work required for the cell division) use chemical energy in the form of ATP and release inorganic phosphate (Pj). The inorganic phosphate is used by the cell to phosphorylate ADP to ATP during the energy yielding reaction of catabolism.
The ATP molecule undergoes very rapid turn over in the ATP-ADP system, in order to transfer energy in the cell.
i) The ADP-ATP system provides the intermediate link between compounds with high and low phosphate group transfer potential, ADP acting as the acceptor and ATP as the donor of the specific enzymatic phosphate group.
1.2.2 G lucose m etabolism in S . c e r e v i s i a e
Glucose was the only carbon limiting substrate used in the study demonstrated in this thesis. When metabolised under two different environmental conditions glucose would metabolise to different end products. Glucose meatabolism in S. cerevisiae has been well documented by many authors including Fiechter and Seghezzi (1992), and Fraenkel (1982).
Glucose molecules transfer into the yeast cell and phosphorylate to produce glucose-6- phosphate. This reaction is catalysed by the hexokinase enzyme. The breakdown of glucose to pyruvate by a series of enzyme catalysed reactions is referred to as Glycolysis. Glycolysis, also known as the Emdben-Meyerhof-Parnas (BMP) pathway, illustrated in Figure 1.2, provides energy in the form of ATP, reducing power as NADH or NADPH, and intermediates for biosynthesis of cellular material. The phosphorylated group could also pass down another pathway, called the Pentose-phosphate pathway. The Pentose- phosphate pathway produces the required NADH for biosynthesis of amino acids.
During aerobic respiration, the pyruvate produced in glycolysis is converted to acetyl-CoA and oxaloacetate using the two enzymes pyruvate dehydrogenase and pyruvate carboxylase. The two products from pyruvate combine together to give citrate which is metabolised through a series of reactions known as tri-carboxylic cycle (TCA cycle), to produce carbon dioxide and water (see Figure 1.3). However, under anaerobic conditions, the pyruvate produced could not be metabolised to carbon dioxide and water via the TCA cycle, due to the absence of oxygen, and therefore would be shifted down the fermentation pathway to be reduced to ethanol (see Figure 1.3).
by the production of a large amount of carbon dioxide. Therefore, oxidative growth is the preferred metabolic type for S.cerevisiae biomass production.
The metabolic energy efficiency is observed in the relative stoichiometric biomass yield on glucose in the presence and absence of oxygen. Sonnleitner and Kappeli (1986) and Barford (1990) have shown that there is a limited respiratory capacity in yeast cells, even when the culture environment is saturated with oxygen. In an oxygen saturated culture, when there is a high glucose concentration, and therefore a high glucose uptake flux into the cell, the limited respiratory capacity of the yeast cells would be exceeded. Overflow of the remaining glucose within the metabolic pathways would occur from respiration to fermentation. This switching of the glucose flux occurs at pyruvate, at the end of the common glycolytic pathway, see Figure 1.3, as the excess glucose is diverted from the fully loaded TCA cycle, to the fermentation pathway to ethanol. Consequently, the yeast cell would be simultaneously operating two parallel pathways for the metabolism of glucose, and ethanol would be produced in the presence of oxygen. This parallel metabolism of glucose is referred to as respiro-fermentative metabolism (see Figure 1.4).
When the glucose uptake flux by the yeast falls, a point would be reached at which the limited respiratory capacity would not be exceeded, the yeast metabolism would then be purely respirative. Variation in glucose metabolism leads to variations in metabolic yields of the free yeast cell suspension in liquid phase culture, even when the culture environment is saturated with oxygen. Hence, the performance of the parallel pathway metabolism has to be taken into account in the assessment of products, since the yeast would not necessarily exhibit a purely respirative behaviour, even when the bioreactor is fully aerobic.
Regulation of the cellular internal glucose concentration in yeast is controlled by both metabolism and glucose transport system. From experimental observations, Barford (1981) indicated the importance of the glucose transport process into and out of the mitochondria. Cortassa and Aon (1994) concluded that sugar uptake has the main role in controlling of the flux ratio of the glycolytic pathway at the branch either towards ethanol production or the TCA cycle at the level of pyruvate. Regulation of glucose transport in S.cerevisiae has also been reviewed by Fuhrmann and Volker (1992).
Glucose — ATP
Hexokinase
ADP
T
Glucose-6-phosphate
Phosphoglucose isomarase
I
Fructose-6-phosphate — ATP
Phosphofructose
kinase ADP
Fructose 1,6-bisphosphate
i
Aldose
i
j Those phophate 1yDihydroxyacet _______ isomarase_______ ^jalyceraldehyde-3
one phosphate -phosphate
Glyceraldehyde 3-phophate dehydrogenase
NAD^
NADH
1
1,3-Biphosphoglycrate
Phosphoglycerate kinase
ADP ATP
T
3 -Phosphoglycerate
Phophoglycero mutase
t
2-Phosphoglycerate
E n o la se...
Phosphophenolpyruvate
Pyruvate ADP
kinase _ ATP
F
PyruveteGLUCOSE ATP
ADP H e x o k in a se ^ A o p ^ n a d p h ^ ^ . ^ 6 -GLUCOSE-6-PHOSPHATE
I
o
u
o
G 6 P D H
^u-PH OSPH OGLUCONO - 5 - LACTONE
A D H ►ACETALDEHYDE
PYRUVATE ► ETHANOL
coy
ATP
NADH NAD
NAD
ACETATE CO
NAD
ADP
'ATP ACETYL- CoA
NADH
OXALOACETATE
CITRATE
FUMARATE
TCA CYCLE
ISOC .TE
NAD
FADH
FAD
SUCCINATE
ADP CX— KETOGLUTARATE
NAD
Glucose
yeast cell
c D
carbohydratestorage
1
residual biomass:
N, E, St Glucose
pyruvate ethanol
respiratory bottleneck
CO^ .H O
oxidative growth on glucose
oxygen
medium
reductive growth on ethanol
ethanol
oxidative growth on ethanol
Figure 1.4 Schematic representation of glucose metabolism in S. cerevisiae (adapted from Sonnleitner, 1991).
Glucose, ethanol and oxygen are regarded as substrates. Three defined kinetic structural elements can be distinguished in the cell as:
- The respiratory bottleneck (limited respiratory capacity) - The total carbohydrate storage material
1.2.3 R egu lation o f glucose m etabolism in 5. c e re v isia e
The different pathways of glucose metabolism has been outlined in section 1.2.2. These various pathways have been examined by many workers, in order to try to explain the regulatory mechanisms involved in glucose metabolism. However, the nomenclature used by some researchers to describe these regulatory phenomena are rather confusing. Fiechter et a l (1981) classified some common terms used to describe regulation of glucose metabolism in yeast. A number of definitions are as follows (Fiechter et a l, 1981);
Growing cells Proliferating cells expressed in the form of biomass with
simultaneous assimilation of a carbon source present in adequate concentration
Resting cells Non-proliferating cells, no formation of biomass because of
incomplete nutritional requirements (mainly starvation of a nitrogen source)
Repression Relative decrease of enzyme formation irrespective of the underlying metabolism
Derepression Relative increase of enzyme formation irrespective of the underlying mechanism
Pasteur effect Inhibition of the glycolytic pathway in the presence of oxygen (manifested as inhibition of ethanol formation)
Crabtree or Glucose Repression of respiratory activity by glucose under aerobic effect conditions and subsequent deregulation of glycolysis with
formation of ethanol.
For glucose metabolism in S.cerevisiae two regulatory processes are thought to exist, regarding the response of this yeast to increasing concentration of oxygen or increasing concentration of glucose, namely, the Pasteur effect and the Crabtree effect. A full discussion of these effects is given in the review of Gancedo and Serrano (1989).
Pasteur eifect
Pasteur (1861), reported a decrease in fermentation (ethanol production) efficiency in the presence of oxygen. This behaviour was later referred to as the Pasteur Effect. This effect is only applied to fermentative yeasts ( those which produce ethanol as a by product). Kappeli (1986) reviewed the Pasteur effect in yeast and concluded that there was no satisfactory hypothesis for this phenomena. However, Soles et al., (1971) identified the reaction catalysed by phosphofructokinase as the main regulatory step in the Pasteur effect. This regulation was based on a feedback mechanism, with ATP acting as inhibitor and ADP and AMP being activators of the reaction. However, in their studies of S.cerevisiae in a continuous culture, Fiechter and Von Meyenburg (1966) and Von Meyenburg (1969) showed that below a critical dilution rate for pure oxidative glucose turnover, ethanol was not produced at all and only above the critical dilution rate was ethanol detected in the medium. Fiechter and Seghezzi (1992) stated that Pasteur effect does not describe a general metabolic phenomena but rather a single defined state of certain cultures under specialised conditions.
Crabtree effect
R ieger et al., (1983) proposed a regulatory m echanism , as illustrated in figures 1.5 and 1.6, for glucose uptake in S.cerevisiae w hich seem s to be supported by m any researchers (Sonnleitner and Kappeli 1986, A lexander and Jeffries 1990, and F iechter and Seghezzi
1992). The overflow reaction due to the respiratory capacity o f the yeast cell, represented
as a bottleneck (Sonnleitner and Kappeli, 1986), is used to explain the lim ited am ount o f
glucose flux that can be oxidised com pletely. The additional glucose is converted to
ethanol and passed into the medium.
K appeli (1986) and B radford and Hall (1979) concluded that in S. cerevisiae although glucose or catabolite repression accounted for the regulation o f certain enzym es, there
were m any other regulatory m echanism s controlled by other factors such as ethanol, CO?
and N A D H . The com plexity o f the processes involved in glucose m etabolism has
therefore lead to m isuse o f the term s C rabtree and Pasteur effects. K appeli (1986)
suggested that the terms Crabtree effect and Pasteur effects should no longer be applied to
S .c e r e v is i a e , as these term s w ere connected w ith regulatory co n cep ts that did not
correspond to the actual situation.
In the review by F iech ter and S eghezzi (1992), these researchers claim ed that the
c o n fu sio n cau sed by the term in o lo g y o f the P asteu r E ffect and p rese n tatio n o f
contradictory data in the literature is caused by the fact that no clear differentiation between
observations obtained from grow ing and resting cells was m ade and, the two cell types
w ere com pared directly, and that the Pasteur Effect is only observed in resting cells.
Therefore the term Pasteur effect is not recom m ended to be used to describe general yeast
m etabolism . F iech ter and S eghezzi (1992) also recom m ended that the expression
'C rabtree Effect' should not be used to describe the m etabolic event o f ethanol form ation
in the presence o f oxygen, since in his experim ents Crabtree (1929) w as w orking with
tum our cells which were probably resting cells when he noticed the form ation of lactate in
the presence o f oxygen.
R epression o f the enzym es o f the TC A cycle and electron transport chain has been
reported for S.cerevisiae under conditions o f glucose excess (Polakis and Bartly 1965, B eck and von M eyenburg 1968, F iechter et al. 1981). Z eng and D eckw er (1994) concluded that the presence o f glucose in the culture represses the activity o f the TC A
cycle but not the respiratory capacity o f S.cerevisiae. The authors also concluded that bottlenecks in the oxidative glucose m etabolism o f S.cerevisiae occur at the level o f the
TC A cycle or beyond.
The effect o f the above regulatory phenom enon o f glucose m etabolism on the aerobic
subcri tical critical superacritical
* * * * *
Glucose oxidatively metabolised
Upper section:
Low er section:
metabolised
ethanol
produced not usable
Glucose as the only substrate
M ixed substrate glucose-ethanol
F igure 1.5 Lim ited respiratory capacity of S. cerevisiae illustrated as a bottleneck (K appeli, 1986) determ ining the conversion path o f glucose to biom ass (purely oxidative,
oxidoreductive). Adapted from Fiechter and Seghazzi ( 1992).
The substrate flux is called subcritic al if the total am ount o f substrate(s) flux can be
pass the b ottleneck, i.e. substrate is m etabolised purely o x id ativ ely and the actual
respiratory capacity is not exceeded. The flux is then called critical when the bottleneck is
com pletely filled, the theoretical oxygen dem and can ju st be m et by the resp iratory
capacity. In the supercritical case, w hen the substrate flux no lo nger fits in to the
bottleneck, the follow ing situations m ust be considered: (1) G lucose flux is supercritical.
The substrate flow exceeds the respiratory capacity. The residual part o f glucose that can
not pass the bottleneck is m etabolised reductively (a) and ethanol is excreted into the
m edium (top right). If additional ethanol is supplied to the m edium , the ethanol can not
pass the bottleneck because the bottleneck is filled w ith glucose. H ence the ethanol
rem ains unused (c) because there is no reductive m etabolic pathw ay to utilise ethanol (top
right). (2) G lucose flux is subcritical but there is additional ethanol in the m edium .
Ethanol is utilised oxidatively as long as glucose flux doesn't saturate the cell's respiratory
capacity (b), (glucose flux fits (in addition to the fully oxidative flux) into the bottleneck).
The residual ethanol can not be m etabolised and rem ains untouched in the m edium as soon
as saturation occurs (c).
Glucose
Cell envelope
Synthesis of biomolecules m
Pyruvate
m
Synthesis of : gluconeogenic enzymes, tricarboxylic acid-cycle
enzymes,
/ \ mitocondrial enzymes, \ I glyoxylate-cycle enzymes
Ethanol ''
A
1.3
A ero b ic grow th o f 5.
ce re v is ia e
in b a tch cu ltu r e
In an aerobic batch culture, Saccharomyces cerevisiae degrades glucose through a combination of oxidative and reductive metabolisms, referred to as an oxido-reductive metabolism. The choice of the pathway depends on the limitations on the respiratory capacity affected by limitations on oxygen and glucose (Auberson and Stocker, 1992). Oxygen may be limiting either by supply or by biological limitations such as respiratory bottleneck. Reducing the oxygen supply enhances the reductive metabolism, resulting in the formation of increasing proportion of ethanol relative to biomass formation. This shift toward reductive metabolism is a means by which the cell can generate the required ATP through glycolysis, since ATP production from oxidative phosphorylation has been restrained by a decreasing oxygen supply. Glucose may be limiting by respiratory bottleneck which limits the amount of subatrate that can be funneled completely through the oxidative pathway (Rieger et a i, 1983 and Sonnleitner and Kappeli, 1986).
The diauxic growth pattern of S.cerevisiae in an aerobic batch culture has been described by Sonnleitner and Kappeli (1986), Fiechter et a l, (1987), and Barford (1990). With glucose as the sole carbon source, the widely accepted view is to divide the batch into two growth phases (see Figure 1.7). During the first growth phase, formation of biomass is associated with the accumulation of ethanol, as glucose metabolises respiro- fermentatively, biomass yield of 0.5 to 0.15 gL’ ^ dry cell weight (g glucose)" ^ was reported. As ethanol is produced, the carbon dioxide production rate is higher than the oxygen uptake rate, leading to a respiratory quotient above unity. After a lag phase of about two hours, during which glucose is totally exhausted, the second growth phase is started with biomass yield of up to 0.35 g.L'^ dry cell weight (g g l u c o s e ) " T h e respiratory quotient is significantly below unity, since the oxygen uptake rate is higher than the carbon dioxide production rate. RQ approaches the oxidative theoretical value of 0.66. Maximum growth rate was reported to be 0.35 h~^ for the first phase and 0.1 h"^ for the second growth phase.
glucose c o n c en tra tio n in the aerobic batch culture w o u ld in flu en ce the u p tak e flux o f
g lucose due to the ex istence o f different transport system s for g lucose th ro u g h the cell
m em brane. H ence the occurrence o f respiro-ferm entative m etabolism depends on both the
internal m etab o lic co n dition o f the cells and the external en v iro n m en ta l c o n d itio n s in a
batch culture. E nvironm ental variables affecting a ferm entation p rocess are d isc u sse d in
section 1.4.
20.Ü
8.5
3 . 5
o u
0.7
Time (h)
Figure 1.7-a A erobic grow th o f S.cerevisiae with glucose lim iting substrate at an initial
c o n c en tra tio n o f 20 g/L. * in d icates biom ass ( g L 'O , ^ g lu c o s e co n cen tratio n (g L ‘ 0 ,
and ^ ethanol concentration (gL ‘ 0 . A dapted from Fiechter et a i , (1987)
1.1
IL
1 1 1"O
^ c
V: o
CK: o 20
1 0. 0 c
15
cr
10
5.0 cu
5
0
Time (h)
F ig u re 1.7-b O xygen uptake rate ■ O U R (m m olg’ ^ h "!), carb o n dio x id e p ro d u ctio n
rate • C E R ( m m o lg '^ h '^ ) , and resp iratory quotient ^ o f an a ero b ic b atch g ro w th o f
S.cerevisiae. A dapted from F iechter et a i , (1987).
1.3.1 R ep e ated b a tc h fe rm e n ta tio n s
Fill and draw or repeated batch m ode o f operation is w hen a proportion of the com pleted
batch is left in the bioreactor to act as an inoculum for the next run. This process operation
is usually used in the case o f waste w ater treatm ent. The m ethod has been effective in
large scale production o f m onoclonal antibodies (B acker et al., 1988), p ro d u ctio n o f
industrial enzym es (Salm on and B uckland, 1992), and in recent studies o f autom atic
b io p ro c e ss co n tro l o f S . c e r e v i s i a e (L ocher et ai., 1991, 1993). R ep eated b atch ferm entation is a key com ponent o f the w ork presented in this thesis, and is aim ed at
providing reproducible ferm entations.
In their process for the large scale production o f m onoclonal antibodies. B ack er et ai.,
(1988) reported that the inoculum was initially provided from spinner flasks for the 150L
vessel (120L w orking volum e). Every 48h, the bulk o f the culture fluid w as harvested
and approxim ately 10% was left in the bioreactor to inoculate the next ferm entation; the
inoculum fraction w as adjusted to account for cell co n centration and viability. The
observation was made that the cell viabilities were generally over 95% through m ost o f the
ferm entation but may drop about 80% in the last hour before harvest w hich is the same
tim e as inoculation o f the next batch. B acker et ai., (1988) suggested an increase in the final antibody concentration could be aehieved by extending the ferm entation beyond the
period o f increasing cell concentration; how ever, this typically resulted in lo w e r cell
v iab ilitie s and a lag phase upon inoculating the next batch. W hen the e u ltu re w as
m ain tain ed in a co nstant grow th m ode, good long term stability o f cell g ro w th and
antibody characteristics were observed in the system.
In the article on m onitoring and control o f m icrobial ferm entations, Salm on and B uckland
(1992) show ed data from a repeated batch ferm entation (150 L w orking volum e) for the
production o f an industrial enzym e, w here pH, O U R, and DO w ere m easured and about
30% o f the batch were used as inoculum for the next batch. C haracteristics o f the diauxic
grow th o f the organism w as observed in both off-gases and in situ D O m easurem ents.
Identification o f the transition from these data w ere used for starting o f each new batch.
T he authors did not state the nature o f the m icroorganism and the enzym e p ro d u ced ,
neither did they state the variability o f the assay and the profile o f the products.
Locher et a l, {\99\) studied the performance of an automatic bioprocess control of aerobic S.cerevisiae in a defined medium containing 3% glucose as a repetitive batch cultivation, where no disturbances or human interactions with the bioprocess were allowed (e.g. no manual sampling of the bioreactor). After each batch 95% of the broth was harvested and the remaining 5% was used as inoculum for the next batch. The bioreactor was refilled automatically using a supervisory computer system that could be triggered either by a timer or by defining a growth phase. The high degree of automation for the repeated batch mode of operation was shown to allow the bioreactor to be used more intensively. The decision making for the refill/fill action was completely automated leaving the equipment unattended most of the time. The repeated batch method was used to investigate the role of different nutrients during growth. Fourteen pulses of 3 different substances in different amounts were applied to a batch culture. The first pulse was triggered by automatic detection of a certain phase whereas the following 13 pulses was configured within 5 min. A high degree of reproducibility was also shown in the partial pressure of ethanol, CO2 exit gas analysis (see Figure 1.8), optical density and redox potential.
o
O d
0.0 16.0
time (h)
Fig 1.8 A graphical representation of 8 overlaid repetitive batch experiments of CO2 exhaust gas analysis.(Adapted from Locher et a l, 1991, 1993).
Phase 1 Cells grow exponentially on glucose with no significant limitations. Ethanol is being produced, excretion of secondary metabolites; glycerol, and organic acids (pyruvic acid, acetic acid, and propionic acid) are also reported.
Phase 2 The CO2 measured in the exhaust gas is no longer exponential. This effect was not observed when yeast extract was added or the bioreactor was stirred less vigorously.
Phase 3 Glucose is exhausted and cells start utilising pyruvic acid.
Phase 4 Utilisation of acetic acid, glycerol, and to a minor extent propionic acid is the characteristic of this phase.
Phase 5 Phases 5 and 6 are ethanol dominated. Acetic acid is excreted and accumulates until ethanol is completely exhausted. Glycerol is also reutilised.
Phase 6 This phase is mainly caused by ethanol (and glycerol) consumption in combination with acetic acid excretion.
1.3.4 F erm en tation products
When grown under aerobic conditions with glucose as the sole energy and carbon sources, S.cerevisiae produces the necessary enzymes to metabolise glucose and releases ethanol as a by product. Although biomass is usually the main product of Baker's yeast fermentations and ethanol is considered to be the main by product of glycolysis in S. cerevisiae, a considerable range of enzymes and other intracellular components are also produced by yeast (Peppier, 1977).
Yeast enzymes may generally be divided into two categories of commercial importance (Barford, 1987). Enzymes with significant importance to the food industry and others which are used as chemicals in laboratories. Invertase, lactase and some production of lipase are the major enzymes in the first category. Enzymes which may be categorised as fine chemicals are alcohol dehydrogenase, aldehyde dehydrogenase, glucose-6 phosphate dehydrogenase, alpha-glucosidase and hexokinase. The use of these enzymes are listed as assay of ethanol for ADH, generation of NADP+ by G6PDH, and assay of malate for MDH enzyme (Atkinson and Mavituna, 1991).
Formation of glucose-6-phosphate dehydrogenase (G6PDH), hexokinase, alcohol dehydrogenase (ADH) and malate dehydrogenase (MDH) intracelular enzymes (see Figure 1.3) were considered as products of fermentations to seek correlations between these metabolic indicators and monitored variables for on-line recognition of fermentation phase transition decision making and optimisation of the process.
cycle were increased by a factor of 10 in the case of succiinate-cytochrome c and by a factor of 20 in the case of MDH.
Polakis and Bartley, (1965) studied the changes in enzyme activities of S.cerevisiae during aerobic growth on different carbon sources. Table 1.1 shows the enzyme activity of the cells grown in a synthetic medium with glucose as the carbon source. At all stages, malate dehydrogenase was reported to be the most active enzyme of the TCA cycle. For the cells grown on glucose in a synthetic medium, during the first exponential stage of growth the cells had the lowest MDH activity and in the second exponential stage of growth an increase in the activity of about 6-7 fold was observed in the cells for this enzyme.
Growth phase First stage Second stage Late Second exponential exponential exponential
growth growth growth
Time o f growth (h) 12 15 30
Enzvme (pmoles/min /m s protein)
Pyruvate kinase 123 197 128
Pyruvate decarboxylase 6580 2520 2280
Pyruvate-oxidase system 3.8 7.5 6.8
Acetyle-CoA kinase 17.5 20.8 26.1
Isocitrate dehydrogenase 17.6 33.4 30.8
(NAD+ linked)
Isocitrate dehydrogenase 25.9 72.3 69.8
(NADP+ linked)
Succinyl-CoA synthetase (ATP) 6.8 7.8 9.1
Fumarase 211 407 423
Malate dehydrogenase 450 2860 3060
Isocitrate lyase <1 41.4 56.2
Malate synthase <1 16.9 22.3
Glutamate dehydrogenase 1 30.6 26.5
(NAD+ linked)
Glutamate dehydrogenase 2910 1600 1630
(NADP+ linked)
Glutamate-oxaloacetate transaminase 148 126 116
Aspartase 3.8 26 20.3