Atmos. Meas. Tech., 6, 765–775, 2013 www.atmos-meas-tech.net/6/765/2013/ doi:10.5194/amt-6-765-2013
© Author(s) 2013. CC Attribution 3.0 License.
EGU Journal Logos (RGB)
Advances in
Geosciences
Open Access
Natural Hazards
and Earth System
Sciences
Open Access
Annales
Geophysicae
Open Access
Nonlinear Processes
in Geophysics
Open Access
Atmospheric
Chemistry
and Physics
Open Access
Atmospheric
Chemistry
and Physics
Open Access
Discussions
Atmospheric
Measurement
Techniques
Open Access
Atmospheric
Measurement
Techniques
Open Access
Discussions
Biogeosciences
Open Access Open Access
Biogeosciences
Discussions
Climate
of the Past
Open Access Open Access
Climate
of the Past
Discussions
Earth System
Dynamics
Open Access Open Access
Earth System
Dynamics
Discussions
Geoscientific
Instrumentation
Methods and
Data Systems
Open Access
Geoscientific
Instrumentation
Methods and
Data Systems
Open Access
Discussions
Geoscientific
Model Development
Open Access Open Access
Geoscientific
Model Development
Discussions
Hydrology and
Earth System
Sciences
Open Access
Hydrology and
Earth System
Sciences
Open Access
Discussions
Ocean Science
Open Access Open Access
Ocean Science
Discussions
Solid Earth
Open Access Open Access
Solid Earth
DiscussionsThe Cryosphere
Open Access Open Access
The Cryosphere
DiscussionsNatural Hazards
and Earth System
Sciences
Open Access
Discussions
The CM SAF SSM/I-based total column water vapour climate data
record: methods and evaluation against re-analyses and satellite
M. Schr¨oder1, M. Jonas1,*, R. Lindau2, J. Schulz3, and K. Fennig1
1Satellite-based Climate Monitoring, Deutscher Wetterdienst/Frankfurter Straße 135,
63067 Offenbach, Germany
2Meteorologisches Institut, Universit¨at Bonn, Auf dem H¨ugel 20, 53121 Bonn, Germany
3European Organisation for the Exploitation of Meteorological Satellites, Eumetsat-Allee 1, 64295 Darmstadt, Germany *now at: Centre de Recherche Public – Gabriel Lippmann, Syst`emes d’Information et Organisation, Service HPC/41,
rue du Brill, 4422 Belvaux, Luxemburg
Correspondence to: M. Schr¨oder ([email protected])
Received: 20 July 2012 – Published in Atmos. Meas. Tech. Discuss.: 7 September 2012 Revised: 21 February 2013 – Accepted: 26 February 2013 – Published: 19 March 2013
Abstract. The European Organisation for the Exploitation
of Meteorological Satellites (EUMETSAT) Satellite Appli-cation Facility on Climate Monitoring (CM SAF) aims at the provision and sound validation of well documented Cli-mate Data Records (CDRs) in sustained and operational environments. In this study, a total column water vapour path (WVPA) climatology from CM SAF is presented and inter-compared to water vapour data records from various data sources. Based on homogenised brightness temperatures from the Special Sensor Microwave Imager (SSM/I), a cli-matology of WVPA has been generated within the Ham-burg Ocean–Atmosphere Fluxes and Parameters from Satel-lite (HOAPS) framework. Within a research and operation transition activity the HOAPS data and operation capabilities have been successfully transferred to the CM SAF where the complete HOAPS data and processing schemes are hosted in an operational environment. An objective analysis for in-terpolation, namely kriging, has been applied to the swath-based WVPA retrievals from the HOAPS data set. The result-ing climatology consists of daily and monthly mean fields of WVPA over the global ice-free ocean. The temporal coverage ranges from July 1987 to August 2006. After a comparison to the precursor product the CM SAF SSM/I-based climatol-ogy has been comprehensively compared to different types of meteorological analyses from the European Centre for Medium-Range Weather Forecasts (ECMWF-ERA40, ERA INTERIM and operational analyses) and from the Japan Meteorological Agency (JMA–JRA). This inter-comparison
shows an overall good agreement between the climatology and the analyses, with daily absolute biases generally smaller than 2 kg m−2. The absolute value of the bias to JRA and ERA INTERIM is typically smaller than 0.5 kg m−2. For the period 1991–2006, the root mean square error (RMSE) for both reanalyses is approximately 2 kg m−2. As SSM/I WVPA and radiances are assimilated into JMA and all ECMWF analyses and to assess consistency with existing WVPA cli-matologies, the SSM/I-based climatology is also compared to the time series of SSM/I and TMI (Tropical Rainfall Mea-suring Mission Microwave Imager) WVPA from Remote Sensing Systems (RSS), leading to results consistent with the reanalyses results. This evaluation study gives confidence in consistency, accurateness and stability of the total water vapour climatology produced.
1 Introduction
766 M. Schr¨oder et al.: The CM SAF SSM/I-based total column water vapour climate data record
ice albedo feedbacks and is dominated by water vapour in the tropical free troposphere (Held and Soden, 2000; IPCC, 2007). With increasing temperature the water vapour content in the lower troposphere increases. This results in changes of the hydrological cycle, in particular also in increased likeli-hood of more intense precipitation events (IPCC, 2007; Al-lan et al., 2010). The spatial distribution of WVPA (total column water vapour path) and precipitation and their sea-sonal cycle exhibit clear similarities, at least in the tropics (Trenberth, 2011). With increasing temperature and with un-changed winds, wet areas will get wetter and dry areas will get drier, as noted, e.g. in Chou and Neelin (2004) and Allan and Soden (2007). This likely leads to intensified droughts in divergence zones of the subtropics and floods in the conver-gence zones of the tropics. Eventually, the combined effect of more intense precipitation events and increased WVPA will affect atmospheric circulation. More details can be found in, e.g. Trenberth (2011) and Sherwood et al. (2010).
Analysing the recent decades of the global water vapour distribution and changes is expected to help extend our un-derstanding of the climate system and how it responds to in-creasing greenhouse gas concentration. Also, the analysis of synoptic scale water vapour transports can yield valuable in-sights into the dynamics of the atmosphere and its evolution. The Global Climate Observing System (GCOS) intro-duced and defined Essential Climate Variables (ECV), one of them being WVPA. Requirements for accuracy (stated as bias) and stability, which is the temporal variation of the bias, for WVPA are provided by GCOS and published in GCOS-107 (2011): 1 % (bias) and 0.3 % per decade (stabil-ity). Current CDRs (climate data records) are mainly based on observations of operational satellite systems that were pri-marily built to support short-term weather and environmental prediction applications. Many problems are associated with the utilization of operational satellites for climate monitor-ing due to – among other reasons – instrument changes and changes in calibration approaches. In consequence, signifi-cant efforts are needed to homogenise and inter-calibrate ra-diance data records for input to consistently-applied retrieval schemes that derive ECVs such as WVPA. The Sustained and Coordinated Processing of Environmental Satellite Data for Climate Monitoring (SCOPE-CM) was initiated by the WMO (World Meteorological Organization) in order to es-tablish a network of facilities to provide satellite-based ECVs in high quality and in a continuous and sustained environ-ment. One of SCOPE-CM’s pilot projects, led by CM SAF (Satellite Application Facility on Climate Monitoring), fo-cuses on ECV retrievals from SSM/I (Special Sensor Mi-crowave Imager) observations and therefore indirectly also on the quality assessment of the underlying radiance record. Long-time series of WVPA based on recalibrated and ho-mogenised radiance data records from SSM/I observations are developed and processed at RSS Remote Sensing Sys-tems (Wentz, 1997) and can be accessed via http://www. ssmi.com/. Another global water vapour climatology data
set from the NASA (National Aeronautics and Space Ad-ministration) Water Vapour Project (NVAP) is based on a combination of SSM/I, TOVS (TIROS Operational Vertical Sounder) and radiosonde data for the years 1988–1999 (Ran-del et al., 1996) and is being reanalysed and extended to cover the period 1988–2009 (NVAP-M as part of NASA’s MEaSUREs (Making Earth System Data Records for Use in Research Environments) programme, Vonder Haar et al., 2012). A second project on water vapour within the MEa-SUREs programme focuses on the generation of multi-sensor water vapour climate data record using cloud classification from A-Train measurements and has recently been released under http://disc.sci.gsfc.nasa.gov/.
Employing the Clausius–Clapeyron relationship between temperature and the approximate response of saturation vapour pressure leads to a theoretical change in atmo-spheric water vapour of 7 % K−1 (IPCC, 2007). Trenberth
et al. (2005) analysed decadal trends in WVPA from SSM/I over open oceans and found an average trend of∼1.3 % per decade or 8.87 % K−1relative to observed changes in sea sur-face temperature. Considering the tropical belt, a value of 7.8 % K−1 has been observed which is slightly larger than the theoretically expected value.
In this paper we introduce the CM SAF total column wa-ter vapour climate data record (Jonas et al., 2009) derived from SSM/I observations onboard the Defense Meteorolog-ical Satellite Program (DMSP) platforms using the HOAPS (Hamburg Ocean–Atmosphere Fluxes and Parameters from Satellite) algorithm for WVPA (Schl¨ussel and Emery, 1990). The HOAPS algorithm package has been developed at the Max-Planck Institute for Meteorology (MPI) and the Univer-sity of Hamburg (UHH) (Schulz et al., 1998; Jost et al., 2002; Andersson et al., 2010). The HOAPS algorithm and associ-ated products are widely used in the scientific community, e.g. in Chou et al. (2004), Curry et al. (2004), Gershunov and Roca (2004), Kumar and Schulz (2002), R¨oske (2006) and Sohn et al. (2004), and have been positively evaluated in an independent retrieval assessment by Sohn and Smith (2003). The WVPA product has further been post-processed by ap-plication of an objective analysis for interpolation, namely kriging. Kriging has the advantages to allow for gap filling and to derive an uncertainty estimate on grid basis. The CDR, the product requirements on WVPA, the theoretical basis for the retrieval, validation results, a user guide and a description of the processing chain are available at the CM SAF webpage (http://www.cmsaf.eu) free of charge. The document pack-age fully describes the processing and the product, ensuring traceability and reproducibility.
M. Schr¨oder et al.: The CM SAF SSM/I-based total column water vapour climate data record 767
2 Total column water vapour from SSM/I
The WVPA climatology is based on data from six SSM/I instruments on DMSP F-08, F-10, F11, F13, F14, and F15 platforms. As the SSM/I instruments on the F-09 and F-12 satellites have failed, the climatology is derived using the remaining six instruments. Details on the SSM/I instrument characteristics can be found in Hollinger et al. (1987).
The DMSPs have a temporal overlap to at least one con-secutive satellite, which makes the homogenisation of the measured brightness temperatures between different SSM/I instruments feasible. For the homogenisation, the SSM/I on F-11 has been chosen as a reference instrument, because the F-11 observation period has maximum overlap with other DMSP satellite observations. Using the overlap between the DMSPs, probability density functions (PDFs) based on ten days of the brightness temperatures have been calculated and statistically matched in each channel. The matching coef-ficients can then be used to homogenise the measurements of different SSM/I instruments. Details on the homogenisa-tion scheme are described in Fennig (2001) and Andersson et al. (2010).
The data set has global coverage, i.e. within±180◦ lon-gitude and ±80◦ latitude, and is defined for the ice-free oceanic surface with a minimum distance of 50 km to land surfaces. The data are available as daily and monthly aver-ages. The temporal coverage ranges from 9th of July 1987 to 31st of August 2006. The data set is available from http: //www.cmsaf.eu/.
2.1 Retrieval
Schl¨ussel and Emery (1990) developed four retrieval schemes for WVPA utilising different combinations of SSM/I channels. These schemes are of semi-physical nature, i.e. they are based on forward radiative transfer calculations on a set of atmospheric profiles followed by a statistical in-version using linear regression. All four variants of the to-tal column water vapour retrieval purely depend on SSM/I brightness temperatures and regression coefficients derived from the initial set of atmospheric profiles. The retrievals do not depend on any additional information.
For long-term applications the availability of the chan-nels used by the retrieval is a crucial limitation. In view of the failure of the 85 GHz channel on F-08, the Schl¨ussel and Emery (1990) retrieval variant employing the 22 and 37 GHz channels has been implemented for long-term appli-cation, although the use of the 85 GHz channel data might improve accuracies slightly when present. The continuous availability and homogeneity of the input data source is clearly an advantage of the two-channel retrieval scheme. With the two-channel variant, 98.9 % of the variance within the training data set could be explained by the regression for-mula. The remaining uncertainty, which may be interpreted as the accuracy of the statistical retrieval, is given by the
au-thors as 1.5 kg m−2. A detailed description of the retrieval
schemes and the statistical inversion technique can be found in Schl¨ussel and Emery (1990).
2.2 Objective analysis for interpolation
After the retrieval of WVPA on the satellite swath, an objec-tive analysis technique called kriging is applied to map the retrievals in space and time to the product grid. The principle is that an estimate or prediction for an unobserved location is performed by using the observations from locations in the vicinity. The optimal estimate at each grid point is found by a weighted average of the information from the surrounding points. The challenge is to determine the optimal weights for each of the used observations. These depend on two parame-ters: the distance-dependent spatial correlation function and the error of the used observation. Kriging provides both op-timum fields of the considered parameters together with an error map and allows the generation of fully covered fields giving values even in areas with a very low data density.
Kriging can be regarded as a prediction of a valuex0at a
locationP0where no measurement has been carried out, by
using information at surrounding positionsPi:
x0= n
X
i=1
λi(xi+1xi), (1)
wherex0is the value which has to be predicted.xi denotes the available measurements and1xitheir errors. The task is to determine the weightsλi. Obviously a solution is not pos-sible for a single case. But if a time series of m measurements at each locationPiis available, a reasonable constraint is that
the mean squared deviation between predictions and truth is minimal:
m
X
t=1 x0−
n
X
i=1
λi(xi+1xi)
!2
=min. (2)
When searching for an optimum set of weightsλi, Eq. (2) has
to be differentiated with respect to allλi. This leads to a set of nlinear equations, which can be written as a matrix equation (Eq. 3). For the sake of clarity, the temporal summation over
mis abbreviated by brackets [. . . ]. The errors are assumed here to be random, so that all mixed terms [xi1xi] are zero (no tendency of overestimating high and underestimating low values). This assumption seems to be valid as validations of the retrieval scheme have not shown such systematic errors (Sohn and Smith, 2003). Furthermore, all error covariances [1xi1xj] (withi unequalj) are zero if different
768 M. Schr¨oder et al.: The CM SAF SSM/I-based total column water vapour climate data record
[x1x1]+[1x11x1] [x1x2] · · · [x1xn]
[x2x1] [x2x2]+[1x21x2]· · · [x2xn]
..
. ... ... ...
[xnx1] [xnx2] · · ·[xnxn]+[1xn1xn]
×
λ1 λ1 .. . λn
=
[x0x1] [x0x2]
.. . [x0xn]
. (3)
The result is a linear set of equations containing the covari-ance matrix between the data pointsPi with the error vari-ances on its diagonal, and a vector giving the covariance between the predicting pointP0and the locationsPi where
measurements are available.
Obviously, the minimized expression in Eq. (2) is equal to the error of the predicted value, often called kriging error (σkrig). Transformation of that expression leads to
σkrig=[x0x0]−2 n
X
i=1
λi[x0xi]
+ n
X
i=1 n
X
j=1
λiλjxixj+ n
X
i=1
λiλi[1xi1xi]. (4)
The first term of the kriging error denotes the variance atP0. The second term in Eq. (4) contains the covariances between the predicting point P0 and the data points Pi, and repre-sents that part of the kriging error which can be called in-formation. Its negative sign indicates that the error decreases with increasing information. But two points in close vicin-ity can contain redundant information, which is represented in the third term. The associated covariance between these data points increases the kriging error. The fourth term ob-viously describes the effects of individual errors of the used data points. The kriging error may be interpreted as unex-plained variance at the prediction point.
If anomalies, determined by subtracting the monthly mean
¯
x from the observations, are normalised with the standard deviationσx of daily means within a month, the time series
at all grid points has a standard deviation of 1. Consequently, correlation and covariance are identical.
The kriging is performed for daily averages. These daily averages are calculated from the satellite raw data in two steps. First, neighbouring pixels of the same overpass and satellite are averaged to intermediate means at time of over-pass on a rectangular grid of 0.5×0.5◦. The variance be-tween these intermediate means can be considered to be in-dependent from each other because they are based on differ-ent satellite overpasses during the day which are hours apart. In a second step, the intermediate means are averaged once again to obtain the final daily mean. This way equal weight is given to each temporal contribution. The underlying vari-ance of the intermediate means is used to estimate the error
variance of that specific daily mean:
ε= 1 nk(nk−1)
nk
X
i=1
(xki− ¯xk)2, (5)
wherexkidenotes the values within thekth day,nkthe num-ber of observations of thekth day andxk¯ the corresponding daily mean.
The covariance of daily means is calculated as a pure func-tion of distance. This is a further reason for normalising the values. Otherwise, regions of high variability would domi-nate the results. In the concrete accomplishment, an exponen-tial function is fitted to the correlations. More details on the kriging routine are described in Lindau and Schr¨oder (2010).
2.3 Climatology
The output fields from the kriging are the gridded WVPA, number of valid observations and uncertainty information. The arithmetic average per grid of the defined data values of the full time series is displayed in the top panels of Fig. 1. The average WVPA field exhibits maxima in the tropics, in particular over the warm pool region, regional minima at the continental west coasts and a general decrease towards the poles. The standard deviation shows maxima where spatial gradients in WVPA are largest, associated with the annual north–south migration of the intertropical convergence zone (ITCZ) and in storm track regions as well as minima at the continental west coasts and in the polar region. An exemplary daily average and its associated kriging error are shown in the bottom panels of Fig. 1. General features are similar as in the top left panel but exhibit much more fine structure. For example, an atmospheric river can be observed in the South Pacific which transports moisture from the tropics to the extra-tropics. The kriging error (bottom right panel) ex-hibits pronounced maxima in data void areas, which is a di-rect consequence of the decreased confidence with distance to valid observations.
3 Evaluation of the SSM/I total column water vapour
3.1 Approach
The evaluation setup is outlined and an in-depth discussion of the results is given in the following sections. A thor-ough evaluation of the WVPA products versus radiosondes or other ground based instruments is hampered by the almost non availability of accurate in situ observation in ocean areas. Thus, the evaluation is performed as follows:
M. Schr¨oder et al.: The CM SAF SSM/I-based total column water vapour climate data record 769
Discussion
P
ap
er
|
Discussion
P
ap
er
|
Discussi
on
P
ap
er
|
Discussion
P
ap
er
|
Fig. 1.WVPA (top left) and extra daily standard deviation (top right) from SSM/I averaged over the period 1987–2006. The bottom panels show WVPA and kriging error for an exemplary day in April 2001.
23
Fig. 1. WVPA (top left) and extra daily standard deviation (top right) from SSM/I averaged over the period 1987–2006. The bot-tom panels show WVPA and kriging error for an exemplary day in April 2001.
Furthermore, the CM SAF HOAPS products are compared to the previous HOAPS version as provided by MPI/UHH, to WVPA products from SSM/I (V6) and TMI (Tropical Rain-fall Measuring Mission Microwave Imager) (V4) derived by RSS, and to various reanalysis data sets. The first compar-ison aims at the analysis of the effect of different mapping algorithms onto the products, while the comparison to the RSS products and to the reanalyses considers bias, RMSE (root mean square error) and differences in linear trends (RSS product only).
3.2 Algorithm evaluation
Sohn and Smith (2003) have carried out a study to com-pare various statistical and physical water vapour retrieval schemes based on SSM/I observations. Their primary goal was the identification of differences between those algo-rithms and their dependence (a) on various “tangential en-vironmental factors” (such as SST, cloud water path, sur-face wind speed) and (b) on the training data set used for the derivation of the regression coefficients in case of the re-trievals using statistical inversion. In the study, the Schl¨ussel and Emery (1990, S&E) algorithm as used in this CM SAF product has been compared to four statistical and two phys-ical retrieval schemes (see Sohn and Smith, 2003 for refer-ences). Additionally, a previously developed “optimum sta-tistical retrieval” (WOS) based on an earlier comparison ex-ercise carried out by Wentz (1995) has also been used. The results of their study can be summarised as follows:
Within both retrieval types (statistical and physical), the algorithms agree quite well. Nevertheless, the physi-cal retrievals show a significant positive bias and greater RMSE compared to the statistical retrievals which are based on a temporally and geographically limited selection of radiosonde soundings.
Within the statistical retrievals, the WOS retrieval was considered a benchmark. The S&E algorithm applied here has been found as close as 0.5 kg m−2 to this benchmark
throughout the year and most regions. The variability in the water vapour column was represented almost identically.
3.3 Comparison against previous HOAPS WVPA product
The CM SAF WVPA product (CM SAF HOAPS v3.1) has been compared to its previous version, HOAPS v3, which is accessible via http://www.hoaps.zmaw.de. The average abso-lute (left panel) and relative (right panel) differences between both data sets are shown in Fig. 2. Absolute and relative dif-ferences are generally positive, with global mean values of 0.3 kg m−2and 1.1 %, respectively, and with maximum
val-ues of∼1.5 kg m−2and∼3 %, respectively. Local maxima
in absolute differences are correlated with maxima in WVPA, that is, over the tropics and warm ocean currents. The local maxima in relative difference are observed over storm track regions.
To understand the differences it is relevant to repeat the need for independent observations in the kriging procedure (see Sect. 2.2). Therefore, the systematic difference is po-tentially caused by the different averaging approaches in the determination of monthly means: in HOAPS v3 all values within a month and grid box are summed and normalised to the number of observations. In CM SAF, HOAPS v3.1 ob-servations from individual overpasses are averaged first and then used to compute monthly means. From a mathematical view point, such approaches do not need to be identical be-cause the number of observations over time is not constant. However, the systematic nature and the magnitude of this ef-fect are surprisingly large.
An overpass with only few observations more strongly im-pacts the monthly average in the CM SAF HOAPS v3.1 data set because it has a larger weight after the sub-setting than within the “all-pixel” approach used for HOAPS v3. Further-more, a reduced number of observations is mainly caused by rain screening and the remaining valid observations in the vicinity of heavy rain likely exhibit large WVPA values. Therefore, larger WVPA values in combination with smaller numbers of valid observations within an overpass can lead to a systematic bias in WVPA.
Void data points due to rain are filled by the kriging scheme. Given the tendency of large WVPA values in such areas, also the rain gaps will be filled with large WVPA val-ues. This reasonable approach leads to an increased number of large WVPA values and therefore can explain the system-atic difference.
770 M. Schr¨oder et al.: The CM SAF SSM/I-based total column water vapour climate data record
Discussion
P
ap
er
|
Discussion
P
ap
er
|
Discussi
on
P
ap
er
|
Discussion
P
ap
er
|
Fig. 2.Absolute (in kg m−2, left panel) and relative (in percent, right panel) difference of WVPA between the CM SAF HOAPS v3.1 and the MPI/UHH HOAPS v3.0 averaged over the period 1992–2005.
24
Fig. 2. Absolute (in kg m−2, left panel) and relative (in percent, right panel) difference of WVPA between the CM SAF HOAPS v3.1 and the MPI/UHH HOAPS v3.0 averaged over the period 1992–2005.
are mainly observed in storm track regions in which frequent rain events occur.
3.4 Comparison to WVPA from RSS
As mentioned above, RSS is also providing WVPA from SSM/I and from TMI measurements. The RSS algorithm is a physical retrieval scheme to derive a set of variables (in-cluding total column water vapour) simultaneously from all channels of the SSM/I instrument. The retrievals are obtained via inverse radiative transfer modelling based on a parame-terised solution of the forward radiative transfer equations. Details on the algorithm can be found in Wentz (1997). Ver-sion 6 of the RSS SSM/I WVPA data record and verVer-sion 4 of the TMI WVPA data record were utilised in this compar-ison. The homogenisation techniques, retrieval algorithms, including auxiliary data and temporal and spatial gridding, are completely different between RSS and CM SAF and will be explained below.
3.4.1 Systematic and random deviations
Monthly mean WVPA data for each instrument from RSS have been interpolated to the CM SAF product grid for an easier comparison. Figure 3 shows the bias and root mean square difference of each individual SSM/I and the TMI wa-ter vapour product from RSS versus the homogenised wawa-ter vapour data set from CM SAF.
The overall bias between the two SSM/I based water vapour retrievals is found to be on the order of 0.5 kg m−2, where the CM SAF product tends to be dryer than the RSS product, which is consistent with the findings by Sohn and Smith (2003) mentioned above. The bias against the TMI product is slighly larger with about 0.6 kg m−2. This
is mainly caused by the limited coverage of the comparison within±40◦latitude due to the TMI orbit. On the other hand, the bias is surprisingly small as both algorithms differ signif-icantly concerning the homogenisation techniques, retrieval schemes and precipitation filtering approach used. Two dif-ferent levels of RMSE are seen in the lower panel, where starting from 1991 onwards the RMSE steadily decreases
Discussion
P
ap
er
|
Discussion
P
ap
er
|
Discussi
on
P
ap
er
|
Discussion
P
ap
er
|
Fig. 3.Time series of bias and RMSE between water vapour products from CM SAF and RSS. RSS products are available for each satellite, the CM SAF product is based on inter-satellite homogenised SSM/I brightness temperatures. The temporal coverage of each instrument is given by the colored bars.
25
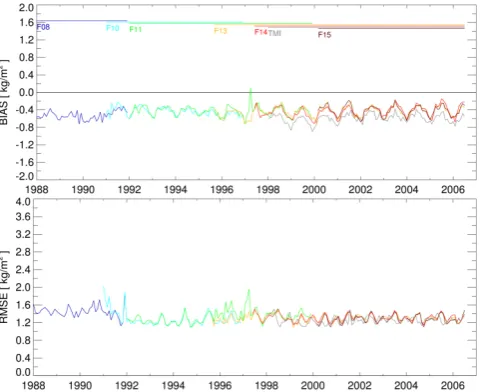
Fig. 3. Time series of bias and RMSE between water vapour products from CM SAF and RSS. RSS products are available for each satellite; the CM SAF product is based on inter-satellite ho-mogenised SSM/I brightness temperatures. The temporal coverage of each instrument is given by the coloured bars.
from values of approximately 2.0 kg m−2 to values around 1.4 kg m−2in the later part of the time series. This must be due to an increased quality of the RSS product, when two or three DMSP satellites are available simultaneously.
Also evident from Fig. 3 is the stable bias after 1991 and the high correlation of the bias and RMSE between individ-ual SSM/I products from RSS and the homogenised data set from CM SAF. From this high correlation at the overlap peri-ods, one can conclude that the homogenisation scheme used in the production of the CM SAF data set is working well as no significant differences occur during the overlap periods compared to the RSS individual satellite products.
M. Schr¨oder et al.: The CM SAF SSM/I-based total column water vapour climate data record 771
product always introduces new satellites at the beginning of a month. Hereby, a different temporal sampling is intro-duced in the two data sets leading to the RMSE peak in January 1991. Peaks in RMSE also occur later throughout the data period, but at these times, they are well correlated among the satellites. These peaks are caused by a different recognition of spatial patterns in the water vapour fields due to different boundary conditions (e.g. sea surface temperature data sets used) that influence RSS’s simultaneous retrieval of all variables, whereas they do not influence the purely statis-tical retrieval of the CM SAF data set that is not using sea surface temperature data.
3.4.2 Trend comparison
To be suitable for trend monitoring, the stability over time is another important issue to be considered. For total column water vapour, Ohring et al. (2005) provides a decadal sta-bility requirement of 0.26 % per decade. Proving evidence for decadal stability is very challenging because global long-term reference observations with sufficient spatial and tem-poral sampling and known uncertainty characteristics are not available over open oceans. Having two data sets derived from the same source only allows the comparison of trends and an analysis of the relative stability of the data sets, which may increase confidence in using them for trend monitoring. After removing the seasonal cycle from both data sets, lin-ear trends over the ylin-ears 1991–2006 are determined. Global maps of the resulting trends for both data sets are shown in Fig. 4. The spatial trend patterns agree well and very small differences are visible close to sea ice edges, which are most likely caused by different ice coverage data sets used during mapping in both data sets. The global mean decadal trend derived from both data sets is 0.45 kg m−2or 1.67 % decade−1for the CM SAF data set, and 0.44 kg m−2 or 1.62 % decade−1for the RSS data set. Thus, the difference of the trends is only 0.05 % decade−1, which is significantly smaller than the estimated trend uncertainties. Thus, the rel-ative stability is fulfilling the requirement stated in Ohring et al. (2005). This increases our confidence in using both sets for trend monitoring. However, both trend estimates are slightly larger than those given in Trenberth et al. (2005) and Mears et al. (2007) who also utilise SSM/I data but consider different time periods (Trenberth et al., 2005; Mears et al., 2007) than used in this study, and more important are only considering the tropics (Mears et al., 2007).
3.5 Comparison against reanalyses
Assimilation of radiances or total column water vapour es-timates into numerical weather prediction (NWP) models is another way of producing a global water vapour data record with the advantage of being physically consistent within the constraints of the model physics. To achieve temporal homo-geneity with respect to model versions and assimilation
sys-tems, NWP centres perform reanalyses, which also allows for the use of more input data inclusive of better quality control. Within this study the following reanalysis data sets are used:
– ECMWF (European Centre for Medium-Range Weather Forecasts) ERA40 re-analysis for 1987–2002 (Uppala et al., 2005);
– ECMWF ERA40 re-analysis (forecast step +24 h)
for 1987–2002;
– ECMWF ERA INTERIM re-analysis for 1989–2006
(Dee et al., 2011);
– JMA (Japan Meteorological Agency) JCDAS-25
re-analysis for 1987–2006 (Onogi et al., 2007).
In order to assess the impact of model changes, the ECMWF operational analysis for 1995–2006 is additionally compared to the CM SAF data set.
The earlier ERA40 re-analysis data set has some known deficiencies in the global water cycle, as discussed in Hage-mann et al. (2005) who found that the ERA40 water cycle changed in several respects compared to earlier re-analyses and that the on-going validation yielded that the ERA40 pre-cipitation has several deficiencies. For data after 1972, the global water budget was found unbalanced and freshwater flux over the ocean was negative in the long-term mean.
In all analyses data sets SSM/I information is assimi-lated either by using retrievals of total column water vapour (ERA40 and JCDAS-25) or by taking directly the SSM/I ra-diances (ERA INTERIM and ECMF operational analysis). Thus, the compared data sets are not independent of each other. However, the analyses not only assimilate SSM/I data but a wealth of other water vapour information from ra-diosondes and other satellite instruments. Given this fact and the complex interactions between variables incorporated in forecasting systems, the analysis represents a best fit through all observations as a whole, but not necessarily for an individ-ual variable or instrument. From this point, it is clear that data sets derived purely from satellite measurements still provide a good basis for re-analysis assessment.
Re-analysis fields are provided at 00:00, 06:00, 12:00 and 18:00 UTC, so that a daily mean can be derived from four equally distributed fields. The CM SAF data set uses the un-equally distributed orbits to construct daily means. This in-troduces additional sampling uncertainty, which is assumed to be small on the global average considered in this compar-ison. All reanalysis data sets have been interpolated to the spatial resolution of the CM SAF product.
772 M. Schr¨oder et al.: The CM SAF SSM/I-based total column water vapour climate data record
Discussion
P
ap
er
|
Discussion
P
ap
er
|
Discussi
on
P
ap
er
|
Discussion
P
ap
er
|
Fig. 4.Regional trends of monthly mean water vapour derived from deseasonalized CM SAF (left) and RSS (right) data sets for 1991–2006. Shown is the monthly trend of the regression analysis in kg m−2.
26
Fig. 4. Regional trends of monthly mean water vapour derived from deseasonalized CM SAF (left) and RSS (right) data sets for 1991–2006. Shown is the monthly trend of the regression analysis in kg m−2.
Discussion
P
ap
er
|
Discussion
P
ap
er
|
Discussi
on
P
ap
er
|
Discussion
P
ap
er
|
Fig. 5.Global mean bias and RMSE for the CM SAF water vapour data set assessed versus the ERA INTERIM re-analysis. Values are in kg m−2based on monthly means.
27
Fig. 5. Global mean bias and RMSE for the CM SAF water vapour data set assessed versus the ERA INTERIM re-analysis. Values are in kg m−2based on monthly means.
0.5 kg m−2 and around 1.5 kg m−2 for the majority of the time period. This is due to the number of satellites used in the CM SAF data set (see Fig. 3 for SSM/I temporal coverage).
The monthly uncertainty given in Fig. 5 has been split up regionally and in terms of the PDF. The results are shown in Fig. 6. The lower panel illustrates the fractional contribu-tion to the total bias and its latitudinal dependence. Intense grey shading shows regions that contribute much to the total bias, i.e. regions where CM SAF WVPA data sets and ERA INTERIM values differ most. The following patterns can be identified: in both hemispheres, the storm track regions show higher differences, predominantly in the respective summer-fall season. This may be due to the different temporal sam-pling in both data sets. A second region of higher differences is the ITCZ, evident as a band-like structure that can be seen throughout the time-series including its inter-annual variabil-ity. This may be explained as the SSM/I signal is saturating at very high water vapour values, where the additional in-formation from other observations in the re-analysis data set still provides reliable values for WVPA.
The upper panel of Fig. 6 shows the differences in WVPA split up in terms of the PDF. At the dry end of the PDF, i.e. at values of less than 6 kg m−2, the bluish colours show that the CM SAF data set contains less grid points with such WVPA values compared to ERA INTERIM. This is compensated by more grid points in the CM SAF data set at values of 6– 12 kg m−2 (reddish colours). This may point to a problem
Discussion
P
ap
er
|
Discussion
P
ap
er
|
Discussi
on
P
ap
er
|
Discussion
P
ap
er
|
Fig. 6.Contributions to the total monthly uncertainty (bias) for the CM SAF WVPA data set assessed versus the ERA INTERIM re-analysis. Values are fractional contribution per latitude bin (lower plot) and absolute difference between PDF values for binned WVPA (upper panel).
28
Fig. 6. Contributions to the total monthly uncertainty (bias) for the CM SAF WVPA data set assessed versus the ERA INTERIM re-analysis. Values are fractional contribution per latitude bin (lower plot) and absolute difference between PDF values for binned WVPA (upper panel).
in the representation of dry atmospheres in the training data set used by Schl¨ussel and Emery (1990). Throughout most of the PDF, the values are very similar.
Global daily bias and RMSE between the analyses and the CM SAF data sets are shown in Fig. 7. As for the bias, the lat-est generation re-analyses, i.e. ERA INTERIM and JCDAS-25, reveal values very close to zero and generally smaller than 1 kg m−2, with quite high stability over time. In the
M. Schr¨oder et al.: The CM SAF SSM/I-based total column water vapour climate data record 773
Discussion
P
ap
er
|
Discussion
P
ap
er
|
Discussi
on
P
ap
er
|
Discussion
P
ap
er
|
Fig. 7.Time series of global daily mean biases and RMSE’s of the CM SAF water vapour column product from SSM/I versus different (re-)analysis data sets. Thin light curves are daily means, bold lines are 30-day moving averages.
29
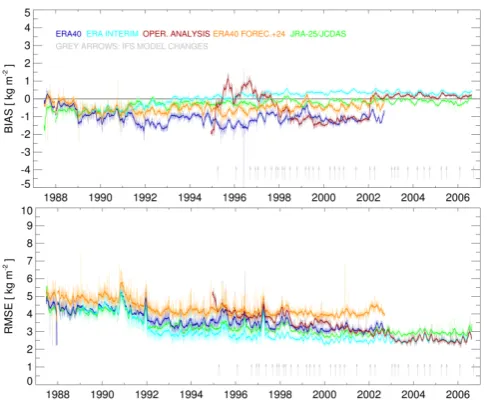
Fig. 7. Time series of global daily mean biases and RMSEs of the CM SAF water vapour column product from SSM/I versus different (re-)analysis data sets. Thin light curves are daily means; bold lines are 30-day moving averages.
Considering RMSE values, ERA INTERIM gives best agreement with the CM SAF product over time, with val-ues around 3 kg m−2, followed by JCDAS-25 and (starting in 2002) the operational analysis from ECMWF. ERA40 ex-hibits similar RMSE values as the operational analysis from ECMWF for the overlapping period for reasons outlined above. Lastly, the ERA40 forecast step +24 h not surprisingly shows the largest RMSE values, as (a) with increasing fore-cast time small scale structures get smeared out and (b) only two forecast base times per day at 00:00 and 12:00 UTC are available. From that, a complex difference in temporal sam-pling between model and satellite arises.
In general, both bias and RMSE values decrease in all cases at the beginning of 1991, which is the time when the second DMSP satellite started to be used in the CM SAF product (see Fig. 3 for SSM/I temporal coverage). The lack of information is more severe for the CM SAF product as the reanalyses also use other additional information for water vapour. The sudden decrease in bias in 2002 is related to the introduction of a temporally variable bias correction scheme which is favourable to the previously used temporally fixed bias correction.
4 Conclusions
A Climate Data Record for total column water vapour de-rived from SSM/I observations based on the Schl¨ussel and Emery (1990) retrieval has been produced at and released by CM SAF (Jonas et al., 2009). It covers the global ice-free oceans and ranges in time from 1987 to 2006. Monthly and daily means with a spatial resolution of 0.5×0.5 degrees are
available. An objective interpolation scheme has been devel-oped and applied in order to allow full spatial data coverage and to also provide uncertainty estimates on grid basis. The CDR is fully transparent and is, together with its documen-tation, freely available from CM SAF. The major objectives for the development and release of this CDR are (a) to ensure continued and sustained processing and development capa-bilities for a mature and widely used WVPA CDR and (b) to establish another WVPA CDR from SSM/I in order to de-crease structural uncertainty.
The quality of the data set was assessed in terms of bias, RMSE and decadal stability by comparison to WVPA data sets provided by Remote Sensing Systems and to various (re-)analyses as well as the prior version of the HOAPS wa-ter vapour data set. In addition, results from previous wawa-ter vapour retrieval comparisons were considered. The evalua-tion results can be summarized as follows:
The retrieval algorithm itself has been found to differ from reference “optimum statistical retrievals” less than 0.5 kg m−2as far as the systematical difference (bias) is con-cerned. The RMSE differences between the Schl¨ussel and Emery (1990) algorithm underlying the CM SAF data set and the benchmark “optimum statistical” retrieval are negligible (Sohn and Smith, 2003).
Based on a comparison to the ERA INTERIM reanaly-sis data set, the CM SAF water vapour data set from SSM/I shows a global mean bias which is below 0.5 kg m−2for the monthly means with a RMSE of less than 2 kg m−2 (after 1991, in 1987–1990 due to temporal sampling slightly higher than 2 kg m−2). For the daily means, similar values are found in either case for the bias, but some outliers in cases of daily RMSE are larger than 2 kg m−2.
The comparison to RSS results revealed bias and RMSE results very similar to corresponding results based on ERA-INTERIM. The trends derived from the RSS and the CM SAF data set based on a least squares regression analysis of the deseasonalised monthly means show excellent agree-ment of the geographical trend patterns. Also, decadal trend values agree very well. The small difference between the decadal trends of 0.05 % decade−1 is an indicator for small structural uncertainty and for high stability, which gives con-fidence in the observed trends.
774 M. Schr¨oder et al.: The CM SAF SSM/I-based total column water vapour climate data record
Acknowledgements. The work presented in this paper has been
performed within the framework of the EUMETSAT Satellite Application Facility on Climate Monitoring (CM SAF), and the financial support of the EUMETSAT member states is highly acknowledged. The development of the original HOAPS data set was partly funded by the Deutsche Forschungsgemeinschaft as part of the SFB-318 at the University of Hamburg as well as by the Helmholtz Society (EXTROP) in Germany. SSM/I data have been partly provided by the NOAA CLASS archive and have partly been procured from Remote Sensing Systems, Santa Rosa, California, USA. RSS, ECMWF and JMA are acknowledged for publically releasing their WVPA data sets.
Edited by: A. Macke
References
Allan, R. P. and Soden, B. J.: Large discrepancy between observed and simulated precipitation trends in the ascending and descend-ing branches of the tropical circulation, Geophys. Res. Lett., 34, L18705, doi:10.1029/2007GL031460, 2007.
Allan, R. P., Soden, B. J., John, V. O., Ingram, W., and Good, P.: Current changes in tropical precipitation, Environ. Res. Lett., 5, 025205, doi:10.1088/1748-9326/5/2/025205, 2010.
Andersson, A., Fennig, K., Klepp, C., Bakan, S., Graßl, H., and Schulz, J.: The Hamburg Ocean Atmosphere Parameters and Fluxes from Satellite Data – HOAPS-3, Earth Syst. Sci. Data, 2, 215–234, doi:10.5194/essd-2-215-2010, 2010.
Chou, C. and Neelin, J. D.: Mechanisms of global warming im-pacts on regional tropical precipitation, J. Climate, 17, 2688– 2701, 2004.
Chou, S.-H., Nelkin, E., Ardizzone, J., and Atlas, R. M.: A compari-son of latent heat fluxes over global oceans for four flux products, J. Climate, 17, 3973–3989, 2004.
Curry, J. A., Bentamy, A., Bourassa, M. A., Bourras, D., Bradley, E. F., Brunke, M., Castro, S., Chou, S. H., Clayson, C. A., Emery, W. J., Eymard, L., Fairall, C. W., Kubota, M., Lin, B., Perrie, W., Reeder, R. A., Renfrew, I. A., Rossow, W. B., Schulz, J., Smith, S. R., Webster, P. J., Wick, G. A., and Zeng, X.: Seaflux, B. Am. Meteorol. Soc., 85, 409–424, 2004.
Dee, D. P., Uppala, S. M., Simmons, A. J., Berrisford, P., Poli, P., Kobayashi, S., Andrae, U., Balmaseda, M. A., Balsamoa, G., Bauer, P., Bechtold, P., Beljaars, A. C. M., van de Berg, L., Bid-lot, J., Bormann, N., Delsol, C., Dragani, R., Fuentes, M., Geer, A. J., Haimberger, L., Healy, S. B., Hersbach, H., Holm, E. V., Isaksen, L., Kallberg, P., K¨ohler, M., Matricardi, M., McNally, A. P., Monge-Sanz, B. M., Morcrette, J.-J., Park, B.-K., Peubey, C., de Rosnay, P., Tavolato, C., Thepaut, J.-N., and Vitart, F.: The ERA-Interim reanalysis: configuration and performance of the data assimilation system, Q. J. Roy. Meteorol. Soc., 137, 553– 597, 2011.
Fennig, K.: Interkalibration verschiedener SSM/I Mikrowellenra-diometer im Hinblick auf eine gemeinsame Nutzung f¨ur eine fernerkundete Klimatologie (Homogenization of different SSM/I microwave radiometers for a combined satellite-derived clima-tology), Diploma Thesis, Met. Institute of the University of Ham-burg, HamHam-burg, 2001.
Gershunov, A. and Roca, R.: Coupling of latent heat flux and the greenhouse effect by large-scale tropical/subtropical dynamics
diagnosed in a set of observations and model simulations, Clim. Dynam., 22, 205–222, 2004.
Hagemann, S., Arpe, K., and Bengtsson, L.: Validation of the hy-drological cycle of ERA40, in: ECMWF ERA-40 Project Report Series, No. 24, European Centre for Medium-Range Weather Forecasts, Shinfield, Reading, UK, available at: www.ecmwf.int/ publications (last access: October 2011), 2005.
Held, I. M. and Soden, B. J.: Water vapour feedback and global warming, Annu. Rev. Energ. Env., 25, 441–475, 2000.
Hollinger, J. P., Lo, R., Poe, G., Savage, R., and Peirce, J.: Special Sensor Microwave/Imager User’s Guide (Washington DC, Naval Research Laboratory), 1987.
IPCC: Climate Change 2007: The Physical Science Basis. Con-tribution of Working Group I to the Fourth Assessment Report of the Intergovernmental Panel on Climate Change, edited by: Solomon, S., Qin, D., Manning, M., Chen, Z., Marquis, M., Av-eryt, K. B., Tignor, M., and Miller, H. L., Cambridge University Press, Cambridge, United Kingdom and New York, NY, USA, 2007.
Jonas, M., Schr¨oder, M., Schulz, J., Andersson, A., Bakan, S., Fennig, K., Grassl, H., and Klepp, C. P.: Verti-cally Integrated Water Vapour from SSM/I – Daily/Monthly Means, Satellite Application Facility on Climate Monitoring, doi:10.5676/EUM SAF CM/HTW SSMI/V001, 2009.
Jost, V., Bakan, S., and Fennig, K.: HOAPS – A new satellite-derived freshwater flux climatology, Meteorol. Z., 11, 61–70, 2002.
Kiehl, J. T. and Trenberth, K. E.: Earth’s annual global mean energy budget, B. Am. Meteorol. Soc., 78, 197–208, 1997.
Kumar, R. M. R. and Schulz, J.: Analysis of freshwater flux cli-matology over the Indian Ocean using the HOAPS data, Remote Sens. Environ., 80, 363–372, 2002.
Lindau, R. and Schr¨oder, M.: Algorithm Theoretical Basis Doc-ument: Objective analysis (Kriging) for water vapour prod-ucts, Ref Nr. SAF/CM/DWD/ATBD/KRIGING, Issue 1.1, 25 June 2010.
Mears, C. A., Santer, B. D., Wentz, F. J., Taylor, K. E., and Wehner, M. F.: Relationship between temperature and precipitable water changes over tropical oceans, Geophys. Res. Lett., 34, L24709, doi:10.1029/2007GL031936, 2007.
Ohring, G., Wielicki, B., Spencer, R., Emery, B., and Datla, R.: Satellite instrument calibration for measuring global climate change, B. Am. Meteorol. Soc., 86, 1303–1313, doi:10.1175/BAMS-86-9-1303, 2005.
Onogi, K., Tsutsui, J., Koide, H., Sakamoto, M., Kobayashi, S., Hat-sushika, H., Matsumoto, T., Yamazaki, N., Kamahori, H., Taka-hashi, K., Kadokura, S., Wada, K., Kato, K., Oyama, R., Ose, T., Mannoji, N., and Taira, R.: The JRA-25 re-analysis, J. Meteorol. Soc. Jpn., 85, 369–432, 2007.
Randel, D. L., Vonder Haar, T. H., Ringerud, M. A., Stephens, G. L., Greenwald, T. J., and Combs, C. L.: A new global water vapor dataset, B. Am. Meteorol. Soc., 77, 1233–1246, 1996.
R¨oske, F.: A global heat and freshwater forcing dataset for ocean models, Ocean Model., 11, 235–297, 2006.
Schl¨ussel, P. and Emery, W. J.: Atmospheric water vapour over oceans from SSM/I measurements, Int. J. Remote Sens., 11, 753– 766, 1990.
M. Schr¨oder et al.: The CM SAF SSM/I-based total column water vapour climate data record 775
and Fluxes from Satellite), International WOCE Newsletter, 32, 20–26, 1998.
Sherwood, S. C., Roca, R., Weckwerth, T. M., and Andronova, N. G.: Tropospheric water vapor, convection and climate, Rev. Geo-phys., 48, RG2001, doi:10.1029/2009RG000301, 2010. Sohn, B. J. and Smith, E. A.: Explaining sources of discrepancy
in SSM/I water vapour algorithms, J. Climate, 16, 3229–3255, 2003.
Sohn, B. J., Smith, E. A., Robertson, F. R., and Park, S. C.: Derived Over-Ocean Water Vapor Transports from Satellite-RetrivedE−P Datasets, J. Climate, 17, 1352–1365, 2004. Trenberth, K. E.: Changes in precipitation with climate change,
Clim. Res., 47, 123–138, doi:10.3354/cr00953, 2011.
Trenberth, K. E., Fasullo, J., and Smith, L.: Trends and variability in column-integrated water vapor, Clim. Dynam., 24, 741–758, 2005.
Uppala, S. M., Kallberg, P. W., Simmons, A. J., Andrae, U., Da Costa Bechtold, V., Fiorino, M., Gibson, J. K., Haseler, J., Her-nandez, A., Kelly, G. A., Li, X., Onogi, K., Saarinen, S., Sokka, N., Allan, R. P., Andersson, E., Arpe, K., Balmaseda, M. A., Beljaars, A. C. M., Vande Berg, L., Bidlot, J., Bormann, N., Caires, S., Chevallier, F., Dethof, A., Dragosavac, M., Fisher, M., Fuentes, M., Hagemann, S., Holm, E., Hoskins, B. J., Isaksen, L., Janssen, P. A. E. M., Jenne, R., McNally, A. P., Mahfouf, J.-F., Morcrette, J.-J., Rayner, N. A., Saunders, R. W., Simon, P., Sterl, A., Trenberth, K. E., Untch, A., Vasiljevic, D., Viterbo, P., and Woollen, J.: The ERA-40 re-analysis, Q. J. Roy. Meteorol. Soc., 131 Part B, 2961–3012, 2005.
Vonder Haar, T. H., Bytheway, J. L., and Forsythe, J. M.: Weather and climate analyses using improved global wa-ter vapor observations, Geophys. Res. Lett., 39, L15802, doi:10.1029/2012GL052094, 2012.
Wentz, F. J.: Recommendations from Utah meeting, Salt Lake City, UT, USA, available at Remote Sensing Systems, Santa Rosa, CA, USA, 1995.